DOI: 10.5532/KJAFM.2010.13.4.157
ⓒ Author(s) 2011. CC Attribution 3.0 License.
Effect of Forest Growth and Thinning on the Long-term Water Balance in a Coniferous Forest
Hyung Tae Choi*
Department of Forest Conservation, Korea Forest Research Institute, Heogiro 57, Dondaemungu, Seoul 130-712, Korea
(Received November 25, 2011; Revised December 14, 2011; Accepted December 14, 2011)
침엽수인공림에서 임분 성장 및 간벌이 장기 물수지에 미치는 영향
최 형 태*
국립산림과학원산림보전부
(2011
년11
월25
일접수; 2011
년12
월14
일수정; 2011
년12
월14
일수락) ABSTRACT
Long-term annual water balances are analyzed for two forest catchments located in Gwangneung covered with forests of different types and ages. The water balance trends of the two catchments from 1982 to 2009 are compared to identify the effect of forest growth and thinning on the water balance in a planted coniferous forest catchment. According to the averaged annual precipitation and runoff for the four designated periods from 1982 to 2009, the water balance of the old natural broad-leaved forest catchment (GB) remained relatively unchanged. In contrast, the young planted coniferous forest catchment (GC) showed significant changes in the water balance due to the forest growing and thinning. The results showed that the catchment runoff decreases with increasing tree age whereas the forest thinning results in an increase in catchment runoff. The mean annual runoff from the catchment GC after thinning increased by 1.7 times, compared with the mean annual runoff before forest thinning. The mean annual runoff from the catchment GB was very stable throughout the period. However, such an effect of forest thinning appeared to last only for about 10 year-period, after which the water yield increment in the catchment GC disappeared. It indicates that the proper forest management should be reconsidered at the interval of 10 years to effectively reduce water loss and increase water yield in the planted coniferous forest.
Key words
:Young planted coniferous forest, Old natural broad-leaved forest, Long-term water bal- ance, Forest thinning
I. INTRODUCTION
In a watershed, forest is necessary to maintain the whole ecosystem since it can contribute to the reduc- tion of storm water discharge before forming danger- ous flood peaks, the prevention from soil erosion on slopes, and the steady water supply into streams and rivers during dry season (Yao et al. , 2001). A water- shed without forest is vulnerable to soil erosion and
debris flow, and can be easily denuded.
While it is well known that forests can contribute to a stable supply of water resources in drought seasons, a little attention has been given to the reduction of water resource in a watershed caused by forest growth and canopy amassment. Overly dense forests may not be considered desirable for watershed management and/or for improved water resource management, particularly when the evaporative water loss from foliage and can-
* Corresponding Author : Hyung Tae Choi ([email protected])
opy is extremely large, resulting in the decreased river runoff (the amount of water resource) (Trimble and Weirch, 1987; Hashino et al ., 1999; MacDonald and Stednick, 2003).
Many studies show that different forest management practices result in different effects on water quantity and quality from a watershed. Stednick (1996) reported that removing 15~30% of the basal area from the Rocky Mountain/Inland Intermountain region leads to a measurable increase in annual water yields. Gener- ally, in areas where precipitation exceeds 18~20 inches, a reduction in tree cover results in increased water yield (MacDonald and Stednick, 2003).
Forest reduces water supply to stream networks by interception, transpiration, evaporation, soil evapora- tion, and leaching. Thus, the loss of water from forest is one of the main factors constructing a hydrological bal- ance. While the studies on the effects of forest manage- ment practices on hydrological balance is increasingly important, it is very expensive to measure the impact of forest growth on hydrological balance at the catchment scale. Therefore, in several studies, hydrological simu- lation models were applied to estimate the impact of land use changes on water balance at the catchment scale (e.g. Bultot et al., 1990; Lorup et al., 1998; Kar- vonen et al. , 1999; Lukey et al ., 2000).
Recently, Korea also has frequently experienced tem-
poral streamflow deficiencies partially in planted conif- erous forests. Most of the planted coniferous forests are afforested since 1970s. Due to the strong policy with the National Forest Development Plans by the Korean government from the early 1970s onwards, total affor- estation area reached 2.2 million ha, which is almost one third of the total forest land of South Korea. Major afforestation species were coniferous trees such as Korean pine, red pine, pitch pine, and larch. Because most of the planted coniferous forests have high tree density, they are in poor health and water conditions.
Therefore, more research is needed to learn about the effects of forest treatments on water yield, and to find how to improve forest practices for better forest water resource management.
This study was carried out to evaluate the effects of forest growth and thinning on the long-term water bal- ance at the catchment scale. Past data of water balance in two catchments with different forest covers were ana- lyzed and used to demonstrate the unexpected reduction of water yield caused by forest increase and growth, and the expected increase of water yield after forest thinning.
II. METHODS AND MATERIALS
2.1. Study site
The study site is located at the Gwangneung experi-
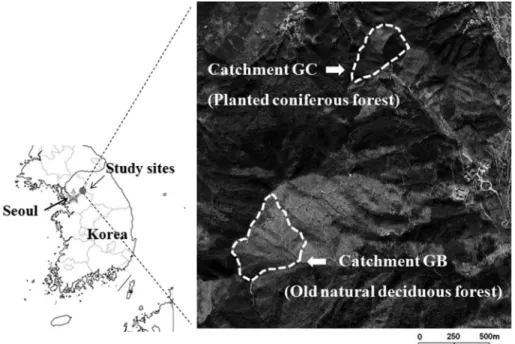
Fig. 1. The location of study sites.
mental forests in the Korea National Arboretum (see Fig. 1), placed about 10km northeast of Seoul. The site is one of the typical mountainous landscapes easily seen in northcentral part of South Korea. The study site consists of two forest catchments with similar catch- ment characteristics while forest type is the only distin- guishably different factor between the two catchments.
One is the planted coniferous forest (Catchment GC), and the other is natural broad-leaved forest (Catchment GB).
Catchment GB is covered with old natural broad- leaved forest, located at 37°44'52''~37°45'16''E and 127°08'34''~127°08'55''N. Most of the trees are older than 90 years, and the area of the catchment is 22 ha.
The main tree species in Catchment GB are Quercus
and Carpinus spp. The bedrock of the catchment is formed by granite gneiss, and the soil texture is sandy loam. The altitude of the catchment is 280~470 m above sea level.
Catchment GC is a small forest catchment, situated between 37°45'45''~37°46'01''E and 127°09'11''~
127°09'28''N. The bed rock and soil texture of catch- ment GC are granite gneiss and sandy loam, respec- tively. The elevation range is between 160 and 290 m above sea level. The area is 13.6 ha, and over 80% of the whole catchment area is covered with coniferous forests that are dominated by Pinus koraiensis, Pinus rigida, and Abies holophylla planted in 1976.
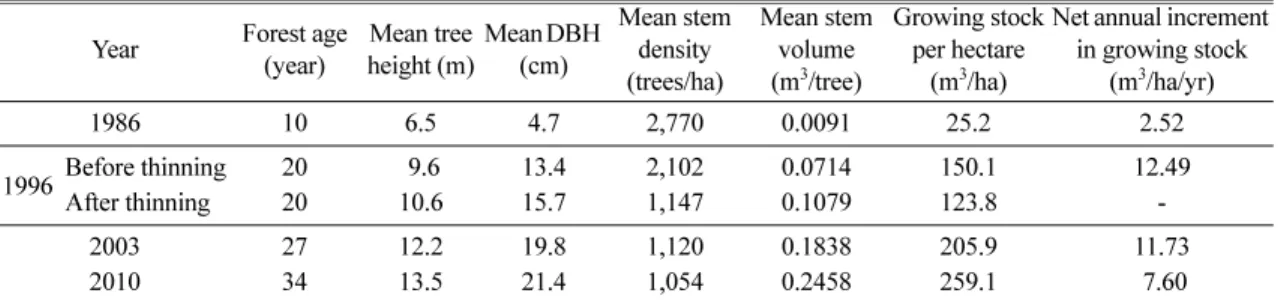
Table 1 shows the change of forest stand structure attributes in the catchment GC during the study period.
As shown in Table 1, the overall stand structure attributes before forest thinning in 1996 were a mean tree height of 9.6 m, a mean DBH of 13.4 cm, a mean stem density of 2,102 trees/ha, a mean stem volume of 0.0714 m
3/tree, and a growing stock per hectare of 150.1 m
3/ha. The original planting density of the conif- erous forests in the catchment GC was 3,000 seedlings/
ha in 1976. However, about 30% of the original tree
population died by windthrowing, withering, or dam- age by disease and insect during the period of 20 years.
After forest thinning, the mean stem density of conif- erous forests was reduced to 1,147 trees/ha, i.e. about 45% of the survival tree population, and the consequent degree of crown closure of forest was adjusted down by 70%. Because the weed trees had been removed in advance, mean tree height, DBH and stem volume of the coniferous forests were slightly increased. How- ever, the growing stock per hectare was decreased by 17.5%, compared to that prior to thinning.
The biggest net annual increment in growing stock was 12.49 m
3/ha/yr during the period when the forest age was between 10 and 20 years. When the forest was 20~27 years old, net annual increment in growing stock was also large as much as 11.73 m
3/ha/yr, indicating the effect of thinning on forest growth promotion.
2.2. Data measurement
In 1979, the first forest hydrological research on water cycle was started in the Gwangneung experimen- tal forests with the title “Monitoring on the Streamflow and Sediment of Forest Catchments” by the Laboratory of Forest Water Resources of Korea Forest Research Institute, and has continued up to now after being renamed as “Monitoring on the Water Cycle of Forest Catchments” since 1989.
Triangular concrete weirs with sharp crested V-notch were established at the outlet of each catchment in 1979, and precipitation and runoff measurement started from 1980. Precipitation was observed mainly using tipping-bucket-rain gauges. In order to improve the accuracy of precipitation measurement, weighing pre- cipitation gauges have been used additionally since 2000. Water level at the weirs was measured by float- ing water level gauges, and runoff was calculated using the rating curves developed for each catchment. Data collection has been relatively successful without signif-
Table 1.
Change of forest stand structure attributes in the catchment GC during the study period Year Forest age
(year) Mean tree
height (m) Mean DBH (cm)
Mean stem density (trees/ha)
Mean stem volume (m
3/tree)
Growing stock per hectare
(m
3/ha)
Net annual increment in growing stock
(m
3/ha/yr)
1986 10 6.5 4.7 2,770 0.0091 25.2 2.52
1996 Before thinning 20 9.6 13.4 2,102 0.0714 150.1 12.49
After thinning 20 10.6 15.7 1,147 0.1079 123.8 -
2003 27 12.2 19.8 1,120 0.1838 205.9 11.73
2010 34 13.5 21.4 1,054 0.2458 259.1 7.60
icant interruptions such as long-term data loss. How- ever, extreme heavy storms and debris flows caused problems at the gauging stations in 1990 and 1998. As a result, the measurement data for both years are not available.
2.3. Data analysis
The rainfall and runoff observation data for both catchments were analyzed and compared by statistical method for the evaluation of water balance changes in the catchments distinguished by their forest types. From the analysis, significant differences in the water bal- ances after forest growth and thinning in a planted coniferous forest catchment can be detected. Based on the records from 1982 to 2009, the time series data of the water balances from both catchments were analyzed using the double sum curves, which is derived from the analysis of the pair correlation of the sums for compared time series (Biba et al., 2009). The curve is linear in homogeneous and consistent series. When the points are deviated from linearity and the possible error in mea- surement caused by natural effects is excluded, an impact of human activity can be presumed (Biba et al.,
2009). The linearity of the double sum curves is graph- ically inspected. The data of the annual precipitation and runoff sums during the study period are expressed graphically for both the catchment GC and GB.
III. RESULTS AND DISCUSSION Figs. 2 and 3 show variations of annual precipitation, runoff, and runoff rates observed from 1982 to 2009 in the catchment GC and GB, respectively. In some years, the monitoring failed because of flood, landslide dam- age, and/or facility improvement.
Due to the close proximity of the two catchments, the mean annual precipitations in the two catchments were very similar during the monitoring period; 1,389 mm in the catchment GC and 1,404 mm in the catchment GB.
The annual precipitation data for the entire monitoring period shows a wide range of temporal variation from 850 to 1,900 mm as shown in Figs. 2 and 3.
Fig. 4 shows the difference between annual precipi- tation and mean annual precipitation during the moni- toring period (1982~2009) in the catchment GC. In Fig. 4, the annual rainfall shows a weak increase over time but it is not statistically significant. According to Korea Meteorological Administration, the annual pre- cipitation in Korean Peninsula shows a weak increasing trend during the last 100 years, and this trend can be considered as an evidence for climate change (Korea Meteorological Administration, 2009). Therefore, the increasing trend of annual precipitations observed in the catchment GC since 1982 also can be linked to the climate change in Korean Peninsula.
Fig. 2.
Annual precipitation, runoff and runoff rate in the catchment GC (Gwangneung coniferous forest catchment).
Fig. 3.
Annual precipitation, runoff and runoff rate in the catchment GB (Gwangneung broad-leaved forest catchment).
In contrast to the similar precipitation pattern, two catchments produced different results regarding runoff response during the monitoring period. The mean annual runoff rates of the two catchments are 62% for catchment GB and 48% for catchment GC, respec- tively.
It is noticeable that the two catchments have similar environmental characteristics such as soil, bed rock, topography, and climate. The forest type and age were the only factors that were different to make effects on the runoff analysis; the forest in the catchment GB is old natural broad-leaved forest, but the forest in the catchment GC is relatively young planted coniferous forest. Although the rainfall-runoff response in a catch- ment is influenced by diverse factors, in this study, the forest type and age are considered as the most impor- tant factors affecting the runoff responses of the two catchments.
Table 2 presents the variation of the averages of annual precipitation and runoff of the four designated periods in the catchment GC and GB. The average of annual precipitations for each individual period contin- uously increased throughout the years. The mean
annual precipitation in the final period was about 1.3 times larger than that in the first period. During the cor- responding periods, the mean annual runoff of the catchment GB in each individual period also increaseds in relation to the increment of mean annual precipita- tion for the corresponding period.
In comparison with the average annual runoff pattern in the catchment GB, the average of annual runoff for each individual period in the catchment GC did not increase continuously through the given years, but rather fluctuated. It is noticeable that the averages of annual runoff in the second and final period indicate clear decrease despite the mean annual precipitation increment.
For the second period (1987-1996), the tree ages of the coniferous forest in the catchment GC ranged from 10 to 20 years old, and the net annual increment of growing stock was also largest in this period, as shown in Table 1. Coniferous trees grow rapidly in this period and the forest canopy becomes dense and closed, resulting in the increment of rainfall interception and evapotranspiration. In addition, the mean annual runoff of the period decreased by about 10% compared with the first period in spite of the increment of mean annual precipitation. Therefore, the decrement of mean annual runoff in the catchment GC in the second period repre- sented the increment of water loss such as interception and evapotranspiration by robust coniferous forest growth.
For the third period (1997-2005), the mean annual runoff in the catchment GC was 1.7 times larger than that for the second period. As shown in Table 2, the mean annual runoff in the catchment GC before forest thinning (i.e. during the first and second periods) is about 70% of the mean annual runoff in the catchment GB. However, after forest thinning, the mean annual runoff in the catchment GC became almost equal to that in the catchment GB. The third period is the first decade after the forest thinning was carried out across
Fig. 4.
Increasing trend of annual precipitation during the whole monitoring periods in the catchment GC (Gwangne- ung coniferous forest catchment). P – P
meanmeans the dif- ference between annual precipitation and mean annual precipitation.
Table 2.
Average values of annual precipitation, runoff and runoff rate of for designated periods in the catchment GC and GB
Catchment GC Catchment GB
Period Annual
precipitation (mm)
Annual runoff
(mm)
Runoff rate (%)
Annual precipitation
(mm)
Annual runoff (mm)
Runoff rate (%)
1982~1986 1,227.5 596.6 48.6 1,224.4 780.3 63.7
1987~1996 1,307.7 553.9 42.4 1,352.2 840.6 62.2
1997~2005 1,498.6 919.3 61.3 1,499.7 923.7 61.6
2006~2009 1,556.6 794.4 51.0 1,555.4 1,040.9 66.9
the coniferous forests in the catchment GC. Therefore, the fact that annual runoff in the catchment GC increased during the third period implies that the forest thinning affects annual runoff toward increment.
Ruprecht et. al . (1991) studied the effect of forest thinning on hydrology in a small forest catchment in southwest Western Australia. According to their results, the uniform, intensive thinning treatment reduc- ing crown cover from 60 to 14% resulted in an increase in streamflow to approximately 20% of annual rainfall, compared with a streamflow yield of 6% of annual rainfall before thinning. Stoneman (1993) also showed that streamflow increased from 0.5% of rainfall before thinning to 7.6% of rainfall after thinning in the jarrah ( Eucalyptus marginata ) forest on a small catchment.
They attributeded the reduction in interception and evaporation from the forests to be the major causes of increased streamflow.
The previous studies conducted in this study site also showed that forest thinning in a coniferous forest reduced the interception loss and helped to supply more moisture to forest soil (Kim et al ., 2003; Kim et al., 2004; Kim et al., 2005, Jun et al. , 2005). In those studies, the interception loss and canopy storage capac- ity of the coniferous forest canopy decreased by more tan 10% after forest thinning, resulting in higher soil moisture in the thinned forest than in the un-thinned forest throughout the year. Therefore, the decrement of interception loss and the increment of soil moisture contributed to increasing runoff after forest thinning.
Also, the reduction of growing stock after thinning may be a factor that explains the decrement of intercep- tion loss after thinning. As shown in Table 1, forest thinning decreased the growing stock of the coniferous forests by 17.5% in the catchment GC, which decreased the surface area of trees and leaves to inter- cept rain drops.
In contrast, during the final period when the conifer- ous forests was over 30 years and over 10 years after thinning, the mean annual runoff in the catchment GC decreased despite the increasing annual precipitations.
However, the mean annual runoff in the catchment GB increased during this period. This finding shows that the effect of forest thinning on the increment of water yield by decreasing interception and evapotranspiration was not effective after 10 years. However, net annual increment of growing stock was actually lower than the previous period. Forest canopy became closed again and the water loss of coniferous forest increased,
thereby reducing the mean annual runoff.
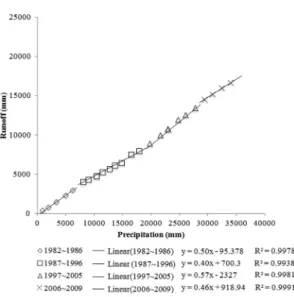
Fig. 5 shows the double mass curves of annual pre- cipitation and runoff in the catchment GC and GB from 1982 to 2009. In this figure, the circles represent the double mass curve of the catchment GB, and the squares represent the double mass curve of the catch- ment GC. The cross marks indicate the differences between the double mass curves of the two catchments.
As shown in Fig. 5, the differences between the dou- ble mass curves of catchment GB and GC increased steadily, indicating that during this period the annual runoff in the catchment GC decreased more rapidly than that in the catchment GB. However, the increasing trend of the difference between the two double mass curves changed in the middle of the study period. The third period (i.e., the first decade after forest thinning in the catchment GC) is the turning point of the trend as seen in Table 1. The continuous trend of the reduced runoff from the catchment GC (in comparison with the runoff from the catchment GB) changed after the forest thinning.
Fig. 6 and 7 show the results of linear regression analysis for each individual period in the double mass curve of annual precipitation and runoff in the catch- ment GC and GB. As shown in Fig. 6, for the first period, trend line slope is 0.5. For the second period, the slope of trend line becomes more moderate, 0.4.
This change implies that the decrease of annual runoff is caused by forest growth in a young planted conifer- ous forest. The slope becomes steeper (0.57 for the third period), showing that the runoff in the catchment GC was increased by forest thinning. However, such effect lasted only for a limited period. In the final period, the slope of the trend line became moderate
Fig. 5.
Double mass curves of annual precipitation and run-
off in the catchment GC and GB during 1982 to 2009.
again (i.e., 0.46), indicating the decrease of annual run- off. This result may be used to identify the effective period of forest thinning to increase water yield in a coniferous forest. In contrast, the catchment GB showed no significant change in its trend line slopes for the periods as seen in Fig. 7.
IV. CONCLUSIONS
In order to investigate the effect of forest growth and
thinning on the long-term water balance in a planted coniferous forest catchment (GC), the rainfall runoff responses from 1982 to 2009 were compared against those for an old natural broad-leaved forest catchment (GB) located in Gwangneung, Korea..
More than 80% of the area of the catchment GC is covered with coniferous forests dominated by Pinus koraiensis, Pinus rigida and Abies holophylla , which were planted in 1976. In 1996, approximately 45 % of the surviving tree population was thinned in the catch- ment GC, and the degree of forest crown closure was adjusted down by 70%.
The comparison of mean annual runoff rates during the monitoring period of two catchments confirms that the water loss from the young planted coniferous for- ests is greater than that of the old natural broad-leaved forests. The water balance of the catchment GB remains relatively unchanged. In contrast, the planted conifer- ous forest catchment showed substantial changes in the water balance due to the forest growing and thinning.
In the planted coniferous forest, catchment runoff decreased with increasing tree age because more mature forests generally intercept and evaporate more water. On the other hand, forest thinning increased annual runoff in the planted coniferous forest by reduc- ing interception and evaporation loss. The mean annual runoff after thinning in the catchment GC increased by a factor of almost two, compared with that before forest thinning. This value is almost equivalent to the mean annual runoff in the catchment GB during the corre- sponding period.
As expected, forest thinning in the coniferous forest results in in an increase in catchment runoff, but the effect lasted less than ten years. Therefore, to effec- tively reduce water loss and increase water yield in the planted coniferous forest, a proper forest management such as forest thinning should be conducted repeatedly at the interval of less than 10 years.
적 요
침엽수인공림에서 임분 성장 및 간벌이 장기 물수지 에 미치는 영향을 파악하기 위하여 광릉 침엽수인공림 유역 및 활엽수천연림유역에서 1982년부터 2009년까 지 28년에 걸쳐 관측한 연강수량 및 연유출량의 변화 를 분석하였다. 광릉 침엽수인공림유역은 1976년에 유 역 전반에 걸쳐 잣나무와 전나무, 리기다소나무가 3,000본/ha의 밀도로 식재되었으며, 1996년에 잔존 본 Fig. 6.
Results of linear regression analysis for each period
in the double mass curve of annual precipitation and runoff in the catchment GC.
Fig. 7.
Results of linear regression analysis for each period
in the double mass curve of annual precipitation and runoff
in the catchment GB.
수의 약 45%를 간벌하였다. 1982년부터 2009년까지 의 기간을 광릉 침엽수인공림유역 내 침엽수림의 영급 을 기준으로 4개 기간으로 구분하여 연평균 강수량 및 유출량을 비교한 결과, 활엽수천연림유역의 기간별 연 평균 유출량은 강수량이 증가함에 따라 동일하게 증가 하는 추세를 보였으나, 침엽수인공림유역에서는 임령증 가 및 간벌 실시에 따라 증감을 반복하는 것으로 나 타났다. 간벌을 실시하지 않은 침엽수인공림은 임령이 증가할수록 높은 식재밀도로 인해 수관울폐도가 과도 하게 높아지고 이로 인해 수관차단 및 증산량 증가 등 물손실이 커진다. 본 연구에서도 간벌 실시전 침엽 수인공림유역의 연평균 유출량이 감소하였으나 간벌 실 시 후에는 간벌 전에 비해 연평균 유출량이 약 1.7배 증가하는 등 유출량 증가 경향이 뚜렷하였다. 이러한 경향은 연강수량 및 연유출량의 이중 누가곡선 비교분 석에서도 동일하게 나타났다. 본 연구에서는 간벌 후 약 10년 경과시 연강수량의 뚜렷한 증가 경향에도 불 구하고 침엽수인공림유역의 유출량이 다시 감소하였는 데, 이는 임분이 성장함에 따라 수관차단 등 물손실량 이 다시 증가하기 때문이다. 따라서, 침엽수인공림유역 에서 지속적인 수자원 확보를 위해서는 10년 이내의 간격으로 적정한 밀도의 간벌을 반복해서 실시하는 것 이 바람직할 것으로 판단된다.