Prospective Study of Central versus Peripheral Obesity in Total Knee Arthroplasty
7
0
0
전체 글
(2) 320 Armstrong et al. Prospective Study of Central vs. Peripheral Obesity in TKA bution of adipose tissue and its effect on surgical difficulty10-12). We hypothesized that anthropometric factors would be more predictive of surgical difficulty than BMI alone. Thus, we sought to analyze anthropometric measurements, radiographic knee alignment, and patient-reported scores to understand the rela tionship between body fat distribution and surgical complexity. Our hypothesis suggests that central versus peripheral adipose distribution would more closely relate to surgical difficulty when compared to BMI.. Materials and Methods Seventy-eight patients were prospectively enrolled at a single high-volume (total volume of primary arthroplasty greater than 1,000 cases per year) arthroplasty referral institution, with 67 pa tients completing primary unilateral or staged bilateral TKA for knee OA between June 2015 and June 2016. Exclusion criteria were age less than 18 years at the time of surgery, revision arthro plasty indication, simultaneous bilateral primary knee arthroplasty, post-traumatic arthritis, and retained hardware. Enrolled patients were stratified into one of four classes according to the World Health Organization (WHO) schema on BMI: not obese (<30.0), class I (30.0–34.9), class II (35.0–39.9), and class III (>40.0). All anthropometric measurements, except those carried out intraoperatively, were obtained at the preoperative visit and within four weeks of the surgery. Preoperative anthropometric measurements were taken with an inelastic, flexible tape measure. by trained study personnel according to Fig. 1. Anthropometric measurements included abdominal girth (measured around both the umbilicus and anterior-superior iliac spine [ASIS]), superior knee circumference (measured four centimeters superior to the patella), inferior knee circumference (measured four centime ters inferior to the patella), ankle circumference (measured two centimeters superior to the malleoli), and leg length (measured from ASIS to sole of heel). Three indexes were created for these anthropometric measurements: superior knee index (leg length/ superior knee circumference), inferior knee index (leg length/ inferior knee circumference), and superior knee index/inferior knee index. Goniometric measurements included an initial pre operative range of motion (ROM). Intraoperative anthropometric measurements were taken with an inelastic ruler by trained study personnel according to Fig. 2. Anthropometric measurements of the incision included depth of incision (measured in millimeters in two areas: the quadriceps tendons and the midpoint of the patella) and length of incision (measured in centimeters at closure). Goniometric measure ments for ROM were performed similarly to preoperation in the supine position. Tourniquet time was determined based on the time from inflation of the cuff just prior to incision to the time of deflation of the cuff immediately after incision closure. Pre- and postoperative radiographic measurements were used to determine the femorotibial alignment. Alignment was evalu ated using a system as previously described13). Knee Injury and Osteoarthritis Outcome Score (KOOS) surveys were obtained at the preoperative visit and within four weeks of the. A B. G H C D. I E F. Fig. 1. Preoperative measurement diagram. A: abdominal girth at um bilicus, B: abdominal girth at anterior-superior iliac spine (ASIS), C: superior knee circumference, D: inferior knee circumference, E: ankle circumference, F: leg length from ASIS to sole of heel.. Fig. 2. Intraoperative measurement diagram. G: depth of incision at quadriceps, H: depth of incision at patella, I: length of incision..
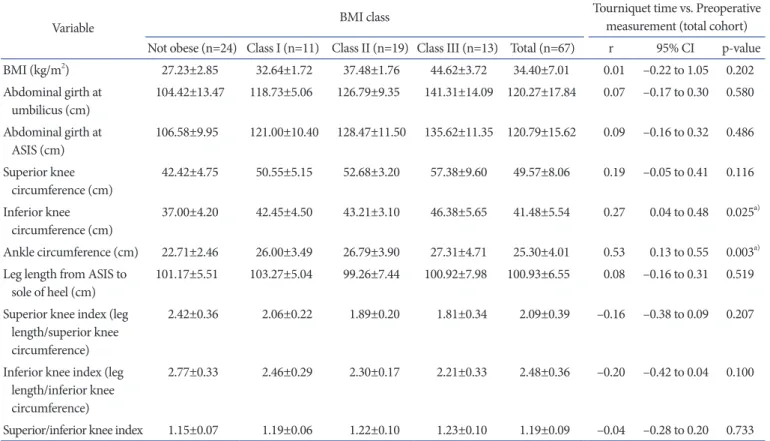
(3) Knee Surg Relat Res, Vol. 30, No. 4, Dec. 2018. surgery. Patient-reported scores were recorded for each of five subcategories to assess the knee and associated conditions on a scale of 0-100, with zero indicating the most severe knee problems. The mean and standard deviation were calculated for demo graphic and clinical characteristics, anthropometric measure ments, radiographic knee alignments, and KOOS categories within each WHO obesity BMI class. Associations between an thropometric measurements including BMI and tourniquet time. 321. were evaluated using Pearson correlation coefficients. Linear regression analysis was used to determine the correlation coef ficient, r, and the significance when comparing BMI and each anthropometric measurement to tourniquet time. The type I error rate α was set at 0.05 and used to determine the confidence interval. All statistical tests were two-sided, and p-values <0.05 were considered statistically significant. Statistics were calculated using statistical software (R ver. 3.4; https://www.r-project.org).. Table 1. Patient Characteristics Characteristic. BMI class Not obese (n=24). Class I (n=11). Class II (n=19). Class III (n=13). Total (n=67). Age (yr). 64.75±8.27. 62.55±7.70. 66.47±10.22. 60.15±8.06. 63.99±8.85. No. of males (%). 10 (41.67). 8 (72.73). 4 (21.05). 5 (38.46). 27 (40.30). Height (in). 66.48±3.87. 67.82±4.45. 65.37±3.50. 66.12±4.71. 66.31±4.03. Weight (lb). 172.2±29.49. 213.4±20.75. 228.5±27.08. 279.5±50.93. 215.3±50.76. BMI (kg/m2). 27.23±2.85. 32.64±1.72. 37.48±1.76. 44.62±3.72. 34.40±7.01. Tourniquet time (min). 66.46±16.89. 75.55±17.15. 77.00±17.95. 73.38±19.48. 72.28±17.93. Values are presented as mean±standard deviation and recorded preoperatively in the clinic within four weeks of surgical date. BMI: body mass index. Table 2. Preoperative Anthropometric Measurement in Relation to Tourniquet Time Tourniquet time vs. Preoperative measurement (total cohort). BMI class. Variable. Not obese (n=24) Class I (n=11) Class II (n=19) Class III (n=13) Total (n=67) 2. BMI (kg/m ). r. 95% CI. p-value. 27.23±2.85. 32.64±1.72. 37.48±1.76. 44.62±3.72. 34.40±7.01. 0.01. –0.22 to 1.05. 0.202. Abdominal girth at umbilicus (cm). 104.42±13.47. 118.73±5.06. 126.79±9.35. 141.31±14.09. 120.27±17.84. 0.07. –0.17 to 0.30. 0.580. Abdominal girth at ASIS (cm). 106.58±9.95. 121.00±10.40. 128.47±11.50. 135.62±11.35. 120.79±15.62. 0.09. –0.16 to 0.32. 0.486. Superior knee circumference (cm). 42.42±4.75. 50.55±5.15. 52.68±3.20. 57.38±9.60. 49.57±8.06. 0.19. –0.05 to 0.41. 0.116. Inferior knee circumference (cm). 37.00±4.20. 42.45±4.50. 43.21±3.10. 46.38±5.65. 41.48±5.54. 0.27. 0.04 to 0.48. 0.025a). Ankle circumference (cm). 22.71±2.46. 26.00±3.49. 26.79±3.90. 27.31±4.71. 25.30±4.01. 0.53. 0.13 to 0.55. 0.003a). Leg length from ASIS to sole of heel (cm). 101.17±5.51. 103.27±5.04. 99.26±7.44. 100.92±7.98. 100.93±6.55. 0.08. –0.16 to 0.31. 0.519. Superior knee index (leg length/superior knee circumference). 2.42±0.36. 2.06±0.22. 1.89±0.20. 1.81±0.34. 2.09±0.39. –0.16. –0.38 to 0.09. 0.207. Inferior knee index (leg length/inferior knee circumference). 2.77±0.33. 2.46±0.29. 2.30±0.17. 2.21±0.33. 2.48±0.36. –0.20. –0.42 to 0.04. 0.100. Superior/inferior knee index. 1.15±0.07. 1.19±0.06. 1.22±0.10. 1.23±0.10. 1.19±0.09. –0.04. –0.28 to 0.20. 0.733. Values are presented as mean±standard deviation. BMI: body mass index, CI: confidence interval, ASIS: anterior-superior iliac spine. a) Significant difference..
(4) 322 Armstrong et al. Prospective Study of Central vs. Peripheral Obesity in TKA Results Demographic and clinical characteristic data for the 67 pa tients undergoing TKA is presented in Table 1. There were 27 males and 40 females with an average age at time of surgery of 63.99 ±8.85 years. The average BMI for the overall sample was 34.40±7.01 kg/m2, and the average tourniquet time was 72.28±17.93 minutes. The number of patients in each category of BMI is shown in Table 1.. In Tables 2–4, the mean and standard deviation was determined for each preoperative measurement for each BMI class. There was no significant difference comparing BMI to tourniquet time. Two anthropometric measurements, inferior knee and ankle circumferences, had a significant relationship to tourniquet time, with p-values of 0.025 and 0.003, respectively. Intraoperative anthropometric measurements included incision depth in two areas, incision length, and the change in ROM. The depth of the incision at the quadriceps was the only measurement with a sig. Table 3. Intraoperative Anthropometric Measurement in Relation to Tourniquet Time Tourniquet time vs. Intraoperative measurement (total cohort). BMI class. Variable Not obese (n=12) Class I (n=7) Depth of incision at quadriceps (mm) Depth of incision at patella (mm) Length of incision (cm) Change in range of motion (°). r. 95% CI. p-value. 12.92±3.00. 15.29±3.20. Class II (n=11) Class III (n=10) Total (n=40) 20.62±13.28. 25.20±10.97. 18.52±10.07. 0.38. 0.08 to 0.62. 0.014a). 5.67±2.27. 5.57±1.51. 9.68±7.75. 11.70±3.92. 8.26±5.26. 0.25. –0.07 to 0.52. 0.119. 15.02±0.95. 16.50±1.04. 17.41±2.80. 17.50±3.61. 16.56±2.57. 0.15. –0.17 to 0.44. 0.343. +20.83±18.16. +23.57±22.02. +38.45±20.02. +29.80±20.63. +28.40±20.48. 0.16. –0.16 to 0.45. 0.325. Values are presented as mean±standard deviation. BMI: body mass index, CI: confidence interval. a) Significant difference. Table 4. Radiographic Knee Alignment in Relation to Tourniquet Time Tourniquet time vs. Femorotibial alignment (total cohort). BMI class. Variable. r. 95% CI. p-value. Preoperative knee alignment (°). Not obese (n=18) Class I (n=7) Class II (n=16) Class III (n=9) Total (n=50) 184.1±7.7. 197.2±3.2. 180.6±6.8. 180.6±9.2. 182.9±8.5. 0.02. –0.26 to 0.30. 0.900. Improvement in femorotibial alignment (°). +2.33±5.10. +8.57±6.75. +3.94±4.28. +3.67±5.32. +3.96±5.37. 0.20. –0.08 to 0.45. 0.166. Values are presented as mean±standard deviation. BMI: body mass index, CI: confidence interval. Table 5. Body Mass Index (BMI) versus Knee Injury and Osteoarthritis Outcome Score (KOOS) KOOS category. BMI class Not obese (n=17). Class I (n=9). Symptom. 44.33±16.75. 53.17±17.99. 44.35±21.07. Pain. 42.65±16.75. 44.44±13.54. Function in daily living. 51.56±20.08. 62.25±15.69. Function in sport and recreation. 82.65±28.46. Knee-related quality of life. 30.15±19.67. 100±0 30.56±16.37. BMI vs. KOOS (total cohort). Class II (n=12) Class III (n=11). Total (n=49). r. 95% CI. p-value. 46.10±21.95. 46.36±19.00. 0.06. –0.23 to 0.33. 0.702. 43.75±14.85. 41.67±16.80. 43.03±15.31. –0.03. –0.31 to 0.26. 0.858. 56.99±11.44. 48.93±16.63. 54.26±17.18. –0.04. –0.31 to 0.25. 0.810. 98.75±3.11. 91.36±22.81. 91.73±20.86. 0.23. –0.06 to 0.48. 0.113. 28.65±18.36. 23.86±11.12. 28.44±16.83. –0.14. –0.41 to 0.15. 0.336. Values are presented as mean±standard deviation. There was no significant difference when comparing KOOS to BMI for each of the five categories. CI: confidence interval..
(5) Knee Surg Relat Res, Vol. 30, No. 4, Dec. 2018. nificant correlation with tourniquet time. Radiographic measurement values for the preoperative knee alignment, as well as the improvement in femorotibial alignment (change in alignment between preoperative and postoperative Xrays) showed no significant relationship toward tourniquet time. The KOOS scores for the cohort are shown in Table 5. Mean reported scores and their standard deviations were compared among BMI classes. There was no significant difference when comparing KOOS to BMI for each of the five categories: symp toms (p=0.702), pain (p=0.858), function in daily living (p=0.810), function in sport and recreation (p=0.113), and knee-related quality of life (p=0.336).. Discussion BMI, as a global measure of obesity, fails to consider patients who have adipose tissue concentrated either centrally (appleshaped body) or peripherally (pear-shaped body). Thus, this pro spective study suggests that distribution of body fat has clinical implications for surgical procedures in the extremities like TKA. As we hypothesized, BMI should not be the sole indicator of surgical difficulty; local extremity anthropometric measurements were more indicative of surgical difficulty. Our results suggest that certain lower extremity anthropometric measurements are more indicative of tourniquet time than BMI. In particular, the preoperative measurements, inferior knee and ankle circumferences, were both statistically related to increased tourniquet time. Fat deposition in these regions directly influence the amount of surgical exposure that may be required during TKA. Additionally, intra-operative measurement of the depth of the incision at the quadriceps tendon was a significant indicator of increased tourniquet time, while all other intraoperative mea surements were not. This may be due to the fact that the quad riceps tendon is the location most proximate to TKA exposure, when compared to the other measures. Surgical exposure is lim ited by the mobility of the extensor mechanism, which is directly influenced by the extent of the quadriceps tendon arthrotomy incision and time required to safely expose the knee joint. Our findings indicate that higher classes of BMI showed in creased variability between body measurements. Therefore, more obese patients, who may be at highest risk of complications10-12), had the largest variance in peripheral adipose fat tissue. However, patients with lower scores in peripheral measurements, such as inferior knee circumference, retained higher BMIs based on their central obesity. This correlation held despite the fact that overall BMIs did not correlate with increased surgical difficulty. BMI in. 323. and of itself did not correlate with increased tourniquet time, sup porting the conclusion by Lozano et al.14). Interestingly, in higher BMI classes, the patients with lower peripheral measurements (which correspond to improved tourniquet times) may have increased central obesity and higher BMIs. As we hypothesized, BMI should not be the sole indicator of surgical difficulty, as local extremity anthropometric measurements were more indicative of surgical difficulty. Reliance on anthropometric measures in other clinical scenar ios provides important indications. For example, central obesity measures such as waist circumference and waist-to-hip ratio have been proven as better indicators of diabetes and cardiovascular diseases than BMI15). BMI reduces body composition into a single value, neglecting fat-free mass, which is beneficial to tibial cartilage volume, and fat mass, which is deleterious to weight loading of the joint15). Anthropometric measures, such as those employed in this study, can better be associated for differences in other metrics like fat-free mass and fat mass. Notwithstanding evidence of increased risk for obese patients undergoing TKA, BMI in isolation may not adequately assess risk stratification for a number of other reasons. BMI was originally developed in the nineteenth century as means of determining obesity in large population samples, rather than individuals16). Despite the index’s wide adoption in orthopedic clinics for its simplicity and cost-effectiveness in diagnosis, the WHO main tains that BMI should be used with caution on an individual basis, as it does not accurately account for adipose distribution or health risks in individuals17). Physicians often rely on BMI as a quantitative measure of obesity for surgical difficulty, yet there is no consensus on a cutoff value18). As a result, many patients who may be healthy candidates for TKA are either referred by physicians to seek weight counseling programs or may be denied surgery. Accordingly, Han et al.19) found that groups of patients below and above 25 BMI had similar Knee Society Scores, ROM, patellofemoral symptoms, complication rate, and infection rate five years after TKA surgery. Finally, BMI may misdiagnose indi viduals as obese who are otherwise healthy candidates for TKA. For instance, nearly half of overweight individuals may be meta bolically healthy, despite 29% class I obesity and 16% class II/III labeled as obese20). Importance is placed on precise alignment and balancing of the prosthesis in obese patients due to the weight-bearing demands placed on the joint5,21). With each pound of weight adding a fourfold increase in the load exerted on each knee per step, even small malalignment can be magnified severely and may lead to premature revision22) in an obese population. In a retrospective.
(6) 324 Armstrong et al. Prospective Study of Central vs. Peripheral Obesity in TKA review of knee radiographs, Watts et al.23) found that increased complications and infection were associated with increased ante rior knee subcutaneous fat thickness as measured on lateral knee radiographs. Radiographic knee alignment results from this study suggest an improvement in alignment across all BMI categories postoperatively. While there was no significance in relation to tourniquet time for both BMI and improvement in femorotibial alignment of the knee, we did find that class I had the greatest improvement in alignment of 8.57°. In our study, we did not find a compromise in accurate postoperative knee alignment based on BMI category, which supports that mechanical alignment can be achieved safely even in more obese patients. The KOOS measures collected demonstrated no significant dif ference with respect to BMI for any of the subcategories: symp toms, pain, function in daily living, function in sports and rec reation, and knee-related quality of life. This would suggest that BMI alone is not an adequate evaluation technique for patientreported condition. Furthermore, division of the cohort by BMI class revealed a larger variance in symptoms and pain for class III patients than lower BMI classes preoperatively. We suggest that the larger disparity in pain and symptoms in class III patients may be related to differing concentration of adipose tissue either centrally or peripherally resulting in varied levels of joint degen eration. Spicer et al.24) found that patients in class III had the low est KOOS scores, but the absolute improvement was independent of BMI. This supports our finding that the great variance in fat concentration in class III in particular may have a greater effect on KOOS than BMI. Among obese patients, reported knee-relat ed quality of life showed a dramatic decrease from class I to class III. Although patients with the highest BMI have been tradition ally thought of as having the greater risk for surgical complica tions10-12), extra measures should be taken to assist them, as they suffer from the greatest drop in quality of life scores. Additional evaluation criteria would be beneficial to obese patients, as Eth gen et al.25) found that patients with poorer knee-related quality of life experienced the greatest improvement. Despite the prospective study design, this study has several limitations. While tourniquet time has been used in the orthope dic field as a useful surrogate to measure surgical difficulty, there are many confounding factors. All surgery was performed in a standardized fashion with the same implants and by fellowshiptrained arthroplasty surgeons with a minimum of 10 years of practice and greater than 300 yearly case volume; however, we acknowledge that surgeon factors may influence particular out comes. This study may not be generalizable to those patients with post-traumatic arthritis, significant bone loss, prior arthroplasty. surgery/revision arthroplasty, simultaneous bilateral primary knee arthroplasty, retained hardware, or mid- and long-term complications, such as deep infection or mechanical prosthesis loosening, as intraoperative surgical difficulty was the primary purpose of our study. In addition, we had no patients with coro nal/sagittal plane deformity greater than 15° and no flexion contractures greater than 15° preoperatively. Clearly, this would add to our understanding of the relationship between obesity and complications and would be useful in long-term prospective follow-up in large patient cohorts. Other preoperative studies other than anthropometric measurements could be applied to de termine fat tissue concentration: dual-energy X-ray absorptiom etry, computed axial tomography, magnetic resonance imaging, magnetic resonance spectroscopy, positron emission tomogra phy, and ultrasound26). Furthermore, limb circumference may be dependent on relative concentrations of other tissues, including bone size and muscle volume. In this study, we sought to employ measurements (i.e., anthropometric) that are readily available to any surgeon and obviate the significant costs associated with other advanced imaging modalities.. Conclusions In conclusion, BMI alone should not be used as a measure of surgical difficulty, and may actually be a poor indicator when compared to local anthropometric measures. Consideration of central versus peripheral fat concentration can provide a more proscriptive view for surgical risk stratification. Patients that may be denied TKA due to high BMI alone might still be potential surgical candidates when they exhibit suitable peripheral obesity and overall medical conditions optimized. Therefore, surgeons should employ additional measures of risk assessment for surgical difficulty in obese patients apart from BMI alone. Future research should be performed in larger and more diverse patient popula tions and at longer follow-up in order to further elucidate relation ships between body habitus and surgical complexity in TKA.. Conflict of Interest No potential conflict of interest relevant to this article was re ported.. References 1. Wagner ER, Kamath AF, Fruth K, Harmsen WS, Berry DJ. Effect of body mass index on reoperation and complications.
(7) Knee Surg Relat Res, Vol. 30, No. 4, Dec. 2018. 2.. 3.. 4.. 5.. 6.. 7.. 8.. 9.. 10.. 11.. 12.. 13.. after total knee arthroplasty. J Bone Joint Surg Am. 2016;98: 2052-60. Kerkhoffs GM, Servien E, Dunn W, Dahm D, Bramer JA, Haverkamp D. The influence of obesity on the complication rate and outcome of total knee arthroplasty: a meta-analysis and systematic literature review. J Bone Joint Surg Am. 2012; 94:1839-44. Namba RS, Paxton L, Fithian DC, Stone ML. Obesity and perioperative morbidity in total hip and total knee arthro plasty patients. J Arthroplasty. 2005;20(7 Suppl 3):46-50. Foran JR, Mont MA, Etienne G, Jones LC, Hungerford DS. The outcome of total knee arthroplasty in obese patients. J Bone Joint Surg Am. 2004;86:1609-15. Amin AK, Patton JT, Cook RE, Brenkel IJ. Does obesity in fluence the clinical outcome at five years following total knee replacement for osteoarthritis? J Bone Joint Surg Br. 2006; 88:335-40. Nevitt MC. Obesity outcomes in disease management: clini cal outcomes for osteoarthritis. Obes Res. 2002;10 Suppl 1: 33S-37S. Ledford CK, Millikan PD, Nickel BT, Green CL, Attarian DE, Wellman SS, Bolognesi MP, Queen RM. Percent body fat is more predictive of function after total joint arthroplasty than body mass index. J Bone Joint Surg Am. 2016;98:84957. Tomiyama AJ, Hunger JM, Nguyen-Cuu J, Wells C. Misclas sification of cardiometabolic health when using body mass index categories in NHANES 2005-2012. Int J Obes (Lond). 2016;40:883-6. Seabolt LA, Welch EB, Silver HJ. Imaging methods for ana lyzing body composition in human obesity and cardiometa bolic disease. Ann N Y Acad Sci. 2015;1353:41-59. Jiganti JJ, Goldstein WM, Williams CS. A comparison of the perioperative morbidity in total joint arthroplasty in the obese and nonobese patient. Clin Orthop Relat Res. 1993; (289):175-9. Amin AK, Clayton RA, Patton JT, Gaston M, Cook RE, Brenkel IJ. Total knee replacement in morbidly obese pa tients: results of a prospective, matched study. J Bone Joint Surg Br. 2006;88:1321-6. Bordini B, Stea S, Cremonini S, Viceconti M, De Palma R, Toni A. Relationship between obesity and early failure of to tal knee prostheses. BMC Musculoskelet Disord. 2009;10:29. Kamath AF, Israelite C, Horneff J, Lotke PA. Editorial: What is varus or valgus knee alignment?: a call for a uniform ra. 14.. 15.. 16. 17.. 18. 19.. 20.. 21. 22.. 23.. 24.. 25.. 26.. 325. diographic classification. Clin Orthop Relat Res. 2010;468: 1702-4. Lozano LM, Nunez M, Segur JM, Macule F, Sastre S, Nunez E, Suso S. Relationship between knee anthropometry and sur gical time in total knee arthroplasty in severely and morbidly obese patients: a new prognostic index of surgical difficulty. Obes Surg. 2008;18:1149-53. Wang Y, Wluka AE, English DR, Teichtahl AJ, Giles GG, O’Sullivan R, Cicuttini FM. Body composition and knee car tilage properties in healthy, community-based adults. Ann Rheum Dis. 2007;66:1244-8. Bogin B, Varela-Silva I. The body mass index: the good, the bad, and the horrid. Bull Anthropol Swiss Soc. 2012;18:5-11. World Health Organization. Obesity: preventing and man aging the global epidemic. Geneva: World Health Organiza tion; 2000. Gillespie GN, Porteous AJ. Obesity and knee arthroplasty. Knee. 2007;14:81-6. Han CD, Han CW, Yang IH. The influence of obesity on clinical outcomes after total knee arthroplasty: a five-year minimum follow-up. J Korean Knee Soc. 2008;20:16-21. Tomiyama AJ, Hunger JM, Nguyen-Cuu J, Wells C. Misclas sification of cardiometabolic health when using body mass index categories in NHANES 2005-2012. Int J Obes (Lond). 2016;40:883-6. Booth RE Jr. Total knee arthroplasty in the obese patient: tips and quips. J Arthroplasty. 2002;17(4 Suppl 1):69-70. Messier SP, Gutekunst DJ, Davis C, DeVita P. Weight loss re duces knee-joint loads in overweight and obese older adults with knee osteoarthritis. Arthritis Rheum. 2005;52:2026-32. Watts CD, Houdek MT, Wagner ER, Taunton MJ. Subcuta neous fat thickness is associated with early reoperation and infection after total knee arthroplasty in morbidly obese pa tients. J Arthroplasty. 2016;31:1788-91. Spicer DD, Pomeroy DL, Badenhausen WE, Schaper LA Jr, Curry JI, Suthers KE, Smith MW. Body mass index as a predictor of outcome in total knee replacement. Int Orthop. 2001;25:246-9. Ethgen O, Bruyere O, Richy F, Dardennes C, Reginster JY. Health-related quality of life in total hip and total knee ar throplasty: a qualitative and systematic review of the litera ture. J Bone Joint Surg Am. 2004;86:963-74. Seabolt LA, Welch EB, Silver HJ. Imaging methods for ana lyzing body composition in human obesity and cardiometa bolic disease. Ann N Y Acad Sci. 2015;1353:41-59..
(8)
수치


관련 문서
Purpose: To investigate the incidence of venous thromboembolism (VTE) after total knee arthroplasty (TKA) with chemoprophylaxis using acetylsalicylic acid (AA) or rivaroxaban in
TKA: total knee arthroplasty, TxA: tranexamic acid, NKSS: new Knee Society Score... Measurement of suprapatellar girth at 6 hours from the surgery might have shown a
Purpose: The aim of this study was to determine the role of routine manipulation on increasing angle of great flexion (AGF) after total knee arthroplasty (TKA) in early
To prevent complications from delayed rehabilitation and to pro- mote early recovery of joint function after a total knee arthroplasty (TKA), various measures have been suggested
We evaluated the patients using the knee rating system of the American Knee Society (knee score and functional score), knee arthroplasty rating system of the
Compartment syndrome after total knee arthroplasty (TKA) is a rare complication. Because of its rarity, it may be overlooked and misdiagnosed as peroneal nerve palsy or deep
The number of revision total knee arthroplasty (TKA) is increasing day by day due to the rise in the number of primary TKA. 3) Ad- equate exposure during revision TKA is one of
Purpose: To compare the clinical outcome and complica- tions following total knee arthroplasty (TKA) in diabetic and non-diabetic patients, and to identify diabetes-related risk
