Environmental Science
Vol. 36, No. 3, pp. 233-242, September, 2020 https://doi.org/10.7747/JFES.2020.36.3.233
Determinants of Lake Zone Forest Resources’
Status: Analyzing the Impact of Implemented Policies in Tanzania
Isege Z. Mihayo1,2,* and Daiyan Peng1
1School of Economics, Huazhong University of Science and Technology, Wuhan 430074, China
2School of Environmental Science and Technology, College of Earth Sciences, University of Dodoma, Dodoma 11090, Tanzania
Abstract
The Lake (Victoria) zone of Tanzania, which has the least forest resources in the country, is a potential economic growth zone in the country. Therefore, this study analyses the impact of implemented forest policies on the status of forest resources in the area, given the unique features. The study identifies the status of forested lands in the area, and then fits binary logistic regression to identify the impact of policies related elements (i.e. type of forest, type of management) on the status; forest area and location (region) are used as control variables. Results show that 63% of the forested land in the area is destructed; main activities being agriculture, residential, firewood, and charcoal burning activities. Logistic results showed natural forests, forests located in Geita region, forests managed by municipal councils are more likely to be destructed; while plantation forests, forests located in Kagera region, privately managed forests are less likely to be destructed. Thus, the study concludes that policies and measures are not enough for the preservation of forest resources in the area; some of the economic activities in the area are occurring at the expenses of the forests;
hence recommend more sustainable development plans and incorporating different crossing cutting sectors in the policies.
Key Words: forest resources, determinants, policies
Received: November 30, 2019. Revised: April 19, 2020. Accepted: April 21, 2020.
Corresponding author: Isege Z. Mihayo
School of Economics, Huazhong University of Science and Technology, Wuhan 430074, China Tel: 255752447886, Fax:8613007106453, E-mail: [email protected]
Introduction
It can be seen all around the globe that forests are uti- lized, protected, and conserved in several ways. As re- sources, forests provide us with a broad range of relevant renewable raw materials such as food, fuelwood, and other bio products (Langat et al. 2016; Lee 2019), without for- geting the essential ecological and environmental services such as soil and water protection, recreation, conservation of biodiversity, carbon storage and climate change miti- gation (Dhyani and Dhyani 2016; Duguma et al. 2019).
The integrity of forest ecosystems has been wholly/partially
altered and damaged by various human activities such as excessive timber exploitation, settlement, infrastructure, ag- riculture, and other disturbances (Butler and Laurance 2008; Addai and Baidoo 2013; Barnes et al. 2017). Such activities, if are left (unchecked) to continue, will jeopardize the ability of the future generation to enjoy the benefits of the resources. All over the globe, the rapid disappearance of natural forests has been witnessed, and the situation is even worse in the tropics (Chukwu and Osho 2018; Maryudi et al. 2018). The worse situation in the tropics might be be- cause of the weather conditions that support the bio- diversity of trees species, which in turn boost the cutting
Table 1. Trends of forested lands from 1990 to 2015 in Tanzania
Year Forest cover (1,000 ha)1
Change rate in five years (1,000 ha)
Change rate in five years (%)
1990 55,920 - -
2000 51,920 -4,000 -7.1
2005 49,920 -2,000 -3.8
2010 47,920 -2,000 -4
2015 46,060 1,860 -3.9
1Trends are in the total forest area which is forests and woodlands, Source (FAO 2015).
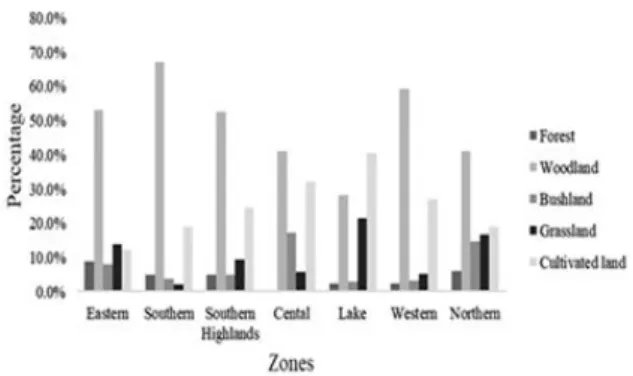
Fig. 1. Distributions of land use by percentage with zones in Tanzania showing Lake Zone with the lowest forested area. Source: NAFORMA (2015).
down of the trees because of their uses.
Tanzania is a tropical country with significant forest resources. About 50% of Tanzania’s total land area, is cov- ered by forests and woodlands that provide unique natural ecosystems, biological diversity, and water catchments (Food and Agriculture Organization of the United Nations 2015). Forest services in the country are so crucial to hu- mankind and other species, and cannot be compromised.
They have supported the livelihoods of many poor house- holds by providing over 90% of the country’s energy supply (Hoffmann et al. 2015), construction materials, and many indigenous medicines (Milledge et al. 2007). The forest sector is a significant contributor to the national economy through its contribution to national GDP and total export earnings (MRNT 2008). It also provides formal and in- formal employment to a significant number of people (Kideghesho 2015). Regardless of all benefits this sector provides, the forestry sector in Tanzania continue to face many challenges with regard to sustainable forest management.
From 1990, Tanzania has continued to lose significant areas of forest cover (Table 1). Between 1990 and 2015, the country has lost about 394,400 ha which is equal to the rate of 0.8 % per year (Food and Agriculture Organization of the United Nations 2015), the loss was estimated to be 19.4% of the total forest cover (Kideghesho 2015), which is a significantly high. This loss of forest cover is a result of heavy pressure from agricultural expansion, livestock graz- ing, wildfires, over-exploitation and unsustainable uti- lization of wood resources and other human activities main- ly in the general lands (Geist and Lambin 2002; Burgess et al. 2010). In addition to that, there have been conflicts be- tween governments (authorities) and forest-dependent
communities in the forested areas, thus, adding more pres- sure to the resources (Meijaard et al. 2013).
All the mentioned challenges together with recom- mendations/agreements from different organizations as the Rio-Conference in 1992, International Monetary Fund (IMF) and the World Bank (WB) (Mgaya 2016), made Tanzania to formulate and implement forest policies that aimed at jointly pursuing both economic and ecological objectives.
In 1998, the country introduced the National Forest Policy, which was reformed from former policy of 1953 (Blomley and Iddi 2009). After the introduction of the new policy, the government then introduced the Forest Act of 2002.
Immediately after the commencement of the implementations of the policy and the act, the government was able to change the access to forest resources; using different initiatives like introduction of participatory forest management (PFM) which changed the extent to which surrounding commun- ities are permitted to collect non-timber forest products (NTFPs) from village and government reserve forests (Robinson and Kajembe 2009). Hamza and Kimwer (2007) also indicated that implementation of the Forest Policy of 1998 and Forest Act of 2002 is responsible for the observed significant reduction of illegal harvesting of forest products, encroachment, unregulated activities, and fire incidences. It has now been around two decades since the commencement of the implementations, which calls for the follow up on the effectiveness of the policies; given the fact that the country now is trying to follow the footsteps of the transition to a green economy and takes forest resources as potential re- sources (URT 2012; Milder et al. 2013; URD 2013).
Thus, it is of importance to know how far the sustainable economic growth initiative is handling the challenges in the areas given the available national resources policies, regu- lations and bylaws as tools.
The Lake zone of Tanzania is a significant economic zone with a noticeable population and economic growth (URT 2018). It has been indicated that this kind of growth gives pressure to nature (Carr 2004, 2005; Omilola 2014).
Report by NAFORMA (2015) shows that the Lake zone continues to have the lowest forest areas, the lowest wood- land and bushland areas; on the other hand, have the high- est cultivation area as shown in Fig. 1. With such a sit- uation, it was of interest to know the current state of the for- ests in the area, and what are the determinants of that state, given the policies implemented in the country. Many re- lated researches have been done in potential areas, with sig- nificant forests in the country (Blomley and Iddi 2009;
Robinson and Kajembe 2009; Burgess et al. 2010). It is clear that Lake Zone does not have extensive potential for- ests, but it is important to know the state in which they are;
given the economic developments and town planning activ- ities that are taking place. This study intends to analyze the impact of the established polices on forest resources and identify the determinants of the current state of the re- sources in the Lake zone of Tanzania.
Materials and Methods
Theoretical perspective to explain the transitions of forests and land use
All around the globe, forests transit in different di- mensions and perspectives. Forest transitions have been well explained by forest transition theory, which gives out an explanation on how the modification from shrinking to ex- panding of forest cover occurs (Mather and Needle 1998).
There are many studies explaining different factors that play essential roles as determinants of forest transitions across the globe (Lambin and Meyfroidt 2010; Yu Li et al.
2013; Nguyen et al. 2015). According to Rudel (2005), there are two major arguments describing forest transitions.
One argument establishes that a change in forest by defor- estation increases the value of woods and wood products in terms of price, which result into more harvesting of the re- maining primary forests and also encourages tree planta-
tions especially those with wood and wood products proper- ties (Fairhead and Leach, 1995; Walters 1997).
The other explains the effect of economic growth, espe- cially from industrialization. This kind of growth creates many non-agriculture job opportunities that attract laborers to move from farm to non-farm economic activities, leading to the negligence of farmland and its re-conversion to for- ests related jobs (Bentley 1989), and consequently enhanc- ing plantation of trees. However, wood scarcity and eco- nomic development cannot explain all forest transition phe- nomena (Yu Li et al. 2013). The economy-wide influences such as government policy, technological change and demo- graphic factors have not been considered (Barbier et al.
2010). There is a variety of different environmental, social, and political factors that can also be responsible for forest transitions (Mather 2007; Perz 2007).
The role of Governments in facilitating forest transitions through the establishment of different mechanisms (such as policies) cannot be ignored. Governments are trying to manage, restore and conserve forest cover through these mentioned mechanisms, which are done by different re- sponsible agencies in the countries (Grainger 1995b;
Nagendra 2007). Governments have also been trying to in- troduce Payment for Environment Services (PES) (Yu Li et al. 2013). PES has been practiced globally for the past few years (Ferraro and Kiss, 2002; Ferraro and Pattanayak, 2006). These programs provide direct incentives (e.g., land purchases, leases, and easements) or indirect incentives (i.e., alternative economic and social benefits) to individuals or communities to restore natural resources and stopping the degradations of natural systems associated with them (Ferraro and Kiss 2002; Fajar and Kim 2019).
Most of economic-related studies have not focused on forest transitions in isolation, but have also focused on ana- lyzing the factors causing agricultural land conversion and deforestation, especially in developing countries (Barbier and Burgess 2001). These studies suggest the environ- mental Kuznets curve (EKC) hypothesis (Choumert et al.
2013; Indarto and Mutaqin 2016) and competing land-use models (Canziani and Benitez 2012; Duguma et al. 2019) as distinct analytical frameworks to study the related factors and relationships.
Some studies have emphasized that the long-run mod- ifications in forest cover in a place should not be far from
the overall pattern of land-use changes for that area (Kumar et al. 2013; Yan Li et al. 2017). A long-term trend in a country’s forest cover is best viewed in terms of changes in its national land-use morphology (Grainger 1995a, 1995b).
Meyfroidt et al. (2010) suggest that the U-shaped forest cover curve is, in fact, the aggregate of two separate land-use change curves, the decline in forest area, known as the national land-use transition, and the restoration of a for- est area after the transition, which is known as the forest re- plenishment period.
If the observed forest cover is declining, it is because the land in the forest is being converted to other land uses (Lima et al. 2012; Aryono et al. 2018). On the contrary, when afforestation, reforestation or natural regrowth oc- curs, it is because land under an alternative use is less pre- ferred than forested land. The use of that land is de- termined by its value compare to the values of other com- peting uses (Barbier et al. 2010); for example, the land can be used as a forested land if the surrounding community value related uses as timber production, recreation, nature reserves more than different land uses like agriculture, ur- ban development, residential housing etc. Therefore, some studies suggest that, the forest transition studies be broad- ened to land use allocation. Because under competing uses, it is the value of land which is the core determinant of in- crease or decrease of forest cover.
Methodology
Description of the study area
This study was done on forested lands found in four ad- ministrative regions in the Lake (Victoria) zone of Tanzania.
The regions are Mwanza and Geita, which both border the southern shore of Lake Victoria; Kagera that borders the western shore and Mara, which borders the eastern shore.
Kagera has the largest forested area (2,627,312 ha followed by Mara, and Geita while Mwanza has the smallest area (NAFROMA 2015)). The regions’ climate is tropical hu- mid with average temperatures ranging from 15°C, to 28°C (Awange and Ong’ang’a, 2006). The mean annual rainfall varies from a minimum of about 886 mm to 2600 mm. The mean evaporative rate range from 1100 to 2040 mm; it de- creases with increasing altitude, but in some months ex- ceeds rainfall (Nyeko-Ogiramoi et al. 2013). Mwanza is the most developed region in the lake zone and its capital
Mwanza city is the regions’ economic hub. The economy of the area is highly dominated by agriculture (farming, live- stock and fishery) which accounts for 62.8 percent; the oth- er population is preoccupied with elementary occupations, trade and small businesses, and works of arts (URT 2013).
Data and methods
The forest policy of Tanzania (1998) and the forest act (2002) emphasize the sustainability of forests and forest products by maintaining sufficient forest area and effective forest management (URT 1998; URT 2002). As a result, policies promote defined owner of the forest and therefore allocate forests to different management authorities. It was assumed that with proper management, it would be easy to protect and conserve. Therefore, the country established the principal central government forest management agen- cy by the name of Tanzania Forest Services Agency (TFS).
The agency collaborates with other agencies such as Tanzania National Parks (TANAPA) in managing many forests all over the country. The Agency is well established with a significant number of staff and resources to manage the forests (TFS 2014). Moreover, there are other estab- lished management authorities such as municipal and vil- lage councils (governments). However, Kideghesho (2015) and URT reports (2013) mention that about 50% of for- ested land that falls under village management authorities and other management regimes than TFS are more suscep- tible to severe deforestation and degradation, due to unclear forest management roles. It implies forests under central government management and other related managements with clear roles are not expected to be destroyed. Policies have also emphasized sustainable management of forest plantations by allocating plantation forests into one or sev- eral executive agencies. Therefore, the study uses forest management and type of forests as policy elements.
In addition to the policy elements, administrative re- gions/provinces in which the forests are located have also been incorporated as determinants. Although the regions in the Lake zone interact economically and in other develop- ment activities, they are at different levels of economic and urban-development with different prevailing conditions.
Specific characteristics of the regions may influence the for- ests in the area. Thus, this study uses; type of management (private, village, municipal, TFS), type of forest (whether
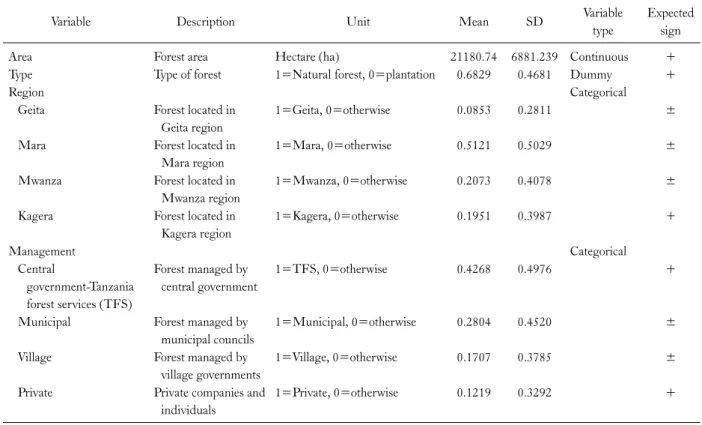
Table 2. Summary statistic of independent variables used
Variable Description Unit Mean SD Variable
type
Expected sign
Area Forest area Hectare (ha) 21180.74 6881.239 Continuous +
Type Type of forest 1=Natural forest, 0=plantation 0.6829 0.4681 Dummy +
Region Categorical
Geita Forest located in Geita region
1=Geita, 0=otherwise 0.0853 0.2811 ±
Mara Forest located in
Mara region
1=Mara, 0=otherwise 0.5121 0.5029 ±
Mwanza Forest located in Mwanza region
1=Mwanza, 0=otherwise 0.2073 0.4078 ±
Kagera Forest located in Kagera region
1=Kagera, 0=otherwise 0.1951 0.3987 +
Management Categorical
Central
government-Tanzania forest services (TFS)
Forest managed by central government
1=TFS, 0=otherwise 0.4268 0.4976 +
Municipal Forest managed by municipal councils
1=Municipal, 0=otherwise 0.2804 0.4520 ±
Village Forest managed by village governments
1=Village, 0=otherwise 0.1707 0.3785 ±
Private Private companies and individuals
1=Private, 0=otherwise 0.1219 0.3292 +
plantation or natural forest), forest area and the region in which the forests are located as the determinants of the for- est resources’ status in the area.
The main analysis method used in identifying the deter- minants of the destruction is regression analysis. The de- pendent variable for determinants of destruction was in di- chotomous (dummy) form; that is the status of the forest destruction; (destruction and no destruction). The forest destruction has been ranked based on the explanation from the forest experts in the respective forest areas; a forest is considered destructed when 20 percent or more of it has been destructed otherwise not destructed. In this case, a bi- nary logistic model is the most appropriate econometric tool for analysis (Greene 2003). The binary logit model based on the logistic distribution is specified as the likelihood of the forest to be destructed is predicted by odds (Y=1); that is, the ratio of the probability that Y=1 to the probability that Y≠1:
(1)
The logit (Y) is given by natural log of Odds
(2) ⋯⋯ (3)
Where Y=dependent variable (destructed) with 1=yes and 0=otherwise; =intercept, =coefficients of the in- dependent variables, X=is the independent variable, P (p)=probability of forest being destructed; 1-P=proba- bility that a forest is not destructed; and ln=natural log.
The independent variables of this model are region, type of forest, forest area and management.\
Results
Descriptive results
Based on available documents, 82 main forests were studied. This part presents variation of the variables around
Table 4. Logit estimation of determinants of the distraction
Explanatory variable Coefficient Odds ratios Marginal effect
Area 7.97e-06 1.000008 1.74e-06
Type 2.253528 9.521271 0.5003**
Region
Geita 2.4772 11.9085 0.5399*
Mara 1.0165 2.7635 0.2281
Mwanza 0.8782 2.4065 0.1797
Kagera -3.6300 0.0265 -0.7141**
Management
TFS 0.8625 2.369 0.1870
Municipal 1.1046 3.0181 0.2235*
Village -0.4898 0.6127 -0.1148
Private -2.2066 0.110 -0.4989**
Constant 3.8248*** 45.8271
Number of observations 82
LR chi2 of PRA 25.41***
Pseudo R2 0.23
Explanatory variables region and management have been referred as a category, illegal as dummy and area as continuous.
***p<0.001, ** p<0.01, *p<0.05.
Table 3. Distribution of forests and their destructions Disturbance Frequency Percentage Little or no destructions 30 36.59
Destruction 52 63.41
Total 82 100
their averages/means, as well as the descriptions, dis- tribution pattern of the investigated variables. Results in Table 2 show that standard deviations of type of forest, re- gions (with exception of Mara region), and type of manage- ment are higher than their means. This usually occurs when there is a wide range of variation amongst the data sets, and this is expected, as there is a 0 value in the data set of the variables, as the variables are dummy. Forest area’s standard deviation is smaller than mean, which implies that more of the data is clustered about the mean.
The data shows that a total of 52 forests have been des- tructed, which is about 63% as indicated in Table 3. The re- maining forested area has little destruction or no destruction. Most of the disturbances and degradations are from agriculture and residential areas mainly villages and streets. The rest of the disturbances come from cutting trees for timber, charcoal production, firewood and mining
activities.
Determinants of forests destructions
The binary Logit regression model was fitted to identify the causes of the current state of forested land. The destruc- tion and no destruction were used as dummy dependent variables. Coefficients in the model only give out the direct impact (whether positive or negative) of independent varia- bles, on the dependent variables; they give neither the real magnitude of change nor probability levels (Eshete 2007).
However, the marginal effects give out the expected change in probability of a particular choice being made in respect to a unit change of an independent variable. Therefore, co- efficients, odds ratios and magnitude are presented.
The results presented in Table 4 revealed that the size of the forested land area has no significant effect on the de- struction of the forests, that is to say, whether the forests are big or small, cutting of trees and other destructions are still the same. The type of forest, whether natural forest or a plantation, has a significant positive effect on the destruc- tion of the forests at 0.01 level of significance; according to its marginal effect, natural forests are 50% more likely to be destructed than plantation forests. The policies require proper management of the plantation forests, consequently
enhance protection, and this has been shown by the results.
This is mainly because many of plantation forests are as a result of the remedy activities (biodiversity conservation) of the planted forests, there are also specific reasons like tim- ber, recreation etc. (Onyekwelu and Olabiwonnu 2016), even though there is a debate that many forest plantations are mainly because of economic purposes. Therefore based on these, plantation forests are expected to have proper management and well taken care of. These results are also supported by the survey done by NAFROMA in 2014 which indicate decrease of natural forests stock average by 32% in the country from 2009 to 2014 (NAFORMA 2015) while forest plantations have increased.
In the case of the administrative regions, only Geita and Kagera have significant effects on the destruction of the forests. Geita has a positive significant effect at 0.05 level of significance, which means the region has a higher chance of having destructed forests by about 53%. This might be be- cause the region has been recently established (2012) taking some parts of Mwanza and Kagera regions, so responsible authorities are still building up and making plans for the re- gion, and the bad thing is, the development planning might be occurring at the expense of natural resources (forests).
In addition to that, there are also many forest destruction activities like mining (the region is the potential mining area), agriculture etc. As Javed and Khan (2012); Peterson and Heemskerk (2001) indicated in their studies, major losses of forest cover is mainly due to the charcoal pro- duction, mining activities, small scale mining and agri- culture, this is because people see virgin forest lands as more fertile and productive than old agricultural lands (Kideghesho 2015). Kagera has a negative significant effect at 0.01 level of significance, which indicate that the region is less likely to have destructed forests. Forests in the area are dense and wet, this condition makes it difficult for people invade the forests.
The type of management has also an impact on the state of the forests. Most of the forests, especially extensive for- ests and forests transcending more than one region or dis- trict borders are managed by the central government agen- cy, but it gives out insignificant results. Results reveal that private management has a negative significant impact on the destruction at 0.01 level of significance. Private owned forests are less likely to be destructed. Privately managed
forests comply with common goods and public goods concepts. Forests are one of the widely known public good (Kaul et al. 1999). However, when managed as private property it gives out the control and conservation as private one.
In order to test the adequacy of the fitted model, some diagnostics tests were conducted after fitting the logistic model. The tests largely support the stability of the co- efficients of regression equations. The Hosmer-Lemeshow goodness-of-fit test is found to be insignificant (x2=79.44, d.f=8, p-value=0.11), and link-test for specification error was insignificant (p-value=0.547) indicating no specifica- tion error.
Discussion
This study uses the least forested zone in Tanzania to an- alyze the impacts of implemented forests policies on the for- ests resources in the country. Policy elements and other con- trol variables have been used to determine the status. The results presented above, to some extent, indicate that poli- cies have managed to enhance forests conservation in the area. However, available policies have not completely suc- ceeded to preserve the least forest resources Lake Zone is having. In the country’s efforts to promote sustainable eco- nomic growth such as green economy, the results suggest that efforts to develop and conserve forests resources in the zone are inadequate. It is apparent that policies cannot be the only strategy in achieving sustainable development. For a country to have a sustainable economy, formation, and im- plementation of policies can be the easiest strategy to com- municate; but, the fact is that efforts have to go further, and other strategies should not be ignored. With the current mentioned rate of deforestation (0.4 million ha) in Tanzania, it indicates that available measures are either inadequate or poorly implemented or both; and if this is left to continue, the country is expected to lose most of its forests in the com- ing 50 to 80 years (Sangeda et al. 2017). Therefore, it is im- portant to reinforce available measures and adopt new ones to complement the existing measures.
In addition, the concept of ownership has been found to improve the conservation status of the forests in the re- spective areas. The results show that, private owned forests have little or no destructions, therefore the sense of owner-
ship at different levels could increase the appreciation and protection the resources. Respecting and appreciating the value of forests can enhance conserving and protection of the resources (Barbier et al. 2010). According to Helfrich and Bollier (2012), collectively taking care of a shared pool of goods at the same time respecting its value beyond use have been proven to safeguard resources for long periods.
Hence, responsible authorities need to promote and in- troduce the concept of ownership to the communities and individuals surrounding the resources.
This study recommends promotion of alternative, re- newable and affordable sources of energy to the commun- ities surrounding the forests by the responsible authorities in the area. NAFROMA report (2015) mention firewood as the main source of energy to the households; additionally, unsustainable charcoal production is the most important driver of forest degradation in large parts of Africa (Kissinger et al. 2012). Cutting trees for firewood and char- coal production, which contribute to forest depletion, is a widespread practice in the lake zone. The country has made an effort to introduce and promote sustainable energy use, including the use of improved cooking stoves (ICS) for the conservation of forests (Massawe and Bengesi 2017;
Kulindwa et al. 2018; Bishoge et al. 2019). These programs and other conservation related projects need to be vigo- rously promoted in the lake zone and other resource-poor areas.
The results suggest that the development and planning of the towns in the area do not or do very little consider na- ture conservation, which includes forest cover. The role played by natural resources in empowering the economy need not be overlooked. Therefore, with unsustainable ur- banization and unsustainably managed consumption of the natural resources, the area may eventually experience an economic downfall and jeopardize the lives of people whose livelihood depends on the resources. The study hence sug- gests to the responsible authorities in the area, when plan- ning Development of urban-areas, they should consider and not compromise natural resources. For good results, policies need to be crosscutting, integrating essential sectors such as conservation, environment, infrastructure, econo- my, energy, education, community development and other natural resources and economy related sectors.
Acknowledgements
This article is part of the dissertation of the first author.
The author presents the deepest appreciation to Huazhong University of Science and Technology, and Chinese Government for motivational and support towards the final outcome of this work.
This study complied with the current laws of Tanzania in which the research was performed.
References
Addai G, Baidoo PK. 2013. The effects of forest destruction on the abundance, species richness and diversity of butterflies in the Bosomkese Forest Reserve, Brong Ahafo Baidoo Ghana. J Appl Biosci 64: 4763-4772.
Aryono WB, Suhendang E, Jaya INS, Purnomo H. 2018.
Typology of Tropical Forest Transition Model in Several Watershed, Sumatera Island. J Trop For Manag 24: 126-135.
Barbier EB, Burgess JC, Grainger A. 2010. The forest transition:
towards a more comprehensive theoretical framework. Land Use Policy 27: 98-107.
Barbier EB, Burgess JC. 2001. The Economics of Tropical Deforestation.
J Econ Surv 15: 413-433.
Barnes VR, Swaine MD, Pinard MA, Kyereh B. 2017. Fuel Management and Experimental Wildfire Effects on Forest Structure, Tree Mortality and Soil Chemistry in Tropical Dry Forests in Ghana. J For Environ Sci 33: 172-186.
Bentley JW. 1989. Bread Forests and New Fields: The Ecology of Reforestation and Forest Clearing among Small-Woodland Owners in Portugal. J For Hist 33: 188-195.
Bishoge Ok, Zhang L, Mushi WG. 2019. The Potential Renewable Energy for Sustainable Development in Tanzania: A Review. Clean Technol 1: 70-88.
Blomley T, Iddi S. 2009. Participatory forest management in Tanzania: 1993-2009: Lessons learned and experiences to date.
Burgess ND, Bahane B, Clairs T, Danielsen F, Dalsgaard S, Funder M, Hagelberg N, Harrison P, Haule C, Kabalimu K, Kilahama F, Kilawe E, Lewis SL, Lovett JC, Lyatuu G, Marshall AR, Meshack C, Miles L, Milledge SAH, Munishi PKT, Nashanda E, Shirima D, Swetnam RD, Willcock S, Williams A, Zahabu E. 2010. Getting ready for REDD+ in Tanzania: a case study of progress and challenges. Oryx 44:
339-351.
Butler RA, Laurance WF. 2008. New strategies for conserving tropical forests. Trends Ecol Evol 23: 469-472.
Canziani PO, Carbajal Benitez G. 2012. Climate impacts of defor- estation/land-use changes in Central South America in the PRECIS regional climate model: mean precipitation and tem-
perature response to present and future deforestation scenarios.
ScientificWorldJournal 2012: 972672.
Carr DL. 2004. Proximate Population Factors and Deforestation in Tropical Agricultural Frontiers. Popul Environ 25: 585-612.
Carr DL. 2005. Forest Clearing Among Farm Households in the Maya Biosphere Reserve. Prof Geogr 57: 157-168.
Choumert J, Motel PC, Dakpo HK. 2013. Is the Environmental Kuznets Curve for deforestation a threatened theory? A meta-analysis of the literature. Ecol Econ 90: 19-28.
Chukwu O, Osho JSA. 2018. Basal Area-Stump Diameter Models for Tectona grandis Linn. F. Stands in Omo Forest Reserve, Nigeria. J For Environ Sci 34: 119-125.
Dhyani S, Dhyani D. 2016. Significance of provisioning ecosystem services from moist temperate forest ecosystems: lessons from upper Kedarnath valley, Garhwal, India. Energy Ecol Environ 1: 109-121.
Duguma LA, Atela J, Minang PA, Ayana AN, Gizachew B, Nzyoka JM, Bernard F. 2019. Deforestation and Forest Degradation as an Environmental Behavior: Unpacking Realities Shaping Community Actions. Land 8: 1-17.
Eshete B. 2007. Livelihood Strategies of Smallholder Farmers and Income Poverty in draught prone areas: The case of Gena-Bosa woreda, SNNPRS. MSc Thesis. Haramaya University, Dire Dawa, Ethiopia.
Fairhead J, Leach M. 1995. False forest history, complicit social analysis: rethinking some West African environmental narratives. World Dev 23: 1023-1035.
Fajar NC, Kim JS. 2019. The Impact of Community-Based Forest Management on Local People around the Forest: Case Study in Forest Management Unit Bogor, Indonesia. J For Environ Sci 35: 102-114.
Ferraro PJ, Kiss A. 2002. Direct Payments to Conserve Biodiversity.
Science 298: 1718-1719.
Ferraro PJ, Pattanayak SK. 2006. Money for nothing? A call for empirical evaluation of biodiversity conservation investments.
PLoS Biol 4: e105.
Food and Agriculture Organization of the United Nations. 2015.
Global forest resources assessment 2015. Desk reference. Food and Agriculture Organization of the United Nations, Rome, pp 253.
Geist HJ, Lambin EF. 2002. Proximate Causes and Underlying Driving Forces of Tropical Deforestation: Tropical forests are disappearing as the result of many pressures, both local and re- gional, acting in various combinations in different geographical locations. Bioscience 52: 143-150.
Grainger A. 1995a. The forest transition: an alternative approach.
Area 27: 242-251.
Grainger A. 1995b. National land use morphology: patterns and possibilities. Geography 80: 235-245.
Greene WH. 2003. Econometric analysis. 5th ed. Prentice Hall, Upper Saddle River, NJ, pp 828.
Hamza K, Kimwer E. 2007. Tanzania’s forest policy and its prac-
tical achievements with respect to community based forest man- agement in MITMIOMBO. For Res: 24-33.
Helfrich S, Bollier D. 2012. Commons as a transformative force.
Commons: A new policy beyond market and state: 15-23.
Hoffmann H, Uckert G, Reif C, Müller K, Sieber S. 2015.
Traditional biomass energy consumption and the potential in- troduction of firewood efficient stoves: insights from western Tanzania. Reg Environ Change 15: 1191-1201.
Indarto J, Mutaqin DJ. 2016. An overview of theoretical and em- pirical studies on deforestation. J Int Dev Coop 22: 107-120.
Javed A, Khan I. 2012. Land Use/Land Cover Change Due To Mining Activities in Singrauli Industrial Belt, Madhya Pradesh Using Remote Sensing and GIS. J Environ Res Dev 6:
834-843.
Kaul I, Grunberg I, Stern MA. 1999. Global public goods: inter- national cooperation in the 21st century. Oxford University Press, New York, NY, pp 2-19.
Kideghesh, JR. 2015. Realities on deforestation in Tanzania—
Trends, drivers, implications and the way forward Precious Forests-Precious Earth: IntechOpen.
Kissinger G, Herold M, De Sy V. 2012. Drivers of deforestation and forest degradation: a synthesis report for REDD+ policymakers.
Lexeme Consulting, Vancouver, pp 48.
Kulindwa YJ, Lokina R, Ahlgren EO. 2018. Driving forces for households' adoption of improved cooking stoves in rural Tanzania. Energy Strategy Rev 20: 102-112.
Kumar S, Merwade V, Rao PS, Pijanowski BC. 2013. Characterizing long-term land use/cover change in the United States from 1850 to 2000 using a nonlinear bi-analytical model. Ambio 42:
285-297.
Lambin EF, Meyfroidt P. 2010. Land use transitions: Socio-eco- logical feedback versus socio-economic change. Land Use Policy 27: 108-118.
Langat DK, Maranga EK, Aboud AA, Cheboiwo JK. 2016. Role of Forest Resources to Local Livelihoods: The Case of East Mau Forest Ecosystem, Kenya. Int J For Res 2016: 1-10.
Lee BH. 2019. Estimating Economic Optimum Planted Area for Sustainable Schisandra chinensis Cultivation. J For Environ Sci 35: 173-180.
Li Y, Sulla-Menashe D, Motesharrei S, Song XP, Kalnay E, Ying Q, Li S, Ma Z. 2017. Inconsistent estimates of forest cover change in China between 2000 and 2013 from multiple datasets:
differences in parameters, spatial resolution, and definitions. Sci Rep 7: 8748.
Li Y, Viña A, Yang W, Chen X, Zhang J, Ouyang Z, Liang Z, Liu J. 2013. Effects of Conservation Policies on Forest Cover Change in Giant Panda Habitat Regions, China. Land use poli- cy 33: 42-53.
Lima A, Silva TSF, de Feitas RM, Aragão LEOC, Adami M, Formaggio, AR, Shimabukuro YE. 2012. Land use and land cover changes determine the spatial relationship between fire and deforestation in the Brazilian Amazon. Appl Geogr 34:
239-246.
Maryudi A, Nurrochmat DR, Giessen L. 2018. Research trend:
Forest policy and governance- Future analyses in multiple social science disciplines. For Policy Econ 91: 1-4.
Massawe FA, Bengesi KMK. 2017. Household social economic status and adoption of improved cook Stoves: the case of Kilimanjaro region Tanzania. J Transdiscipl Environ Stud 16:
2-13.
Mather AS, Needle CL. 1998. The Forest Transition: a Theoretical Basis. Area 30: 117-124.
Mather AS. 2007. Recent Asian forest transitions in relation to for- est transition theory. Int For Rev 9: 491-502.
Meijaard E, Abram NK, Wells JA, Pellier AS, Ancrenaz M, Gaveau DL, Runting RK, Mengersen K. 2013. People's per- ceptions about the importance of forests on Borneo. PLoS One 8: e73008.
Meyfroidt P, Rudel TK, Lambin EF. 2010. Forest transitions, trade, and the global displacement of land use. Proc Natl Acad Sci U S A 107: 20917-20922.
Mgaya E. 2016. Forest and Forestry in Tanzania: Changes and Continuities in Policies and Practices from Colonial Times to the Present. J Geogr Assoc Tanzania 36: 45-58.
Milder JC, Buck LE, Hart AK, Scherr SJ, Shames SA. 2013. A Framework for Agriculture Green Growth: Greenprint for the Southern Agricultural Growth Corridor of Tanzania (SAGCOT).
SAGCOT Centre, Dar es Salaam, pp 88.
Milledge SAH, Gelvas IK, Ahrends A. 2007. Forestry, Governance and National Development: Lessons Learned from a Logging Boom in Southern Tanzania. TRAFFIC, Dar es Salaam, pp 256.
MRNT. 2008. Tanzania Forest Sector Outlook Study: 2008-2018.
Forestry and Beekeeping Division, Dar es salaam, pp 142.
NAFORMA. 2015. National Forest Resources Monitoring and Assessment of Tanzania Mainland: Main Results 2009 to 2014.
Retrieved from http://www.fao.org/forestry/43612-09cf2f02c20 b55c1c00569e679197dcde.pdf
Nagendra H. 2007. Drivers of reforestation in human-dominated forests. Proc Natl Acad Sci U S A. 104: 15218-15223.
Nguyen TV, Mitlohner R, Bich NV, Do TV. 2015. Environmental Factors Affecting the Abundance and Presence of Tree Species in a Tropical Lowland Limestone and Non-limestone Forest in Ben En National Park, Vietnam. J For Environ Sci 31: 177-191.
Omilola B. 2014. Inclusive Green Growth in Africa: Rationale,
Challenges and Opportunities, UNDP Retrieved from South Africa: http://www.za.undp.org/content/dam/south_africa/docs/mdgs/
Inclusive%20Green%20Growth%20in%20Africa-Rationale%2 0Challenges%20and%20Opportunities1.pdf
Onyekwelu JC, Olabiwonnu AA. 2016. Can forest plantations har- bour biodiversity similar to natural forest ecosystems over time?
Int J Biodivers Sci Ecosyst Serv Manag 12: 108-115.
Perz SG. 2007. Grand Theory and Context-Specificity in the Study of Forest Dynamics: Forest Transition Theory and Other Directions. Prof Geogr 59: 105-114.
Peterson GD, Heemskerk M. 2001. Deforestation and forest re- generation following small-scale gold mining in the Amazon:
the case of Suriname. Environ Conserv 28: 117-126.
Robinson EJ, Kajembe GC. 2009. Changing access to forest re- sources in Tanzania.
Rudel TK. 2005. Tropical forests: regional paths of destruction and regeneration in the late twentieth century. Columbia University Press, New York, NY, p 256.
Sangeda A, Maleko D, Kajembe G. 2017. Understanding the Miombo Woodlands Deforestation: Drivercommodities-Gender Nexus in Three Districts, Tanzania. Int J Agric Environ Bio-res 2: 346-362.
TFS. 2014. Annual implementation report July 2014-June 2015.
Tanzania Forest Services. Retrieved from Dar es salaam: TFS_
ANUAL_REPORT_2013-14.pdf
United Republic of Tanzania. 2012. National Report for the United Nations Conference on Sustainable Development, Rio+20. Vice President’s Office, Dar es Salaam, pp 144.
URT. 1998. National Forest Policy (1998). United Republic of Tanzania
UTR. 2002. THE FOREST ACT (2002). United Republic of Tanzania
URT. 2013. National strategy for reduced emissions from defor- estation and forest degradation (REDD+). Division of Environment, Vice President's Office, Dar es Salaam, pp 67.
URT. 2018. Sub-Divisional Population Projection for Year 2016 and 2017 Based on 2012 Population and Housing Census.
United Republic of Tanzania. Retrieved from http://www.
nbs.go.tz/nbs/takwimu/census2012/Tanzania_Total_Population_
by_District-Regions-2016_2017r.pdf
Walters BB. 1997. Human ecological questions for tropical restora- tion: experiences from planting native upland trees and man- groves in the Philippines. For Ecol Manag 99: 275-290.