Vol. 30, No. 1, pp. 76-84, February, 2014 http://dx.doi.org/10.7747/JFS.2014.30.1.76
댐 건설 기간 수위변화가 하반림 일대 습지 식생에 미치는 영향 -한탄강댐을 사례로-
박현철1ㆍ이정환2ㆍ이관규1,*
1강원대학교 조경학과, 2강원대학교 환경연구소
Effects of Water Level Change on Wetland Vegetation in the Area of Riparian Forest for Dam Construction Period -Focused on the Hantan River Dam-
Hyun-Chul Park1, Jung-Hwan Lee2 and Gwan-Gyu Lee1,*
1Department of Landscape Architecture, Kangwon National University, Chuncheon 200-701, Republic of Korea
2Institute of Environmental Research at Kangwon National University, Chuncheon 200-701, Republic of Korea
Abstract
This study was performed to monitor the effects of water level change on changes of landscape, vegetation community, and species diversity of riparian forest. Hantan river dam, study area, has been constructed in the area of Chansoo-myeon, Pocheon-si and Yeoncheon-eup, Yeoncheon-gun, Gyeonggi-do, which is a dam for flood control only in flooding season.
Landscape changes were notable after the construction of coffer dam, and the changes were caused by water level increase in areas of riparian forests which consisted of mainly withered willow as a dominant species in the flooding season. It changed vegetation communities of riparian forest from Phragmites japonica and Salix koreensis to Phragmites japonica. Species diversity index was lowest in 2010 when the coffer dam was constructed and showed an increasing trend later. Thus, this study is well in agreement with a previous report that plants of the genus Salix wither by muddy water during flooding and also suggests, controlling water level of river and prediction of water level change's effects should be considered when any facilities are planned.
Key Words: flood regulating dam, riparian forest, species diversity index, cluster analysis
Received: February 7, 2014. Revised: February 11, 2014. Accepted: February 12, 2014.
Corresponding author: Gwan-Gyu Lee
Department of Landscape Architecture, Kangwon National University, Chuncheon 200-701, Republic of Korea Tel: 82-33-250-8346, Fax: 82-33-257-8340, E-mail: [email protected]
서 론
우리나라는 기후의 영향으로 8-9월에 집중호우로 인 해 홍수가 발생하여 효율적 수자원관리를 위해 댐을 건
설한다. 현재 운용중인 댐이나 건설중인 댐은 대부분 다 목적 댐(multipurpose dam)이며, 댐 건설은 수자원의 확 보, 홍수 조절 등의 긍정적인 목적이 있으나 생태적으로 는 간섭의 요인이 될 수 있다. 특히 댐 건설 후 형성되는
Table 1. Administrative Districts and coordinate of the survey plot Administrative Districts Geographic coordinates San 138-1, Sinheung-ri, Changsu-myeon,
Pocheon-si, Gyeonggi-do, Korea
38o 4'4.02"N 127o 8'21.70"E
Fig. 1. The location map of survey plot, riparian forest and Hantan- gang Dam.
담수호는 하천의 식물종 다양성, 식생 천이에 영향을 줄 수 있다(Barnes 1997; Jamieson and Braatne 2001). 댐은 담수호의 수변 구역 수위를 유지시키지만 하반림의 침 식의 요인이 되며 침식은 종다양성을 낮게 한다 (Friedman et al. 1998; Magilligan et al. 2003). 댐 상류에 서는 침식 등으로 인한 종다양성의 변화가 있고 댐 하류 에서는 유량 변화에 의한 퇴적으로 범람원, 사주 식생이 변화하기도 한다(Egger et al. 2012; Benjankar et al. 2011;
Yang et al. 2012).
경관, 지형, 생태적으로 보전가치가 높은 지역은 담수 호가 형성되지 않는 홍수조절댐(flood regulating dam)을 건설하기도 한다. 우리나라의 대표적인 경우가 한탄강 댐이다. 한탄강댐 건설은 임진강 유역의 홍수 조절을 위 해 계획되었다. 그런데 희귀하고 수려한 현무암 협곡과 생태적 보호가치가 높은 지역인 관계로 홍수조절용 댐 으로 계획을 변경하여 건설하고 있다. 한탄강댐을 홍수 조절용 댐으로 건설하게 되면 평상시에 수문을 개방하 여 자연하천과 같이 운영되므로, 한탄강 일대의 중요한
생태적 자원인 현무암 협곡 지형자원과 하반림이 보전 될 것으로 판단한 것이다. 특히 양안이 현무암 절애지역 인 한탄강에서 제한적으로 분포하는 하반림은 수생태계 와 육지생태계의 전이지역으로 생산성이 높고 종다양성 이 풍부하며 다양한 생물의 서식처가 된다(Naiman et al.
1993; Barling and Moore 1994; Holmes and Cowling 1997; Hooper et al. 2005).
그런데 한탄강 홍수조절용 댐을 건설하면서 한탄강 본류를 우회시키고 가물막이(coffer dam)를 설치하는 과 정을 거치면서, 가물막이로 인해 댐 건설 지역 부근에 위 치한 하반림이 일정기간 침수하게 되었다. 하반림 지역 의 수위변화는 홍수, 침식, 퇴적 등의 공간적 변형을 야 기한다(Hughes 1990; Stanford et al. 2005). 이러한 공간 적 변형은 하반림의 종 다양성 지수의 변화 및 식물의 발 아에 영향을 줄 수 있다(Wilson and Keddy 1985; Keddy and Constable 1986; Hill and Keddy 1992; Nicol and Ganf 2000; Riis and Hawes 2002).
본 연구는 댐 건설기간 중 하반림의 경관, 식생군집, 종 다양성의 변화를 모니터링 함으로써 하천의 수위변 화를 유발하는 시설물이 식생 생태계에 미치는 영향관 계를 파악하고 하천 생태자원을 보전하는 친환경적 하 천 개발 시 고려하여야 할 시사점을 도출하는 데 목적을 두고 진행되었다.
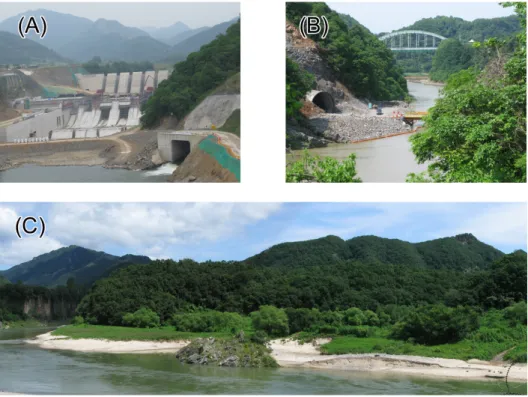
Fig. 2. The coffer dam (A), di- version tunnel (B) and riparian forest (C) of the Hantangang Dam.
Table 2. Survey period for monitoring at the Hantan river
Year Date
2008 2009 2010 2011 2012
August 24th August 20th August 20th August 25th September 21st
연구방법
연구대상지
본 연구의 대상지역은 한탄강 홍수조절댐 상류의 하 반림으로 경기도 포천시 창수면과 연천군 연천읍 일원 에 위치하고 있다(Table 1, Fig. 1). 한탄강댐은 임진강 유 역의 홍수피해 경감을 위해 높이 83.8 m, 길이 694 m, 총 저수용량 2.7억 m3규모로 건설되고 있다. 한탄강댐은 홍 수시에만 일시적으로 물을 저장하는 홍수 조절 전용댐 으로 건설되고 있으며, 2007년 착공하였고 2009년 가배 수로(diversion tunnels), 2010년 가물막이가 건설되었다 (Fig. 2). 하반림은 한탄강댐 건설지역으로부터 상류방 향으로 약 650 m 떨어진 지역에 입지하고 있으며 한탄강 활주 사면의 모래퇴적 지형에 형성되었다(Fig. 1). 주요 식물종은 버드나무, 참느릅나무, 달뿌리풀 등으로 주로 호습성 식물이 분포하고 있다.
식생조사
군락의 종 조성과 구조를 알아보기 위해 Zurich- Montpellier (Z-M) 학파의 식물사회학적 연구방법 (Braun-Blanquet 1964)에 준하여 식생조사를 실시하였 다. 연도별 모니터링을 위해 20x20 m 방형구를 설치하 였고 출현한 식물종 피도(abundance)는 수리적 분석을
위한 변환 통합 우점도(Westhoff and Van der Maarel 1973)를 사용하였다. 유수역에 인접한 지역의 버드나무 군락(Salix koreensis community)을 조사 방형구(Survey plot) 으로 선정하였으며, 조사기간은 2009년부터 2012 년까지이며 매년 8월, 9월에 조사하였다(Table 2). 연도 별 방형구의 식생형을 파악하기 위해 조사된 식생자료 를 이용하여 종합상재도표(The synthesis table)를 작성 하고 기여도(NCDi: Contribution Degree)를 통해 절대 기여도(rNCD: relative Net Contribution Degree)를 산출 하였다(Kim and Manyko 1994). 기여도 및 절대기여도 의 산출식은 다음 <식 1, 2>와 같다.
NCDi (절대기여도)=ΣCi / N x ni / N (식 1)
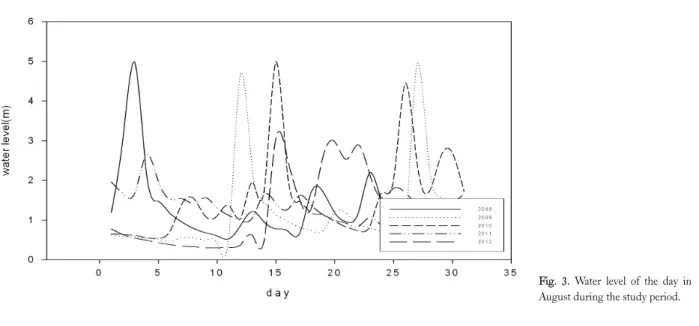
Fig. 3. Water level of the day in August during the study period.
rNCDi (상대기여도)=NCDi / NCDmax x 100 (식 2)
여기서 ΣCi는 i종의 피도의 합, ni는 i종이 출현한 조 사구수, N은 전체 조사구 수이다.
종다양성지수 분석
종풍부도(S) (Margalef 1958), 종균등도(E) (Pielou 1975), Shannon 종다양도(H) (Shannon and Weaver 1949), Simpson 종다양도(D) (Simpson 1949)를 사용하 여 종다양성 지수를 분석하였다. 분석에 사용된 종의 척 도는 식생조사표의 피도를 사용하였다. 조사기간별 하 반림 식생군집의 유사성 분석은 PC-ORD ver. 4.25 (McCune and Mefford 1999)를 이용하여 유사도 분석 (Bray and Curtis 1957)을 실시하고 결과는 군집분석 (cluster analysis)으로 표현하였다.
수위변동과 종다양성과의 상관성 분석
수위자료는 국가수자원관리종합정보시스템 (WAMIS) 의 관측 자료를 활용하였고, 한탄강 홍수조절댐 상류에 위치한 관인관측소(관측소코드: 1022640)의 2008년부 터 2012년까지의 수위자료를 이용하였다. 수위와 종 다 양성과 상관성은 SPSS ver. 21을 이용하여 Pearson 상관 계수에 의한 단순상관분석(simple correlation analysis)으 로 분석하였고, 분석에 사용한 변수는 관인관측소의 조 사연도별 8월수위 평균값과 연도별 분석된 종풍부도, 종 균등도, Shannon 종다양도, Simpson 종다양도이다.
연구결과
수위 변동
조사기간 동안의 월평균 수위는 매년 7-8월이 가장 높 았고 월평균 최고 수위는 2.059 m으로 나타났다. 연중 수 위 관측값이 가장 높은 8월의 일별 수위는 Fig. 3과 같으 며 조사기간 동안 최고 수위는 2010년의 4.99 m로 나타 났다. 수위 변동의 원인은 강수량이며 하반림 지역에 관 측 장비가 없어 하반림 지역의 직접적인 수위 변동, 침수 기간을 산출하는데 한계가 있었다.
식생군집구조 및 경관의 변화
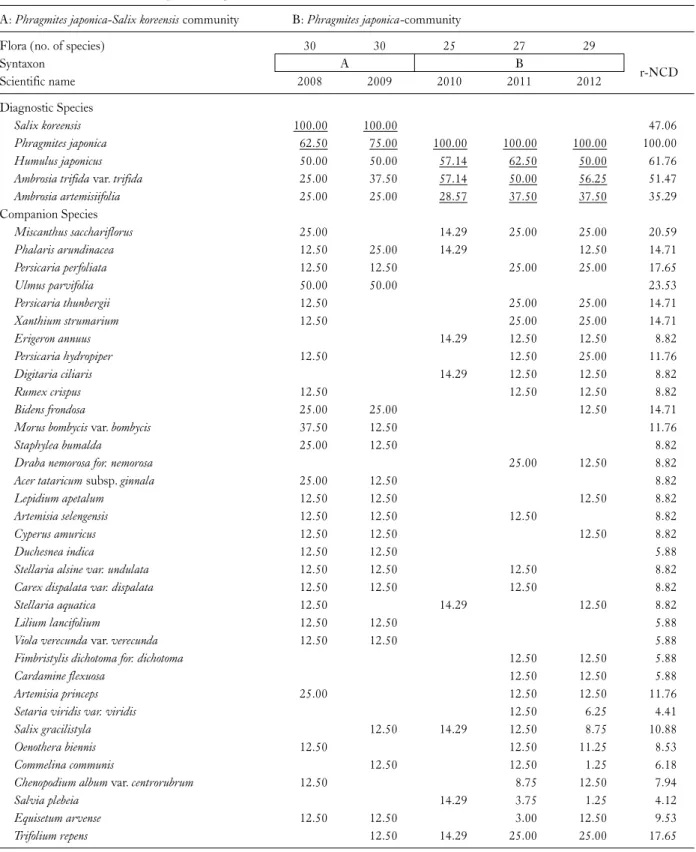
종합상재도표에 의한 하반림의 syntaxon은 2008년, 2009년에 버드나무-달뿌리풀군락(Phragmites japonica-Salix koreensis community)으로 나타났고 2010년부터 2012년 은 달뿌리풀군락(Phragmites japonica-community)으로 나 타났다(Table 3). 조사시기별 군집의 유사성을 확인하기 위해 군집분석(cluster analysis) 분석을 실시한 결과 2008 년 2009년 군집이 유사하고, 2010년, 2011년, 2012년 군 집이 유사한 것으로 나타났다(Fig. 4). 식생군집형의 변 화는 2010년 강우량이 증가하여 수위가 가장 높았으며, 이 시기는 가물막이 조성으로 조사지역 하반림의 침수 기간이 증가했기 때문이다.
또한 2008년, 2009년 군집의 진단종(diagnostic species) 이었던 버드나무의 고사는 교목층, 초본층의 2층위 구조 였던 식생군집을 초본 단층구조 식생형으로 변화시킨 것으로 분석되었다. 결국 식생군집의 주된 변화 요인은 한탄강댐 가물막이로 인해 배수가 원활하지 않아 버드
Table 3. The synthesis table during the study period
A: Phragmites japonica-Salix koreensis community B: Phragmites japonica-community
Flora (no. of species) 30 30 25 27 29
Syntaxon A B
r-NCD
Scientific name 2008 2009 2010 2011 2012
Diagnostic Species
Salix koreensis 100.00 100.00 47.06
Phragmites japonica 62.50 75.00 100.00 100.00 100.00 100.00
Humulus japonicus 50.00 50.00 57.14 62.50 50.00 61.76
Ambrosia trifida var. trifida 25.00 37.50 57.14 50.00 56.25 51.47
Ambrosia artemisiifolia 25.00 25.00 28.57 37.50 37.50 35.29
Companion Species
Miscanthus sacchariflorus 25.00 14.29 25.00 25.00 20.59
Phalaris arundinacea 12.50 25.00 14.29 12.50 14.71
Persicaria perfoliata 12.50 12.50 25.00 25.00 17.65
Ulmus parvifolia 50.00 50.00 23.53
Persicaria thunbergii 12.50 25.00 25.00 14.71
Xanthium strumarium 12.50 25.00 25.00 14.71
Erigeron annuus 14.29 12.50 12.50 8.82
Persicaria hydropiper 12.50 12.50 25.00 11.76
Digitaria ciliaris 14.29 12.50 12.50 8.82
Rumex crispus 12.50 12.50 12.50 8.82
Bidens frondosa 25.00 25.00 12.50 14.71
Morus bombycis var. bombycis 37.50 12.50 11.76
Staphylea bumalda 25.00 12.50 8.82
Draba nemorosa for. nemorosa 25.00 12.50 8.82
Acer tataricum subsp. ginnala 25.00 12.50 8.82
Lepidium apetalum 12.50 12.50 12.50 8.82
Artemisia selengensis 12.50 12.50 12.50 8.82
Cyperus amuricus 12.50 12.50 12.50 8.82
Duchesnea indica 12.50 12.50 5.88
Stellaria alsine var. undulata 12.50 12.50 12.50 8.82
Carex dispalata var. dispalata 12.50 12.50 12.50 8.82
Stellaria aquatica 12.50 14.29 12.50 8.82
Lilium lancifolium 12.50 12.50 5.88
Viola verecunda var. verecunda 12.50 12.50 5.88
Fimbristylis dichotoma for. dichotoma 12.50 12.50 5.88
Cardamine flexuosa 12.50 12.50 5.88
Artemisia princeps 25.00 12.50 12.50 11.76
Setaria viridis var. viridis 12.50 6.25 4.41
Salix gracilistyla 12.50 14.29 12.50 8.75 10.88
Oenothera biennis 12.50 12.50 11.25 8.53
Commelina communis 12.50 12.50 1.25 6.18
Chenopodium album var. centrorubrum 12.50 8.75 12.50 7.94
Salvia plebeia 14.29 3.75 1.25 4.12
Equisetum arvense 12.50 12.50 3.00 12.50 9.53
Trifolium repens 12.50 14.29 25.00 25.00 17.65
Fig. 4. Cluster analysis using a similarity index of vegetation community.
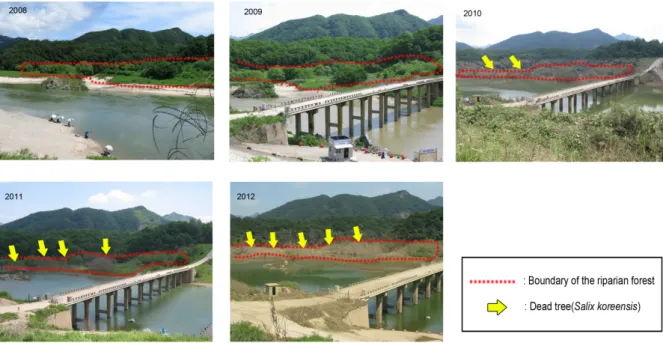
Fig. 5. Changes in the landscape of riparian forest (Red dot line is boundary of the riparian forest and yellow arrow is dead tree (Salix koreensis) caused by flood).
나무의 침수기간이 길어진 것에 기인한 것으로 판단된 다. 버드나무 고사에 따라 하반림의 경관도 변화 하였으 며 2010년 사진 자료에 의하면 가물막이 건설후 홍수에 의한 수위가 하반림보다 상위에 있는 것을 알 수 있으며, 이것은 하반림이 홍수에 의해 침수 된 것을 의미하고 2010년 이후 버드나무의 고사본은 증가하는 것을 알 수 있다(Fig. 5).
종다양성 지수의 변화
2008년부터 2012년까지의 종다양성 지수를 분석한 결과 종풍부도(S)는 연도별로 30, 24, 12, 27, 29로 분석 되었고 수위가 가장 높았던 2010년도에 가장 낮았다. 종 균등도(E)는 연도별로 0.927, 0.904, 0.875, 0.907, 0.904
로 분석되었고 2010년도에 가장 낮았다. Shannon 종다 양도(H)는 3.154, 2.873, 2.175, 2.990, 3.043으로 분석되 었고 2010년 분석값이 가장 낮았다. Simpson 종다양도 (D)는 0.9439, 0.9235, 0.8512, 0.9316, 0.9349로 2010년도 에 가장 낮게 분석되었다(Table 4). 4개의 종다양성 지수 는 공통적으로 2010년에 가장 낮은 값을 나타내었고, 이 후 증가하였다. 이러한 현상은 2010년에 완공된 가물막 이의 영향으로 하반림의 침수기간의 증가하였고 하반림 의 침수는 버드나무의 고사를 유발하였다. 버드나무의 고사는 버드나무-달뿌리풀군락의 숲지붕이 개방되는 요인으로 작용하였으며, 숲지붕의 개방은 초본층의 광 량의 변화로 초본층의 종조성에 영향을 주어 종다양성 변화에 직접적 요인으로 작용한 것으로 판단된다.
Table 4. During the study period of the species diversity index
Survey year S E H D
2008 2009 2010 2011 2012
30 24 12 27 29
0.927 0.904 0.875 0.907 0.904
3.154 2.873 2.175 2.990 3.043
0.9439 0.9235 0.8512 0.9316 0.9349 S, species richness; E, species evenness; H, Shannon species diversity; D, Simpson species diversity.
Table 5. Simple correlation analysis of the water level and diversity index
Water level S E H D
Water level 1.000
S .051 1.000
(.935)
E .118 .916* 1.000
(.850) (.029)
H .098 .996** .934* 1.000
(.875) (.000) (.020)
D .125 .990** .923* .998** 1.000
(.841) (.001) (.025) (0.000)
*Correlation is significant at the 0.05 level (2-tailed); **Correlation is significant at the 0.01 level (2-tailed).
S, species richness; E, species evenness; H, Shannon species diversity; D, Simpson species diversity.
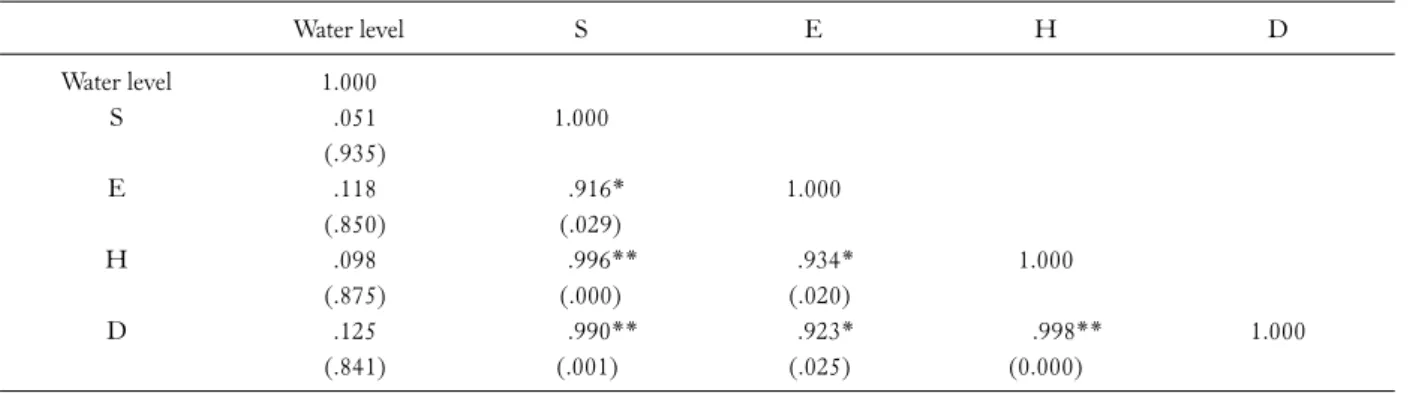
수위와 식물 종 다양성의 상관관계
하반림의 수위변화와 식물 종다양성과의 상관관계 분석결과, Shannon 종다양도(H)와 Simpson 종다양도 (D)가 결정계수 0.998 (sig=0.000)로 가장 높은 상관관 계를 보였다. 종풍부도(S)와 Shannon 종다양도(H)가 결 정계수 0.996 (sig=0.000), 종풍부도와 Simpson 종다양 도(D)가 결정계수 0.990 (sig=0.001)로 높은 상관성이 있는 것으로 나타났다(Table 5). 종 다양성 지수간의 상 관관계는 종수와 피도 등의 동일 변수로 산출된 지수값 으로 상관관계가 있는 것은 당연한 결과이다. 한편 수위 와 종 다양성 지수와의 결정계수는 0.051-0.125 (sig=0.841-0.935)로 낮은 상관관계를 보였다. 수위와 종 다양성 지수와의 상관관계는 단순한 수위측정값보다 수위의 일자료 및 시간자료 확보하여 다양한 변수를 이 용한 상관 분석이 필요할 것으로 판단된다. 본 연구에서 사용한 수위자료는 하반림에서 10 km 이상 이격된 지역 의 관측자료로 하반림의 종다양성 지수와 상관관계를 규명하는 데 한계가 있었다.
결 론
본 연구는 댐 공사시 수위의 변화가 하반림의 식물사 회에 미치는 영향을 알아보기 위해 시행되었다. 2008년 부터 2012년 까지 한탄강 홍수조절댐으로부터 650 m 떨 어진 하반림을 대상으로 수위변화와 식물 종다양성, 식 생군집구조, 경관변화를 모니터링한 결과 다음과 같은 시사점을 도출하였다.
1) 하반림 모니터링 지역의 식생군집은 가물막이 건 설 전후로 변화하였다. 가물막이 건설전의 하반림의 식 생군집은 버드나무-달뿌리풀군락(Phragmites japonica- Salix koreensis community)의 2층위 구조의 식생 이었으나 가물막이 건설 이후 달뿌리풀군락(Phragmites japonica community)의 단층구조 식생으로 변화하였다. 8월 장마 기에 집중된 강우에 의해 하반림의 수위가 높아졌고, 가 물막이의 영향으로 길어진 침수기간 탓에 버드나무 (Salix koreensis)의 고사가 발생되었고, 이로 인해 하반림 지역의 식생층위구조 변화, 군집구조 변화가 이루어진 것으로 분석되었다.
2) 종풍부도, 종균등도, Shannon 종다양도, Simpson
종다양도지수 등의 식물 종다양성 지수는 가물막이가 건설된 2010년도에 가장 낮았고 2010년 이후 증가하였 다. 종 다양성 지수의 변화는 버드나무가 고사한 지역의 초본층 종 조성의 변화가 원인으로 분석되었다.
3) 본 연구는 하반림 지역의 직접적인 수위 관측자료 가 없어 다양서 지수, 수위와의 유의성 높은 통계분석과 결과도출이 불가능한 연구한계점을 가진다. 향후 유사 연구를 시행할 때 하반림 지역에 관측 시설을 설치하면 수위, 강수량, 탁도, 유속 등의 자료와 생태적 정보를 이 용한 유의성 분석이 가능할 것으로 판단된다.
4) 그러나 하반림의 경관적 변화는 시각적으로 분명 히 관찰 되었으며, 시각적 변화는 하반림의 우점종이었 던 버드나무 고사가 원인이었다. 2010년 사진 자료에 의 하면(Fig. 5) 홍수에 의한 수위가 하반림보다 상위에 있 는 것을 알 수 있는데, 이는 가물막이 설치가 하반림의 침수기간을 증가시켜 우점종이던 버드나무를 고사시킨 직접적 원인임을 확증시키고 있다. Kim et al. (2013)은 호습성 버드나무속 식물이 고탁도 침수시에는 생장이 멈추는 것으로 보고한 바 있는데, 본 연구의 결과 또한 가물막이 설치로 인한 침수가 버드나무 고사의 원인이 되고 있음을 보여주고 있다. 또한, 종다양성 지수의 변화 의 요인으로 작용하였다.
따라서 하천의 수위 변화를 유발하는 보, 소형 댐등의 수위 조절 목적의 시설물은 하천의 경관 및 종 다양성에 영향을 줄 있다. 최근 4대강 살리기 지역인 낙동강 일원 에서 버드나무, 왕버들 등의 버드나무속 식물이 고사하 고 있다는 언론 보도가 있었다. 일부 환경단체, 생태관련 전문가는 낙동강의 보 건설이 수위를 상승시켜 버드나 무속 식물에 영향을 주었다고 주장하고 있다. 본 연구의 결과도 낙동강 버드나무 고사의 원인으로 주장하는 부 분과 상당 부분 일치하는 것으로 수위변화는 하반림의 주요종인 버드나무의 생육에 영향을 줄 것으로 예상된 다.
그러므로 하천의 수위를 조절하는 시설물을 계획할 때 하반림과 같은 종다양성이 풍부한 지역의 수위 변화 에 대한 영향예측이 필요하다. 또한 본 연구와 같은 기초 연구를 지속적으로 수행하여 예측에 필요한 모델이 개 발된다면 하천의 생태자원을 보전할 수 있는 친환경적 하천개발이 될 것으로 판단된다.
감사의 글
본 연구는 한국환경산업기술원 “차세대에코이노베 이션 환경기술개발사업”의 지원을 받아 진행된 연구의
일부입니다.
References
Barling RD, Moore ID. 1994. Role of buffer strips in management of waterway pollution: A review. Env Man 18: 543-558.
Barnes WJ. 1997. Vegetation dynamics on the floodplain of the lower Chippewa River in Wisconsin. J Tor Bot Soc 124:
189-197.
Benjankar R, Egger G, Jorde K, Goodwin P, Glennc NF. 2011.
Dynamic floodplain vegetation model development for the Kootenai River, USA. Env Man 92: 3058-3070.
Braun-Blanquet J. 1964. Pflanzensoniologie. Spriner-Verlag. 3rd ed. Vienna, New York, pp 865.
Bray JR, Curtis JT. 1957. An ordination of the upland forest com- munities of Southern Wisconsin. Eco Mon 27: 325-349.
Egger G, Politti E, Woo H, Cho KH, Park MH, Cho HG, Benjanka R, Lee NJ, Lee HY. 2012. Dynamic vegetation model as a tool for ecological impact assessments of dam operation. J Hydro Env Res 6: 151-161.
Friedman JM, Osterkamp WR, Scott ML, Auble GT. 1998.
Downstream effects of dams on channel geometry and bottom- land vegetation: Regional patterns in the great plains. Wetlands 18: 619-633.
Hill NM, Keddy PA. 1992. Prediction of rarities from habitat vari- ables: Coastal plain plants on Nova Scotian lakeshores. Eco 73:
1852-1859.
Holmes PM, Cowling RM. 1997. The effects of invasion by Acacia saligna on the guild structure and regeneration capa- bilities of South African fynbos shrublands. J App Eco 34:
317-332.
Hooper DU, Chapin III FS, Ewel JJ, Hector A, Inchausti P, Lavorel S, Lawton JH, Lodge DM, Loreau M, Naeem S, Schmid B, Setälä H, Symstad AJ, Vandermeer J, Wardle DA.
2005. Effects of biodiversity on ecosystem functioning: a con- sensus of current knowledge. Eco Mon 75: 3-35.
Hughes FMR. 1990. The influence of flooding regimes on forest distribution and composition in the Tana River floodplain.
Kenya J appl Ecol 27: 475-491.
Jamieson B, Braatne JH. 2001. Riparian cottonwood ecosystems &
regulated flows in Kootenai & Yakima sub-basins: Volume I.
Kootenai River (Overview, Report & Appendices). Bonneville Power Administration, Portland, OR, pp 118.
Keddy PA Constabel P. 1986. Germination of ten shoreline plants in relation to seed size, soil particle size and water level: an ex- perimental study. J Eco 74: 133-141
Kim JT, Kim EJ, Kang JG, Yeo HK. 2013. Impact of turbidity on protected plants along river levees. J Eng Geo 23: 161-170. (in Korean with English abstract)
Kim JW, Manyko YI. 1994. Syntaxonomical and synchorological characteristics of the cool-temperate mixed forest in the Southern Sikhote Alin, Russian East. J Eco 17: 391-413.
Magilligan FJ, Nislow KH, Graber BE. 2003. Scale-independent assessment of discharge reduction and riparian disconnectivity following flow regulation by dams. Geo 31: 569-572.
Margalef R. 1958. Information theory in ecology. Gen Sys 3:
36-71.
McCune B, Mefford MJ. 1999. Multivariate analysis of ecological data (version 4.25). MjM Software, Gleneden Beach, OR, USA, pp 28.
Naiman RJ, Decamps H, Pollock M. 1993. The role of riparian corridors in maintaining regional biodiversity. Eco App 3:
209-212.
Nicol JM, Ganf GG. 2000. Water regimes, seedling recruitment and establishment in three wetland plant species. Mar Fre Res 51: 305-309.
Pielou EC. 1975. Ecological diversity. John Wiley and Sons, New York, pp 165.
Riis T, Hawes I. 2002. Relationships between water level fluctua- tions and vegetation diversity in shallow water of New Zealand
lakes. Aquatic Botany 74: 133-148.
Shannon CE, Weaver W. 1949. The mathematical theory of communication. University of Illinois Press, Urbana, pp 233.
Simpson EH. 1949. Measurement of diversity. Nat 163: 688.
Stanford JA, Lorang MS, Hauer FR. 2005. The shifting habitat mosaic of river ecosystems. Internationale Vereinigung fur Theoretische und Angewandte Limnologie Verhandlungen 29;
123-136
Westhoff V, Van Der Maarel E. 1973. The Braun-Blanquet approach. In: Ordination and classification of communities (Whittaker RH ed). Hague, Boston, London, pp 167-726.
Wilson SD, Keddy PA. 1985. Plant zonation on a shoreline gra- dient: physiological response curves of component species. J Eco 73: 851-860.
Yang F, Liu WW, Wang J, Liao L, Wang Y. Riparian vegetation’s responses to the new hydrological regimes from the Three Gorges Project: Clues to revegetation in reservoir water-lev- el-fluctuation zone. Act Eco Sin 32: 89-98.