Veterinary Science
http://dx.doi.org/10.4142/jvs.2014.15.1.149
Received: 16 Jul. 2012, Revised: 7 Nov. 2012, Accepted: 24 Dec. 2012
Original Article
*Corresponding author: Tel: +82-2-450-4165; Fax: +82-2-444-4396; E-mail: [email protected]
ⓒ 2014 The Korean Society of Veterinary Science.
This is an Open Access article distributed under the terms of the Creative Commons Attribution Non-Commercial License (http://creativecommons.org/licenses/by-nc/3.0) which permits unrestricted non-commercial use, distribution, and reproduction in any medium, provided the original work is properly cited.
Echocardiographic assessment of coronary artery flow in normal canines and model dogs with myocardial infarction
Nohwon Park, Jaehwan Kim, Miyoung Lee, Soyun Lee, Sunhye Song, Seungjun Lee, Soyoung Kim, Yangwoo Park, Kidong Eom*
Department of Veterinary Radiology and Diagnostic Imaging, College of Veterinary Medicine, Konkuk University, Seoul 143-701, Korea
This study was conducted to evaluate the usefulness of coronary arterial profiles from normal dogs (11 animals) and canines (six dogs) with experimental myocardial infarction (MI) induced by ligation of the left coronary artery (LCA). Blood velocity of the LCA and right coronary artery (RCA) were evaluated following transthoracic pulsed-wave Doppler echocardiography. The LCA was observed as an infundibular shape, located adjacent to the sinus of Valsalva. The RCA appeared as a tubular structure located 12 o’clock relative to the aorta. In normal dogs, the LCA and RCA mean peak diastolic velocities were 20.84 ± 3.24 and 19.47 ± 2.67 cm/sec, respectively. The LCA and RCA mean diastolic deceleration times were 0.91 ± 0.14 sec and 1.13 ± 0.20 sec, respectively. In dogs with MI, the LCA had significantly (p < 0.01) lower peak velocities (14.82 ± 1.61 cm/sec) than the RCA (31.61 ± 2.34 cm/sec). The RCA had a significantly (p < 0.01) rapid diastolic deceleration time (0.71 ± 0.06 sec) than that found in the LCA (1.02 ± 0.22 sec) of MI dogs. In conclusion, these profiles may serve as a differential factor for evaluating cardiomyopathy in dogs.
Keywords: coronary artery, dog, echocardiography, myocardial infarction, peak diastolic velocity
Introduction
Coronary flow velocity and coronary flow reserve measurements provide useful clinical and physiological information in humans [17]. Until recently, coronary artery disease was conventionally evaluated by assessing regional and global left ventricular function with the patient at rest and under stress [34]. Imaging techniques that enable direct visualization of the coronary arteries
include Doppler guidewire [1], computed tomographic angiography [22,24,25], transesophageal [33] or intracardiac echocardiography [30], and magnetic resonance angiography [3,20]. These techniques are invasive and expensive [34], and their use in veterinary medicine is therefore limited.
The measurement of coronary flow velocity using transthoracic Doppler echocardiography was first described in human medicine in 1987 [34]. Since then, visualization of the coronary arteries and blood flow assessment using transthoracic echocardiography has improved owing to technological advances in ultrasonography with the aid of digital imaging using a high-frequency transducer [34].
Transthoracic echocardiography is a noninvasive, inexpensive, and reproducible technique for monitoring coronary arterial flow [17]. However, transthoracic echocardiography for evaluating coronary flow velocities has not been utilized in veterinary medicine to the best of our knowledge. The purpose of this study was to evaluate the ability of echocardiographic techniques to measure peak diastolic velocity in the coronary arteries of clinically healthy beagles. In addition, coronary artery flow in normal dogs was compared to that observed in a canine model of myocardial infarction (MI).
Materials and Methods
The Institutional Animal Care and Use Committee of
Konkuk University (Korea) approved the study protocol
(IACUC No. KU11059). In total, 17 beagles were included
in the investigation: 11 were in the control group (seven
males and four females) and were six included in the MI
group (four males and two females). All dogs were
purchased from Beijing Marshall Biotechnology (China).
The median weight of the dogs was 9.43 kg (range: 8.5∼
10.5 kg) and the median age was 22.8 months (range: 15∼28 months). Following clinical and laboratory examinations, all the dogs were found to be in good health. Results from the physical examination, hematology, serology, electrocardiography, radiography, and echocardiography were all normal. The dogs were also negative for heartworm infections according to the Dirofilaria immitis antigen test and microscopy evaluation of blood samples.
Six canines in the MI group had previously undergone surgical ligation of the left anterior descending (LAD) artery below the first diagonal branch. Medetomidine (0.02 mg/kg, intravenously, Domitor; Oricon Corporation Animal Health, Finland) was used for sedation 20 min before surgery and propofol (5 mg/kg, intravenously, Anepol; Hana Pharma, Korea) was administered to induce anesthesia. The dogs were intubated with an endotracheal tube and anesthesia was maintained with isoflorane (1.5∼
2% in 100% oxygen through the endotracheal tube, Foran;
JW Pharmaceutical, Korea).
The dogs were placed in a right lateral recumbent position and left thoracotomy was performed at the level of the 5th intercostal space. After thoracotomy, the pericardial sac was incised and the exposed paraconal branch of the left coronary artery was permanently ligated using non-absorbable suture material (Prolene; Johnson &
Johnson Medical, USA) below the first diagonal branch to induce MI. Lidocaine (Daehan Lidocaine HCl 2%; Daehan Pharma, Korea) was injected as a 2 mg/kg intravenous bolus before coronary artery ligation was performed. This compound was then administrated as an intravenous infusion at a constant rate of 0.05 mg/kg/min during the rest of the surgical procedure to prevent ventricular tachycardia. MI was confirmed by immediate ST segment elevation on electrocardiography and a color change of the myocardium to blue. After coronary artery ligation, the pericardium and thoracic wall was closed with absorbable suture material (Maxon; Covidien, Ireland). Tramadol (5 mg/kg, intravenously, Tridol amp.; Yuhan Corporation, Korea) and cephradine (30 mg/kg, intravenously, Cefradine; Sinil Pharm, Korea) were administrated for pain control and to prevent infection, respectively.
Echocardiography was performed using ultrasound (Prosound alpha7; Hitachi Aloka Medical, Japan) and a 3∼
8-MHz broad-frequency sector transducer a month after MI induction while the dogs were conscious. Ultrasonographic scanning was performed using 6.15 MHz color Doppler flow imaging. To obtain images of optimal quality, the velocity range and gain setting were adjusted accordingly.
To make a complete assessment, both the left coronary artery (LCA) and right coronary artery (RCA) were examined in this study. To evaluate the LCA, all the dogs were examined while in a right lateral recumbent position and an acoustic window was created in the fourth or fifth
intercostal spaces. If images of the aorta were obtained in the right parasternal long-axis left ventricular outflow view, then the area anterior to the left ventricular outflow tract and left interventricular sulcus were examined using 2D imaging in combination with color flow mapping. Images of the RCA were obtained with the transducer placed in the fourth and fifth intercostal spaces while the animals were in a left lateral recumbent position. When the transverse images of the aorta were identified in the left cranial parasternal short-axis view of the aorta, the right coronary cusp of the aorta was examined with 2D imaging and color flow mapping. Peak diastolic velocity and diastolic deceleration time of the RCAs and LCAs were measured by transthoracic pulsed-wave Doppler echocardiography with a sample volume of 1.5 mm and a frequency of 5.0 MHz.
All the data are expressed as the mean and standard deviation, and analyzed using statistical software (SPSS for Windows, ver. 19.0; SPSS, USA). An independent t-test with Bonferroni correction was used to compare the coronary artery diastolic peak velocities in each artery between the groups (control and MI dogs) and within each group (a p value < 0.01 was considered to be statistically significant). To evaluate the effect of observational variability on the measurement of diastolic peak velocity, two independent observers (Mr. Jaehwan Kim and Mr.
Seungjun Lee) acquired images of coronary artery blood flow with pulsed wave Doppler echocardiography and recorded their results separately. Inter-observer agreement was assessed using two-way random intraclass coefficiency. Reproducibility was measured by conducting two transthoracic echocardiograph examinations 2 days apart for each dog. One-way intraclass coefficiency values were obtained to evaluate observed agreement. Inter- and intra-observer agreement was considered significant if the p value was less than 0.05.
Results
Before assessments of coronary arterial flow were made by transthoracic Doppler echocardiography, successful MI induction in all six MI dogs was confirmed by two- dimensional echocardiographic findings such as wall thinning, hyperechoic fibrosis, and hypokinesia of the infarcted segment of the left ventricular apex. However, other signs associated with MI, such as lethargy or exercise intolerance, were not observed in the MI group.
After confirming MI induction by two-dimensional
echocardiography, transthoracic echocardiographic
evaluation of the coronary arteries was performed while
the animals were conscious. To obtain images of the
LCA, a clockwise-rotated beam angle (range: 28∼47.7
o)
in the right parasternal long-axis left ventricular outflow
view was used. For the RCA, a clockwise-rotated
inclined beam angle correction (range: 28∼44
o) in the
Fig. 1. Images of the coronary arteries with two-dimensional echocardiography (left) and color Doppler mapping (right). (A) Image of the right coronary artery (RCA; arrows) obtained from the modified left cranial short-axis view. (B) Image of the left coronary artery (LCA; arrows) acquired from the modified right parasternal long-axis left ventricular outflow tract view. RV:
right ventricle, RA: right atrium, Ao: aorta, LA: left atrium, LV:
left ventricle.
Fig. 2. Spectral Doppler mode images of coronary blood flow in the myocardial infarction (MI) group and control group. (A) RCA blood flow in a control dog. (B) RCA blood flow in a beagle with MI. (C) LCA blood flow in a control canine. (D) LCA blood flow in an animal with MI. S: systolic wave, D: diastolic wave.
left cranial parasternal short-axis view of the aorta was employed.
Hypoechoic coronary arteries were distinct from other cardiac structures on the two dimensional echocardiography images. The LCA was an infundibular structure arising from the sinus of Valsalva on the right parasternal long-axis left ventricular outflow view. The RCA appeared as tubular structures with the thin hyperechoic wall arising from the right coronary cusp of the aorta on the left cranial parasternal short-axis view. Blood flow of the LCA moved away from the probe on the color Doppler echocardiography whereas blood flowed toward the probe in the RCA.
Systolic-(S) and diastolic-phase (D) waves for the RCA were found, but an S-wave was not observed in the LCA.
Blood flow waves in the coronary arteries had rapid acceleration times and relatively long deceleration times (Fig. 2). The mean peak diastolic velocities of the LCAs and RCAs in the control group were 19.47 ± 2.67 and 20.84 ± 3.24 cm/sec, respectively (Table 1), and were not significantly different. Diastolic deceleration time of the LCA was slightly more rapid compared to that of the RCA
(0.91 ± 0.14 sec vs. 1.13 ± 0.20 sec).
In the MI group, peak diastolic velocities and diastolic deceleration times of the LCAs and RCAs were significantly different from those of the control group (Fig.
2 and Table 1). Peak diastolic velocity of the LCA was significantly lower compared to that of the RCA in the MI group. Moreover, peak diastolic velocity of the LCA in the MI group was significantly slower relative to that of the control group (14.82 ± 1.61 cm/sec vs. 19.47 ± 2.67 cm/sec) and peak diastolic velocity of RCA in the MI group was significantly faster than that in the control group (31.61 ± 2.34 cm/sec vs. 20.84 ± 3.24 cm/sec; Table 1, Figs. 2 and 3).
Diastolic deceleration time was also altered in the MI group. Diastolic deceleration time of the LCA was slightly slower in MI group compared with that in the control group (1.02 ± 0.22 sec vs. 0.91 ± 0.14 sec). The MI group had a significantly faster diastolic deceleration time in the RCA than the control group (0.71 ± 0.06 sec vs. 1.13 ± 0.20 sec).
Differences in diastolic deceleration time between the LCA and RCA were significant and diastolic deceleration time of the LCA was slower than that of the RCA (1.02 ± 0.22 sec vs. 0.71 ± 0.06 sec; Table 1, Figs. 2 and 4).
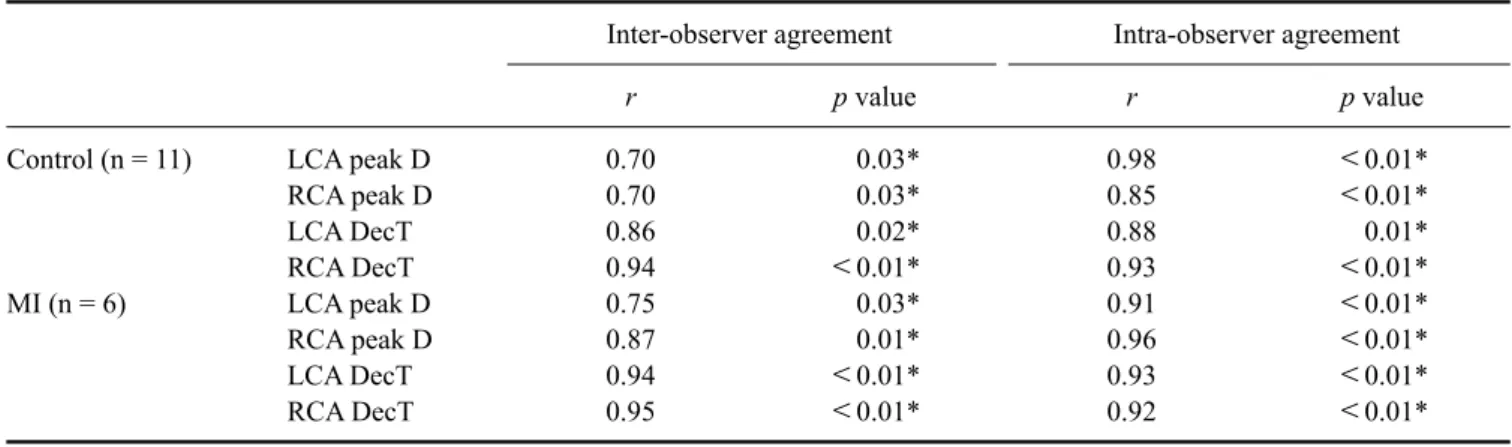
There was strong agreement between the two individual
observers who performed the coronary artery
measurements. Reliability between the observers for the
peak diastolic velocities of the LCA (r = 0.70, p = 0.03)
and RCA (r = 0.70, p = 0.03) was significantly high for the
control group. Reliability between observers for the peak
diastolic velocities of the LCA (r = 0.75, p = 0.03) and
Table 1. Diastolic peak velocities and deceleration times in the coronary arteries of normal beagles and dogs with MI
Control (n = 11) MI (n = 6) LCA peak D (cm/sec)
RCA peak D (cm/sec) LCA DecT (sec) RCA DecT (sec)
19.47 ± 2.67 20.84 ± 3.24 0.91 ± 0.14 1.13 ± 0.20
14.82 ± 1.61*
31.61 ± 2.34*
,†1.02 ± 0.22 0.71 ± 0.06*
,†*p < 0.01 vs. the control group; †p < 0.01 vs. the LCA. Control:
normal dogs, MI: dogs with myocardial infarction, peak D: diastolic peak velocity, DecT: deceleration time.
Fig. 4. Box-and-whisker plot of the diastolic deceleration time of normal dogs and model canines with MI. The RCA in the MI group had a rapid diastolic deceleration time compared to that of the RCA in the control group (*) and that of the LCA in the MI group (†).
Fig. 3. Box-and-whisker plot of the diastolic peak velocity of normal dogs and model canines with MI. The MI group had significantly different peak diastolic velocities in the RCA and LCA compared to those for the control group (*). The RCA also had a more rapid peak diastolic velocity than that of the LCA in the MI group (†).
Table 2. Inter- and intra-observer agreement for the coronary artery mean diastolic peak velocity and deceleration time
Inter-observer agreement Intra-observer agreement
r p value r p value
Control (n = 11)
MI (n = 6)
LCA peak D RCA peak D LCA DecT RCA DecT LCA peak D RCA peak D LCA DecT RCA DecT
0.70 0.70 0.86 0.94 0.75 0.87 0.94 0.95
0.03*
0.03*
0.02*
< 0.01*
0.03*
0.01*
< 0.01*
< 0.01*
0.98 0.85 0.88 0.93 0.91 0.96 0.93 0.92
< 0.01*
< 0.01*
0.01*
< 0.01*
< 0.01*
< 0.01*
< 0.01*
< 0.01*
*Agreement is significant (p < 0.05).