Introduction
Right ventricular apical (RVA) pacing, independently of pacing mode, can create an artificial inter-ventricular conduc- tion delay and impairs left ventricular (LV) function.1) Several large, randomized clinical trials on pacing mode selection have suggested an association between a high percentage of RVA pacing and increased risks of atrial fibrillation (AF) and heart failure in patients with sick sinus syndrome (SSS).2-4) Long- term RVA pacing may also result in changes in LV wall thick- ness5) and LV remodeling such as degenerative fibrosis.6)7) In addition, functional mitral regurgitation and left atrial (LA) remodeling may occur during RVA pacing.8)9)
However, it remains unclear whether the deterioration of LA function, as noted in a proportion of patients receiving RVA pacing, is directly related to LV dyssynchrony. Since assessment
of myocardial longitudinal function based on strain echocar- diography may be a sensitive marker for detecting subclinical alterations in LV and LA systolic performance,10-12) we assessed the impact of chronic RVA pacing on LA function using tissue Doppler based strain echocardiography and association of LA strain parameters with LV mechanical dyssynchrony in the pres- ent study. We also aimed to know that patients can have signifi- cant myocardial functional benefit from lower frequency of RVA pacing compared with higher frequency of pacing.
Methods
Study design and subjects
We prospectively observed 40 patients who needed perma- nent pacemaker implantation for SSS between March 2008 ORIGINAL ARTICLE J Cardiovasc Ultrasound 2012;20(1):42-48
Impact of Right Ventricular Apical Pacing and Its Frequency on Left Atrial Function
Byung-Joo Choi, MD1, Kyoung-Im Cho, MD2, Seong-Man Kim, MD2, Yeo-Jeong Song, MD2, Hyeon-Gook Lee, MD2 and Tae-Ik Kim, MD2
1Division of Cardiology, Department of Internal Medicine, Ulsan Hospital, Ulsan, Korea
2Division of Cardiology, Department of Internal Medicine, Maryknoll Medical Center, Busan, Korea
Background: Right ventricular apical (RVA) pacing induces left ventricular (LV) dyssynchrony, increases the risk of persistent atrial fibrillation in the long term. The aim was to investigate the effects of RVA pacing on left atrial (LA) function, which are unknown.
Methods: Echocardiographic evaluation including LV dyssynchrony based on conventional Doppler, tissue Doppler imaging and speckle tracking strain echocardiography was done before and after (12 months) single-chamber ventricular pacemaker implantation in 40 patients with sick sinus syndrome. Patients were divided to 2 groups, according to the RVA pacing frequency (group I had higher pacing rate of more than 50% and group II, less than 50%).
Results: There was no significant difference in LV ejection fraction, however, mean global LV strain, myocardial performance index, and parameters of LV dyssynchrony had shown significant changes after 12 months of RVA pacing. There were also significant increase in the LA volume index and the reduction of peak systolic LA strain and strain rate (SR), peak early and late diastolic SR after RVA pacing. Moreover, there was significant deterioration of LV dyssynchrony and both LA and LV longitudinal function in even group II. LA functional deterioration and LA volume was significantly correlated with the frequency of RVA pacing.
Conclusion: LV dyssynchrony, induced by RVA pacing, significantly impaired active LA contraction and passive stretching, and these findings were shown in the patients with even less than 50% of RVA pacing. Impairment of LA strain/SR was significantly correlated with the frequency of RVA pacing.
KEY WORDS: Atrial function · Pacemaker · Dyssynchrony.
• Received: December 27, 2011 • Revised: February 14, 2012 • Accepted: February 16, 2012
• Address for Correspondence: Kyoung-Im Cho, Division of Cardiology, Department of Internal Medicine, Maryknoll Medical Center, 121 Junggu-ro, Jung-gu, Busan 600-730, Korea Tel: +82-51-461-2384, Fax: +82-51-441-6950, E-mail: [email protected]
• This is an Open Access article distributed under the terms of the Creative Commons Attribution Non-Commercial License (http://creativecommons.org/licenses/by-nc/3.0) which permits unrestricted non-commercial use, distribution, and reproduction in any medium, provided the original work is properly cited.
and October 2010. The study population consisted of single- chamber ventricular pacemaker (VVI mode) because of techni- cal difficulties for the other types of pacemaker including dual chamber, and right ventricular outflow track pacing pacemak- ers. No patients had a history of ischemic heart disease, AF, bundle branch block, moderate to severe valvular heart disease, and systolic heart failure (LV ejection fraction < 50%).
Pacemaker follow-up was done at 1, 3, 6, and 12 months af- ter implantation. The participants were divided into 2 groups according to the mean RVA pacing frequency (group I had higher pacing rate of more than 50% and group II, less than 50%), and echocardiographic variables as below were ana- lyzed, as well. The study protocol was approved by the Insti- tutional Review Committee on Human Research at Maryk- noll Medical Center, and informed consent was obtained from all study subjects before participation.
Echocardiographic evaluation
A standard 2-dimensional and strain echocardiographic ex- amination using a 2.5-MHz transducer on the Vivid 7 Di- mension ultrasound equipment (General Electric, Horten, Norway) was performed on all subjects before and after (12 months) pacemaker implantation during normal sinus rhythm not ventricular pacing as possible.
Standard and Doppler echocardiography
Measurement of LV volume, LA volume and ejection fraction was calculated by the Simpson’s methods from the apical 4- and 2-chamber views. Pulsed wave (PW) Doppler of transmitral LV inflow was performed in the apical 4-chamber view, with the sample volume placed at the level of the mitral valve tips and Doppler variables were analyzed during 3 consecutive beats.
The following parameters of global LV diastolic function were determined: peak early (E) and late (A) diastolic mitral flow ve- locity and their ratio (E/A), early (Ea) diastolic mitral annular velocity, deceleration time of the E wave, and LV isovolumic re- laxation time (IVRT). Doppler time intervals were measured from mitral inflow and LV outflow velocity-time intervals as de- scribed by Tei et al.13) and the index of combined LV systolic and diastolic function (myocardial performance index) was cal- culated from the sum of isovolumic contraction time and IVRT divided by ejection time.
Strain echocardiography
Speckle tracking strain imaging (frame rate ≥ 70/sec) and tissue Doppler strain imaging (TDI, frame rate ≥ 115/sec) was performed in the apical 2-chamber, 3-chamber, and 4-cham- ber views using a narrow sector angle. Images from apical chamber views of the LV were obtained at end-expiratory ap- nea and were stored in cine-loop format for subsequent offline analysis. Three heartbeats were collected from each view and a selected 1-cycle was analyzed off-line with an EchoPAC Di- mension system (General Electric, Horten, Norway).
Peak longitudinal systolic strains were measured and aver- aged to assess global longitudinal myocardial regional function.
The endocardial borders were traced at the end-systolic frame, and an automated tracking algorithm outlined the myocardium in successive frames throughout the cardiac cycle. The track- ing quality was verified for each segment (with subsequent manual adjustment of the region of interest, if necessary), and myocardial motion was analyzed by speckle tracking within the region of interest bound by endocardial and epicardial borders. Inadequate tracked segments were automatically ex- cluded from analysis. In this situation, local strain in each seg- ment was calculated. Global LV strain was obtained by aver- aging all segment strain values from the apical 4-chamber, 2-chamber, and long axis views.
For the LA strain, longitudinal peak strain and strain rate were obtained from 2 different areas of the basal segments of the LA free wall and the inter-atrial septum in the apical 4 chamber view by the tissue Doppler strain. For the longitudi- nal measurements, a computation area of 9 × 2 mm with an elliptical shape was chosen,12) and mean peak systolic LA strain and strain rate (Sm-SR), peak early diastolic strain rate (Em- SR) and late diastolic strain rate (Am-SR) are measured.
Measurements of dyssynchrony
The inter-ventricular mechanical delay, calculated as differ- ence between left pre-ejection interval (LPEI) and right pre- ejection interval (RPEI). LPEI is measured by PW Doppler in apical long axis projection and RPEI in short axis parasternal projection with sample volume in level of aortic (LPEI) or pul- monary (RPEI) valve. LPEI and RPEI is the interval from QRS beginning to start of ejection flow.14)
For the intra-ventricular dyssynchrony, myocardial velocity curves are analyzed by tissue synchronization imaging in the apical 2-chamber, 3-chamber, and 4-chamber views. Using the 6-basal, 6-midsegmental LV model, the time from the on- set of the QRS complex to peak systolic velocity in ejection period (Ts) are measured in each segment with 12 × 6 mm sample volume. The septal-to-lateral delay (Ts-SL), a TDI in- dex proposed by Bax et al.,15) is measured as the difference of Ts between the basal septal and lateral walls. The septal-to- posterior delay (Tε-SP) is measured as the time difference from the onset of the QRS complex and peak systolic radial strain wave between the anteroseptum and posterior walls at the parasternal short axis view by speckle tracking strain im- aging.16) Parameters of intra-ventricular dyssynchrony are cal- culated from Ts-SL or from the standard deviation of Ts (Ts- SD) among the 12 LV segments or Tε-SP.
Statistical analysis
Statistical analysis was performed with SPSS 15.0 package program (IBM Corp., Armonk, NY, USA). Results are pre- sented as mean ± standard deviation. Paired Student’s t-test was used for comparisons of continuous variables between be-
fore and after RVA pacing. Comparisons of all measurements were made with independent t-test for the parameters be-
tween group I and II. Correlations between variables were as- sessed by Pearson correlation, and p value of less than 0.05 was considered statistically significant.
Results
Clinical characteristics of subjects
Table 1 lists baseline characteristics of the 40 patients with SSS. The study population included 15 men and 25 women, with a mean age of 65.3 ± 10.2 years (range, 58-86 years).
Twenty three patients had hypertension, 7 had diabetes melli- tus, and 20 had dyslipidemia. Twenty one patients were on calcium-channel blockers, and 23 on angiotensin-converting enzyme inhibitors or angiotensin II receptor blockers. The range of ventricular pacing frequency was 7.8-99.2%.
Long-term effects of RVA pacing on echocardiographic parameters
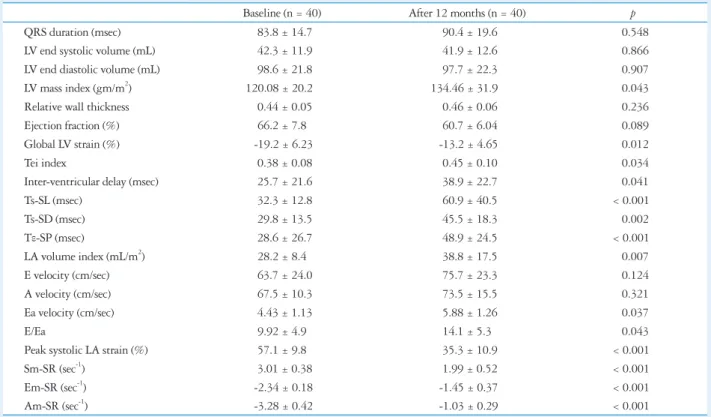
Table 2 showed the echocardiographic variables before and after 12 months of single-chamber ventricular RVA pacing.
Although there was no significant change in LV volume and ejection fraction, the LV mass index, E/Ea, and LA volume in- dex were significantly increased after RVA pacing. Also, there were significantly increased myocardial performance index
Table 2. Parameters of 2-dimensional and strain echocardiography before and after 12 months of RVA pacing
Baseline (n = 40) After 12 months (n = 40) p
QRS duration (msec) 83.8 ± 14.7 90.4 ± 19.6 0.548
LV end systolic volume (mL) 42.3 ± 11.9 41.9 ± 12.6 0.866
LV end diastolic volume (mL) 98.6 ± 21.8 97.7 ± 22.3 0.907
LV mass index (gm/m2) 120.08 ± 20.2 134.46 ± 31.9 0.043
Relative wall thickness 0.44 ± 0.05 0.46 ± 0.06 0.236
Ejection fraction (%) 66.2 ± 7.8 60.7 ± 6.04 0.089
Global LV strain (%) -19.2 ± 6.23 -13.2 ± 4.65 0.012
Tei index 0.38 ± 0.08 0.45 ± 0.10 0.034
Inter-ventricular delay (msec) 25.7 ± 21.6 38.9 ± 22.7 0.041
Ts-SL (msec) 32.3 ± 12.8 60.9 ± 40.5 < 0.001
Ts-SD (msec) 29.8 ± 13.5 45.5 ± 18.3 0.002
Tε-SP (msec) 28.6 ± 26.7 48.9 ± 24.5 < 0.001
LA volume index (mL/m2) 28.2 ± 8.4 38.8 ± 17.5 0.007
E velocity (cm/sec) 63.7 ± 24.0 75.7 ± 23.3 0.124
A velocity (cm/sec) 67.5 ± 10.3 73.5 ± 15.5 0.321
Ea velocity (cm/sec) 4.43 ± 1.13 5.88 ± 1.26 0.037
E/Ea 9.92 ± 4.9 14.1 ± 5.3 0.043
Peak systolic LA strain (%) 57.1 ± 9.8 35.3 ± 10.9 < 0.001
Sm-SR (sec-1) 3.01 ± 0.38 1.99 ± 0.52 < 0.001
Em-SR (sec-1) -2.34 ± 0.18 -1.45 ± 0.37 < 0.001
Am-SR (sec-1) -3.28 ± 0.42 -1.03 ± 0.29 < 0.001
Values are means ± SDs. RVA: right ventricular apical, LV: left ventricular, Ts: the time from the onset of the QRS complex to peak systolic velocity in ejection period, Ts-SL: the difference of Ts between the basal septal and lateral walls, Ts-SD: the standard deviation of Ts among the 12 LV segments, Tε-SP: the time difference from the onset of the QRS complex and peak systolic radial strain wave between the anteroseptum and posterior walls, LA: left atrial, E: peak early diastolic mitral flow velocity, A: peak early diastolic mitral flow velocity, Ea: peak early diastolic mitral annular velocity, Sm-SR: mean peak systolic strain rate, Em-SR: peak early diastolic strain rate, Am-SR: peak late diastolic strain rate
Table 1. Clinical characteristics of study population SSS (n = 40)
Age (yr) 65.3 ± 10.2
Male, n (%) 15 (37.5%)
BMI (kg/m2) 24.6 ± 2.6
SBP (mmHg) 123.1 ± 16.3
DBP (mmHg) 71.3 ± 12.3
Heart rate (/min) 69.4 ± 18.6
Hypertension, n (%) 23 (57.5%)
Diabetes mellitus, n (%) 7 (17.5%)
Smoking, n (%) 9 (22.5%)
Beta blocker, n (%) 6 (15.0%)
CCB, n (%) 21 (52.5%)
Statin, n (%) 20 (50.0%)
ACEi or ARB, n (%) 23 (57.5%)
Mean pacing frequency (%) 56.2 ± 42.8 (range 7.8-99.2%) All values are presented as the mean ± SD. SSS: sick sinus syndrome, BMI: body mass index, SBP: systolic blood pressure, DBP: diastolic blood pressure, CCB: calcium channel blocker, ACEi: angiotensin-converting enzyme inhibitor, ARB: angiotensin II receptor blocker
and reduced global LV strain after RVA pacing as well as in- creased intra-ventricular delays of both TDI velocity and strain analysis (Table 2). The values of the peak systolic LA strain and Sm-SR, Em-SR and Am-SR were also significantly re- duced after 12 months of RVA pacing.
Comparison of long-term effects
of cumulative ventricular pacing percent on echocardiographic parameters
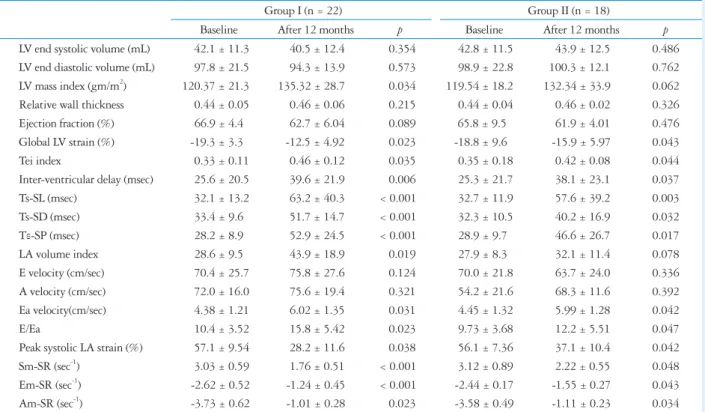
Table 3 showed the changes of the echocardiographic pa- rameters before and after pacing in both groups. Average pac- ing frequency was undoubtedly different (group I: 89.4 ± 12.5 vs. group II: 25.9 ± 20.7%, p < 0.001). After pacing, the values of LV mass index and LA volume index were signifi- cantly higher in the group I, which was not demonstrated in the group II. However, there were significant differences in the value of global LV strain, myocardial performance index and intra-ventricular delays of both TDI velocity and strain analy- sis before and after RVA pacing in both group I and even in the group II (smaller pacing frequency group) (Table 3). Also, there were significantly increased E/Ea and reduced peak sys- tolic LA srain, Sm-SR, Em-SR and Am-SR before and after RVA pacing in both group I and the group II (Table 3). Inter- estingly, there was significant difference in the intra-ventricu-
lar delays of both TDI velocity and strain analysis in favor of group II (Ts-SD; group II 40.2 ± 16.9 ms vs. group I 51.7 ± 14.7 ms, p = 0.025, Tε-SP; group II 46.6 ± 26.7 ms vs. group I 52.9 ± 24.5 ms, p = 0.003). Moreover, group I showed sig- nificantly lower global LV strain (-12.5 ± 4.92 vs. -15.9 ± 5.97%, p = 0.023) and peak LA systolic strain (28.2 ± 11.6 vs. 37.1 ± 10.4%, p = 0.012) compared with group II.
Correlation between the frequency of RVA pacing and the echocardiographic variables of LA function
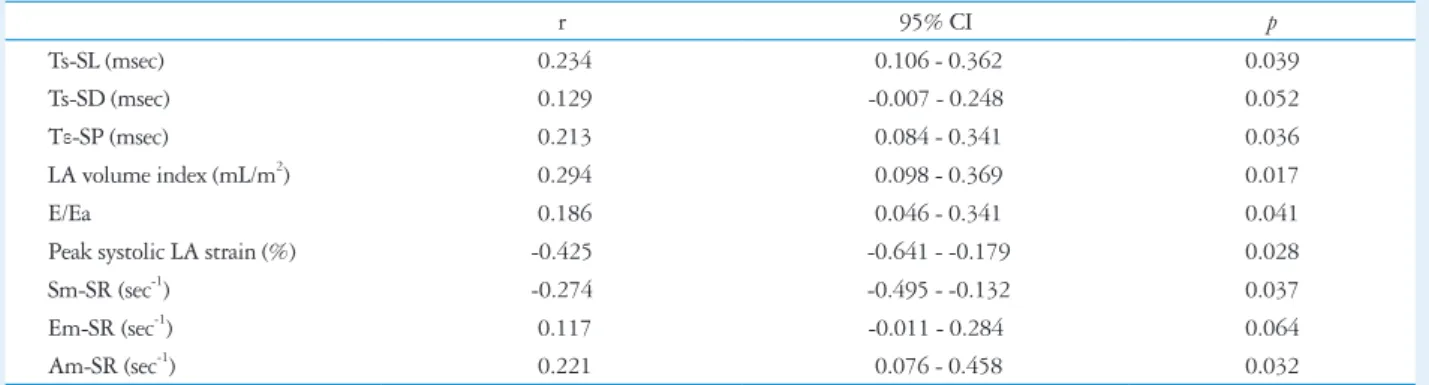
There were significant correlations between the frequency of RVA pacing and the representative parameters of LA function, except for Ts-SD, and Em-SR (Table 4). Interestingly, the peak LA strain showed significant negative correlation with the pacing percentage (r = -0.425, p=0.028) (Table 4).
Discussion
Our study demonstrated that RVA pacing produce LV dys- synchrony and deterioration of LA and LV longitudinal func- tion, as well. Moreover, there was significant reduction of LA and LV function even with lower frequency of RVA pacing, which might be more deteriorated with increased LV dyssyn- chrony induced by high frequency of RVA pacing.
Table 3. Two-dimensional and strain echocardiography parameters before and after 12 months RVA pacing according to the pacing percentage
Group I (n = 22) Group II (n = 18)
Baseline After 12 months p Baseline After 12 months p
LV end systolic volume (mL) 42.1 ± 11.3 40.5 ± 12.4 0.354 42.8 ± 11.5 43.9 ± 12.5 0.486 LV end diastolic volume (mL) 97.8 ± 21.5 94.3 ± 13.9 0.573 98.9 ± 22.8 100.3 ± 12.1 0.762 LV mass index (gm/m2) 120.37 ± 21.3 135.32 ± 28.7 0.034 119.54 ± 18.2 132.34 ± 33.9 0.062 Relative wall thickness 0.44 ± 0.05 0.46 ± 0.06 0.215 0.44 ± 0.04 0.46 ± 0.02 0.326
Ejection fraction (%) 66.9 ± 4.4 62.7 ± 6.04 0.089 65.8 ± 9.5 61.9 ± 4.01 0.476
Global LV strain (%) -19.3 ± 3.3 -12.5 ± 4.92 0.023 -18.8 ± 9.6 -15.9 ± 5.97 0.043
Tei index 0.33 ± 0.11 0.46 ± 0.12 0.035 0.35 ± 0.18 0.42 ± 0.08 0.044
Inter-ventricular delay (msec) 25.6 ± 20.5 39.6 ± 21.9 0.006 25.3 ± 21.7 38.1 ± 23.1 0.037
Ts-SL (msec) 32.1 ± 13.2 63.2 ± 40.3 < 0.001 32.7 ± 11.9 57.6 ± 39.2 0.003
Ts-SD (msec) 33.4 ± 9.6 51.7 ± 14.7 < 0.001 32.3 ± 10.5 40.2 ± 16.9 0.032
Tε-SP (msec) 28.2 ± 8.9 52.9 ± 24.5 < 0.001 28.9 ± 9.7 46.6 ± 26.7 0.017
LA volume index 28.6 ± 9.5 43.9 ± 18.9 0.019 27.9 ± 8.3 32.1 ± 11.4 0.078
E velocity (cm/sec) 70.4 ± 25.7 75.8 ± 27.6 0.124 70.0 ± 21.8 63.7 ± 24.0 0.336
A velocity (cm/sec) 72.0 ± 16.0 75.6 ± 19.4 0.321 54.2 ± 21.6 68.3 ± 11.6 0.392
Ea velocity(cm/sec) 4.38 ± 1.21 6.02 ± 1.35 0.031 4.45 ± 1.32 5.99 ± 1.28 0.042
E/Ea 10.4 ± 3.52 15.8 ± 5.42 0.023 9.73 ± 3.68 12.2 ± 5.51 0.047
Peak systolic LA strain (%) 57.1 ± 9.54 28.2 ± 11.6 0.038 56.1 ± 7.36 37.1 ± 10.4 0.042
Sm-SR (sec-1) 3.03 ± 0.59 1.76 ± 0.51 < 0.001 3.12 ± 0.89 2.22 ± 0.55 0.048
Em-SR (sec-1) -2.62 ± 0.52 -1.24 ± 0.45 < 0.001 -2.44 ± 0.17 -1.55 ± 0.27 0.043
Am-SR (sec-1) -3.73 ± 0.62 -1.01 ± 0.28 0.023 -3.58 ± 0.49 -1.11 ± 0.23 0.034
Values are means ± SDs. RVA: right ventricular apical, LV: left ventricular, Ts: the time from the onset of the QRS complex to peak systolic velocity in ejection period, Ts-SL: the difference of Ts between the basal septal and lateral walls, Ts-SD: the standard deviation of Ts among the 12 LV segments, Tε-SP: the time difference from the onset of the QRS complex and peak systolic radial strain wave between the anteroseptum and posterior walls, LA: left atrial, E: peak early diastolic mitral flow velocity, A: peak early diastolic mitral flow velocity, Ea: peak early diastolic mitral annular velocity, Sm-SR: mean peak systolic strain rate, Em-SR: peak early diastolic strain rate, Am-SR: peak late diastolic strain rate
LV functional change by RVA pacing and mechanical dyssynchrony
Animal studies have revealed dramatic mechanical effects from asynchronous electrical activation because the various re- gions differ not only in the time of onset of contraction but also in the pattern of contraction.17) Early contracting regions close to the pacing site stretch remote regions that are not yet activated. This stretching further delays shortening of the late- activation regions. In clinical practice, RVA pacing therapy for bradycardia causes increase in heart failure and AF incidence through LV dyssynchrony.18-21) Mechanical dyssynchrony is impacted by the myocardial architecture, not only electrophysi- ological but also histological and molecular factors. Therefore, it is speculated that the presence of different degrees of myo- cardial injury and interstitial fibrosis in different myocardial layers and segments of the failing heart would result in het- erogeneous conduction abnormalities, which may increase its likelihood of developing mechanical dyssynchrony.
Echocardiographic strain imaging has been shown to be a useful tool to assess regional LV function, and useful to evalu- ate the effects of mechanical dyssynchrony on LV function be- cause it can differentiate active thickening from passive wall motion. Our result shows the reduced global LV strain after 12 months RVA pacing indicating deterioration of LV systolic deformation as a result of asynchronous electrical activation by RVA pacing. Moreover, unexpectedly, reduced global LV strain was found even in the lower frequency of RVA pacing after 12 months, as well.
LA functional change by RVA pacing and mechanical dyssynchrony
Atrial function during early diastole is strongly influenced by the LV compliance,22) and atrial function as reservoirs dur- ing systolic period is influenced by atrial relaxation. Booster pump function during late diastole is the intrinsic atrial con- traction. LA dysfunction will be present even in a stage with
slightly elevated LA pressure, and parameters of LA contrac- tility assessed by conventional Doppler echocardiography are augmented in this stage; thus it will be difficult to detect LA dysfunction by this method. Our study shows similar mitral inflow filling patterns with non-significant increase in aug- mentation of late diastolic A velocity with RVA pacing.
The atrial walls consist of intricately intermingled muscular bundles oriented circumferentially and longitudinally23) with individual contractility. TDI, as it measures myocardial veloc- ities, displacement and deformation, has been shown to be less load-dependent regional quantitative parameters that reflect regional contraction and relaxation.24) To date, not much data is available on atrial myocardial velocities, and our previous studies showed the role of values of LA strain/SR in diagnosis and management in patients with AF.12)25) We chose to mea- sure the TDI-based LA strain from the basal segments of the inter-atrial septum and the LA lateral wall, because it moves in a direction more parallel to the ultrasound beam and it is less affected by LV motion and translation. Analysis of the TDI-based LA strain demonstrated no significant difference in the septal wall and lateral wall. In this study, we found that there was significant increase in the LA volume index with in- creased E/Ea after RVA pacing, which implicating increased LV filling pressure. Moreover, the values of the peak systolic LA strain and Sm-SR, Em-SR and Am-SR were significantly reduced with RVA pacing. The possible mechanism is that the RVA pacing may increase inter-ventricular dyscoordina- tion and LV depolarization times and consequently, the trans- mitral inflow during early diastole is compromised, which causes a larger residual volume before LA contraction. The pres- ence of such volumetric changes and increased LA pressure might reduce longitudinal deformation, so the atrial length- ening that occurs during ventricular ejection is significantly reduced, and the atrial shortening that occurs during ventric- ular early filling is also reduced. Other studies have shown that LA pressure and volume overload resulted in significant
Table 4. Correlation between the frequency of RVA pacing and the echocardiographic variables of LA function
r 95% CI p
Ts-SL (msec) 0.234 0.106 - 0.362 0.039
Ts-SD (msec) 0.129 -0.007 - 0.248 0.052
Tε-SP (msec) 0.213 0.084 - 0.341 0.036
LA volume index (mL/m2) 0.294 0.098 - 0.369 0.017
E/Ea 0.186 0.046 - 0.341 0.041
Peak systolic LA strain (%) -0.425 -0.641 - -0.179 0.028
Sm-SR (sec-1) -0.274 -0.495 - -0.132 0.037
Em-SR (sec-1) 0.117 -0.011 - 0.284 0.064
Am-SR (sec-1) 0.221 0.076 - 0.458 0.032
RVA: right ventricular apical, LA: left atrial, CI: confidence interval, Ts: the time from the onset of the QRS complex to peak systolic velocity in ejection period, Ts-SL: the difference of Ts between the basal septal and lateral walls, Ts-SD: the standard deviation of Ts among the 12 LV segments, Tε-SP: the time difference from the onset of the QRS complex and peak systolic radial strain wave between the anteroseptum and posterior walls, E: peak early diastolic mitral flow velocity, Ea: peak early diastolic mitral annular velocity, Sm-SR: mean peak systolic strain rate, Em-SR: peak early diastolic strain rate, Am-SR: peak late diastolic strain rate
up-regulation of beta-myosin heavy chain in the LA body as- sociated with decreased velocity of LA contraction.26)
In our study, the peak systolic LA strain, Sm-SR, Em-SR and Am-SR were reduced by RVA pacing, which implies an impaired passive lengthening (stretching) and shortening of the atrial walls, and this is possibly because of increased resid- ual volume with reduced compliance and increased pressure.
Moreover, the reduced LA strain parameters were found even in the lower frequency of RVA pacing after 12 months, as well. However, the significant negative correlation between the frequency of RVA pacing and the peak systolic LA strain/
SR implicate the deterioration of LA function might be exac- erbated by high ventricular pacing.
Study limitations
Although we tried to assess LA function by strain echocar- diography, LA function also could be evaluated by the phasic volume, so the simultaneous measurement of LA phasic vol- ume and LA strain variables might provide the more accurate LA functional change induced by mechanical dyssynchrony.
Secondary, separate measurement of intraventricular and inter- ventricular synchrony index and strain parameters during with narrow QRS and wide QRS would be helpful to know the ef- fect of RVA pacing-induced dyssynchrony or RVA pacing it- self on LA. Finally, although we sought to evaluate the pure effect of RVA pacing on myocardial performance, the number of patients was so small. Large scale multicenter trial is defi- nitely necessary to test our results.
Conclusion
After 12 months of single-chamber ventricular pacemaker implantation, significant deterioration of global LV function with LV mechanical dyssynchrony was induced, which may play a role in the development of heart failure. Moreover, LA volume and pressure burden brought by RVA pacing caused an impairment of LA active contraction and passive stretch- ing, assessed by strain echocardiographic parameters, even in the lower pacing percentage group. There were significant correlations between the cumulative percentage of RVA pac- ing and the representative parameters of LA active contraction and passive stretching, as well.
References
1. Schmidt M, Brömsen J, Herholz C, Adler K, Neff F, Kopf C, Block M. Evidence of left ventricular dyssynchrony resulting from right ventricular pacing in patients with severely depressed left ventricular ejection fraction.
Europace 2007;9:34-40.
2. Sweeney MO, Hellkamp AS, Ellenbogen KA, Greenspon AJ, Freedman RA, Lee KL, Lamas GA; MOde Selection Trial Investiga- tors. Adverse effect of ventricular pacing on heart failure and atrial fibril- lation among patients with normal baseline QRS duration in a clinical tri- al of pacemaker therapy for sinus node dysfunction. Circulation 2003;
107:2932-7.
3. Wilkoff BL, Cook JR, Epstein AE, Greene HL, Hallstrom AP, Hsia
H, Kutalek SP, Sharma A; Dual Chamber and VVI Implantable Defibrillator Trial Investigators. Dual-chamber pacing or ventricular backup pacing in patients with an implantable defibrillator: the Dual Chamber and VVI Implantable Defibrillator (DAVID) Trial. JAMA 2002;288:3115-23.
4. Steinberg JS, Fischer A, Wang P, Schuger C, Daubert J, McNitt S, Andrews M, Brown M, Hall WJ, Zareba W, Moss AJ; MADIT II Investigators. The clinical implications of cumulative right ventricular pacing in the multicenter automatic defibrillator trial II. J Cardiovasc Elec- trophysiol 2005;16:359-65.
5. van Oosterhout MF, Prinzen FW, Arts T, Schreuder JJ, Vanagt WY, Cleutjens JP, Reneman RS. Asynchronous electrical activation induces asymmetrical hypertrophy of the left ventricular wall. Circulation 1998;98:
588-95.
6. Karpawich PP, Rabah R, Haas JE. Altered cardiac histology following apical right ventricular pacing in patients with congenital atrioventricular block. Pacing Clin Electrophysiol 1999;22:1372-7.
7. Vernooy K, Dijkman B, Cheriex EC, Prinzen FW, Crijns HJ. Ven- tricular remodeling during long-term right ventricular pacing following His bundle ablation. Am J Cardiol 2006;97:1223-7.
8. Barold SS, Ovsyshcher IE. Pacemaker-induced mitral regurgitation. Pac- ing Clin Electrophysiol 2005;28:357-60.
9. Maurer G, Torres MA, Corday E, Haendchen RV, Meerbaum S.
Two-dimensional echocardiographic contrast assessment of pacing-induced mitral regurgitation: relation to altered regional left ventricular function. J Am Coll Cardiol 1984;3:986-91.
10. Nishikage T, Nakai H, Lang RM, Takeuchi M. Subclinical left ven- tricular longitudinal systolic dysfunction in hypertension with no evidence of heart failure. Circ J 2008;72:189-94.
11. Cho GY, Song JK, Park WJ, Han SW, Choi SH, Doo YC, Oh DJ, Lee Y. Mechanical dyssynchrony assessed by tissue Doppler imaging is a powerful predictor of mortality in congestive heart failure with normal QRS duration. J Am Coll Cardiol 2005;46:2237-43.
12. Cho KI, Lee HG, Ak SJ, Huh JE, Kim HJ, Moon JY, Park KM, Kim TI. Quantitative assessment of left atrial functional changes in pa- tients with atrial fibrillation by tissue Doppler strain and 2-dimensional strain imaging. Korean Circ J 2006;36:786-93.
13. Tei C, Ling LH, Hodge DO, Bailey KR, Oh JK, Rodeheffer RJ, Ta- jik AJ, Seward JB. New index of combined systolic and diastolic myocardial performance: a simple and reproducible measure of cardiac function--a study in normals and dilated cardiomyopathy. J Cardiol 1995;26:357-66.
14. Cazeau S, Bordachar P, Jauvert G, Lazarus A, Alonso C, Vandrell MC, Mugica J, Ritter P. Echocardiographic modeling of cardiac dyssyn- chrony before and during multisite stimulation: a prospective study. Pacing Clin Electrophysiol 2003;26:137-43.
15. Bax JJ, Marwick TH, Molhoek SG, Bleeker GB, van Erven L, Boersma E, Steendijk P, van der Wall EE, Schalij MJ. Left ventricular dyssynchrony predicts benefit of cardiac resynchronization therapy in patients with end-stage heart failure before pacemaker implantation. Am J Cardiol 2003;92:1238-40.
16. Tops LF, Suffoletto MS, Bleeker GB, Boersma E, van der Wall EE, Gorcsan J 3rd, Schalij MJ, Bax JJ. Speckle-tracking radial strain reveals left ventricular dyssynchrony in patients with permanent right ventricular pacing. J Am Coll Cardiol 2007;50:1180-8.
17. Prinzen FW, Peschar M. Relation between the pacing induced sequence of activation and left ventricular pump function in animals. Pacing Clin Elec- trophysiol 2002;25:484-98.
18. Connolly SJ, Kerr CR, Gent M, Roberts RS, Yusuf S, Gillis AM, Sami MH, Talajic M, Tang AS, Klein GJ, Lau C, Newman DM. Ef- fects of physiologic pacing versus ventricular pacing on the risk of stroke and death due to cardiovascular causes. Canadian Trial of Physiologic Pacing Investigators. N Engl J Med 2000;342:1385-91.
19. Cho GY, Kim MJ, Park JH, Kim HS, Youn HJ, Kim KH, Song JK. Comparison of ventricular dyssynchrony according to the position of right ventricular pacing electrode: a multi-center prospective echocardiograph- ic study. J Cardiovasc Ultrasound 2011;19:15-20.
20. Toff WD, Camm AJ, Skehan JD; United Kingdom Pacing and Cardiovascular Events Trial Investigators. Single-chamber versus dual- chamber pacing for high-grade atrioventricular block. N Engl J Med 2005;353:145-55.
21. Healey JS, Toff WD, Lamas GA, Andersen HR, Thorpe KE, Ellen- bogen KA, Lee KL, Skene AM, Schron EB, Skehan JD, Goldman L, Roberts RS, Camm AJ, Yusuf S, Connolly SJ. Cardiovascular outcomes with atrial-based pacing compared with ventricular pacing: meta-analysis of randomized trials, using individual patient data. Circulation 2006;
114:11-7.
22. Tsang TS, Barnes ME, Gersh BJ, Bailey KR, Seward JB. Left atrial
volume as a morphophysiologic expression of left ventricular diastolic dys- function and relation to cardiovascular risk burden. Am J Cardiol 2002;
90:1284-9.
23. Wang K, Ho SY, Gibson DG, Anderson RH. Architecture of atrial musculature in humans. Br Heart J 1995;73:559-65.
24. Hatle L, Sutherland GR. Regional myocardial function--a new approach.
Eur Heart J 2000;21:1337-57.
25. Cho KI, Lee SH, Jang SH, Lee DW, Lee HG, Kim TI. Assessment of left atrial function and remodeling in patients with atrial fibrillation by performing strain echocardiography: a prospective study to assess the influence of renin-angiotensin system inhibitors on atrial fibrillation. Korean Circ J 2008;38:305-12.
26. Hoit BD, Shao Y, Gabel M, Walsh RA. Left atrial mechanical and biochemical adaptation to pacing induced heart failure. Cardiovasc Res 1995;29:469-74.