pISSN 2288-9272 eISSN 2383-8493 J Oral Med Pain 2018;43(2):41-51 https://doi.org/10.14476/jomp.2018.43.2.41 Article
JOMP
Journal of Oral Medicine and PainCopyright Ⓒ 2018 Korean Academy of Orofacial Pain and Oral Medicine. All rights reserved.
CC This is an open-access article distributed under the terms of the Creative Commons Attribution Non-Commercial License (http://creativecommons.org/licenses/by-nc/4.0/), which permits unrestricted non-commercial use, distribution, and reproduction in any medium, provided the original work is properly cited.
INTRODUCTION
Temporomandibular disorders (TMDs) shows characteris- tics, such as pain, temporomandibular joint (TMJ) sounds, and restricted mandibular movement. Many TMD patients suffer from chronic pain of the masticatory and TMJ areas.
TMD is a major cause of non-odontogenic pain in the cra- niofacial region.
1)The prevalence of TMD is relatively high and is known to afflict around 8% to 15% of the general population.
2)The etiology of TMD is multifactorial and in- cludes biological, environmental, and psychosocial factors
while the impact of each factor depends on the unique characteristic of each individual.
3)TMD pain has a great in- fluence on the quality of life of patients and chronic pain is known to be frequently accompanied by psychological distress which may further aggravate symptoms.
4)However the current diagnosis of TMD is mostly limited to radiologic and clinical studies, and the many studies on indicators that predict the prognosis of TMD patients are based on subjec- tive symptoms or psychological indices. Such limitations in diagnostic tools result in patient differentiation based on symptomatology rather than etiology and extend to
Clinical and Hematologic Characteristics of Temporomandibular Disorders Patients
Seo Eun Park
1, Ji Rak Kim
2, Jung Hwan Jo
3, Ji Woon Park
11Department of Oral Medicine and Oral Diagnosis, School of Dentistry and Dental Research Institute, Seoul National University, Seoul, Korea
2Department of Dentistry and Oral Medicine, School of Medicine, Catholic University of Daegu, Daegu, Korea
3Department of Oral Medicine, Seoul National University Dental Hospital, Seoul, Korea
Received May 31, 2018 Revised June 20, 2018 Accepted June 22, 2018
Purpose: The aim of this study was to evaluate the possibility of utilizing blood tests for the diagnosis of temporomandibular disorders (TMDs) by investigating the hematologic character- istics of TMD patients according to the main source and level of TMD pain and analyzing their interrelationship.
Methods: Clinical examination following the research diagnostic criteria for TMD and hema- tological and psychological evaluations were conducted in 357 TMD patients. Patients were divided into groups according to the main source of pain (myogenous, arthrogenous, and com- bined pain) and the degree of pain according to the graded chronic pain scale (GCPS). Hemato- logical differences among the groups were statistically analyzed.
Results: The C-reactive protein (CRP) level was significantly higher in the arthrogenous pain group compared to the combined pain group (p=0.032). There was no significant difference according to the GCPS classification. There were significant correlations between some of the TMD pain indices and the hematologic indices, and also between the psychological indices and the hematologic indices.
Conclusions: This study suggests the possibility of applying blood tests to the diagnosis, treat- ment and prevention of TMD. Further research should be conducted focusing on the role of CRP in TMD pain with more refined methodology and a longitudinal study design.
Key Words: C-reactive protein; Hematologic tests; Pain; Temporomandibular disorders
Correspondence to:
Ji Woon Park
Orofacial Pain Clinic, Department of Oral Medicine and Oral Diagnosis, School of Dentistry and Dental Research Institute, Seoul National University, 103 Daehak-ro, Jongno- gu, Seoul 03080, Korea
Tel: +82-2-2072-4912 Fax: +82-2-744-9135 E-mail: [email protected] This work was supported by Aspiring Researcher Program through Seoul National University (SNU) in 2014.
symptomatic treatment that fails to eliminate the origin of the pain.
Recent studies have found that certain pain-related dis- eases have specific hematologic characteristics. In fibro- myalgia characterized by chronic widespread pain, neutro- philic leukemoid reaction and mean platelet volume were significantly higher and platelet distribution width was sig- nificantly lower than in the healthy control group.
1)Also hematologic manifestations, such as anemia, leukopenia, and thrombocytopenia also appear in autoimmune diseases, such as systemic lupus erythematosus.
5)In addition, studies have shown that pain in complex re- gional pain syndrome (CRPS) can be the result of an au- toimmune process and characteristic hematologic findings may be used for the diagnosis of CRPS.
6)Based on such findings the possibility of an early diagnosis of the above- mentioned diseases through blood testing is being sought out. One common clinical characteristic of the above dis- eases is chronic pain regardless of its intensity. In addition many other clinical aspects are shared among such disor- ders and include sleep problems, psychological disorders, and sensory alterations. Thus there may be an underlying mechanism that is shared and could be identified through certain testing methods.
Hematologic testing in spite of its invasiveness is an ex- tensively applied approach for accurate diagnosis. Blood tests are relatively simple, fast-working, routinely used and are inexpensive as diagnostic tools. If certain hematologic features appear according to different clinical characteris- tics in TMD patients, the possibility of its application in the diagnosis of TMD may merit further investigation. However, no previous studies have examined the general hemato- logic characteristics through routine blood testing of TMD patients.
This study analyzed the association between clinical fea- tures, psychological factors, pain indices, and hematologic indices of TMD patients. Based on the results, this study aimed to analyze the possibility of applying certain hema- tologic testing in the diagnosis and prognosis building of TMD and further seeking the possibility of applying their results to the treatment and prevention of TMD.
MATERIALS AND METHODS
1. Subjects
We analyzed the data obtained from all consecutive pa- tients who visited the Department of Oral Medicine of Seoul National University Dental Hospital complaining of TMD symptoms from May 2013 to July 2015. A total of 357 pa- tients (70 men and 287 women; age range, 20-81 years;
mean age, 29.54±7.52 years) were included in the study.
Patients were diagnosed as TMD according to the research diagnostic criteria for temporomandibular disorders (RDC/
TMDs).
7)The clinical examination was performed by a sin- gle specialist on TMD and orofacial pain (JWP). Venous blood was harvested from the antecubital vein of the pa- tients included in the study on their first visit. Patients were classified into three groups with no, low, and high disabil- ity due to TMD pain according to the graded chronic pain scale (GCPS) reflecting their level of pain.
8)GCPS of the RDC/TMD axis II was obtained using two indicators, “pain intensity” and “degree of disability”. Pain intensity was cal- culated by averaging current pain intensity, maximum pain intensity and recent 6-month average pain intensity. Degree of disability was assessed with disability points. Disability points are calculated by the disability score (the mean rat- ings of how much the pain has interfered in performing ac- tivities in the last 6 months) and disability days (the number of days that usual activities were avoided due to pain in the last 6 months). The total score is divided into five grades from 0 to IV. And it is divided into 3 groups as GCPS no disability group (Grade 0 with no TMD pain for the past 6 months), low disability group (grade I and II), and high dis- ability group (grade III and IV).
Also, depending on the source of pain, patients were clas- sified into three groups: myogenous, arthrogenous, and combined pain. Patients with myogenous pain were defined as group I, arthrogenous pain as group II, and patients with both as group III.
Patients with active inflammations in the orofacial region,
such as periodontitis with spontaneous bleeding, myositis,
abscess of the maxillofacial region and inflammatory dis-
eases of other body parts, intake of analgesics with anti-in-
flammatory effects within 4 months prior to the study that
could affect the test results, history of trauma and history
of psychiatric or immune diseases were excluded from the study. Also those who refused blood testing were excluded.
This study was approved by the Institutional Review Board of Seoul National University Dental Hospital (IRB no.
CRI15018). The IRB authorized the exemption of informed consent.
2. Clinical and Hematologic Assessment
All patients completed the RDC/TMD axis II questionnaire and the Symptom Checklist-90-Revision (SCL-90-R) evalu- ation. The pain interview included demographic features, such as age, sex, and pain-related characteristics (quality, duration, and intensity), overall health status (cardiovascular, musculoskeletal, psychological and medication usage), and the presence of comorbidities of TMD (headache, sleep dis- turbance, neck and shoulder pain, lower back pain, arm and leg pain, and gastrointestinal disorder).
Clinical examination based on RDC/TMD included clini- cal parameters, such as comfortable mouth opening (CMO), maximum mouth opening (MMO), pain on palpation of masticatory and cervical muscles and TMJ capsule, pain on mouth opening and eccentric mandibular movements (pro- trusion and laterotrusion). Overall TMD pain intensity was scored by the patient on a 0-10 numeric rating scale (NRS).
Clinical parameters were analysed at the initial visit and at 6 months after treatment initiation.
Psychological evaluations were based on RDC/TMD axis II and SCL-90-R.
9)Plasma samples were obtained from the antecubital vein and stored in Lavender tubes coated with ethylenediamine- tetraacetic acid (BD Vacutainer SST; Becton, Dickinson and company, Franklin Lakes, NJ, USA).
Concentrations of C-reactive protein (CRP) were analyzed by means of a highly sensitive immunoturbidimetric as- say autoanalyzer (Hitachi 7180; Hitachi High-Technologies Corp., Tokyo, Japan). Comprehensive laboratory assess- ments consisted of complete blood cell counts with white blood cell (WBC) differential, red blood cell (RBC) indices, and blood chemistry.
3. Statistical Analysis
All statistical analyses were performed using IBM SPSS Stastistics ver. 25.0 software (IBM Co., Armonk, NY, USA).
The results were expressed as mean±standard deviation.
ANOVA was used for the comparison of hematologic indi- ces, psychological indices, and clinical indices among the patient groups. Bonferroni tests were also carried out for post-hoc analysis. Correlations of each dimension of TMD clinical parameters and laboratory findings were analyzed by Spearman’s correlation coefficients.
Results were considered statistically significant at a prob- ability level of p<0.05.
RESULTS
1. Clinical Characteristics
According to GCPS, among the total 357 patients there were 39 patients in the no disability group, 152 patients in the low disability group, and 166 patients in the high dis- ability group. According to the source of pain, 36 were di- agnosed as group I, 126 as group II, and 141 as group III, excluding the 54 patients who had not been definitely diag- nosed at the first visit.
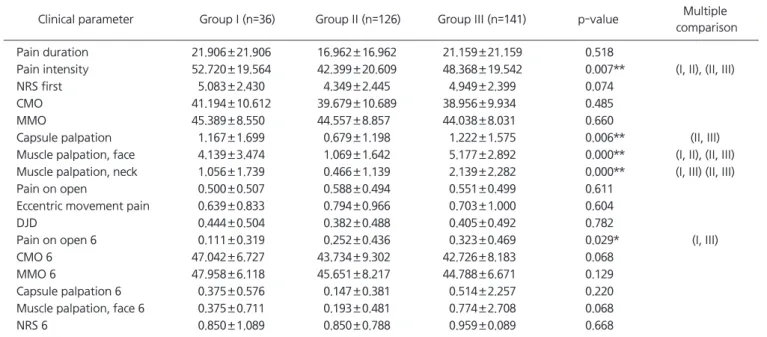
There were significant differences in the pain intensity and pain on mouth opening after 6 months of treatment between the groups according to the source of TMD pain.
Pain intensity was significantly lower in group II (arthrog- enous pain group) than in group I (myogenous pain group) (p=0.021) and group III (combined pain group) (p=0.038).
Pain on mouth opening after 6 months of treatment was significantly higher in group III than group I (Table 1).
Number of areas with positive responsiveness on capsule palpation was significantly higher in group III than group II (p=0.005). Number of areas with positive responsiveness on masticatory muscle palpation was significantly lower in group II than in group I (p<0.001) and group III (p<0.001).
Number of area with positive responsiveness on neck mus-
cle palpation was significantly higher in group III than in
group I (p=0.022) and group II (p=0.00). There was a sig-
nificant difference in the pain intensity and pain on mouth
opening between the groups according to GCPS classifica-
tion. Pain intensity was significantly higher in the high dis-
ability group compared to the low disability group (p=0.000)
and no disability group (p=0.000). Pain on mouth open-
ing was significantly higher in the high disability group
(p=0.034) compared to the no disability group (data not
shown).
Psychological profiles were significantly different in sev- eral indices according to the source of TMD pain. RDC SOM (somatization scores of RDC/TMD axis II) (p<0.001), RDC PSOM (somatization score of RDC/TMD axis II without pain items) (p=0.001), RDC DEP (depression score of RDC/TMD axis II) (p=0.004), along with somatization (p=0.002), obses- sive compulsive (p=0.015) and depression (p=0.020) scores of the SCL-90-R were significantly higher in group III than in group II (Table 2). Also, there were significant differences in psychological indices between groups according to GCPS classification. RDC SOM (p=0.000), RDC PSOM (p=0.000), RDC DEP (p=0.000), along with somatization (p=0.003), obsessive compulsive (p=0.012), interpersonal sensitivity (p=0.047) and depression (p=0.004) scores of the SCL-90-R were significantly higher in the high disability group com- pared to no disability group and low disability group (data
not shown).
2. Hematologic Characteristics
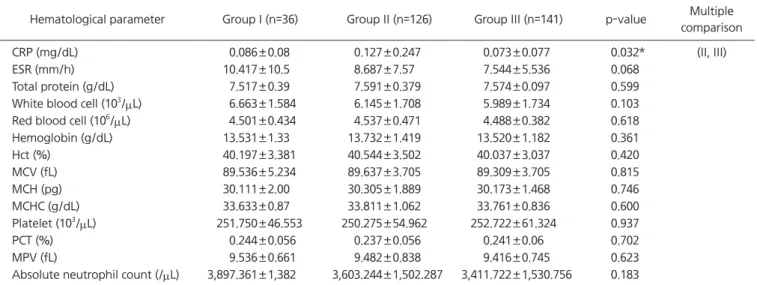
Hematologic characteristics of patients with TMD were significantly different only in the CRP level. CRP level was significantly higher in group II (p=0.032) than in the group III (Table 2). However, there was no significant difference in all hematologic indices among the groups according to graded pain score classification (Table 3).
3. Relationship between Hematological and TMD Pain- Related Indices
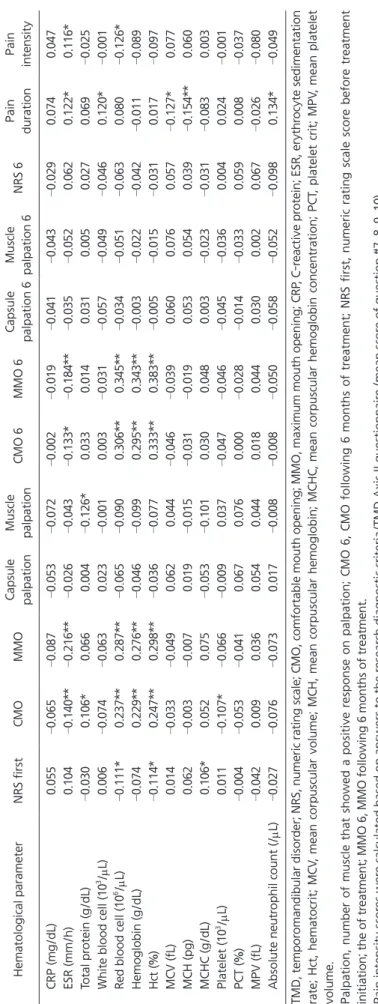
Significant correlation was shown between ESR with CMO (
γ=–0.14, p<0.01), MMO (
γ=–0.216, p<0.01), CMO at 6 months after treatment (
γ=–0.133, p<0.05), MMO at 6 months after treatment (
γ=–0.184, p<0.01), pain dura- tion (
γ=0.122, p<0.05) and pain intensity (
γ=0.116, p<0.05).
Table 1. Clinical characteristics according to source of TMD pain
Clinical parameter Group I (n=36) Group II (n=126) Group III (n=141) p-value Multiple comparison
Pain duration 21.906±21.906 16.962±16.962 21.159±21.159 0.518
Pain intensity 52.720±19.564 42.399±20.609 48.368±19.542 0.007** (I, II), (II, III)
NRS first 5.083±2.430 4.349±2.445 4.949±2.399 0.074
CMO 41.194±10.612 39.679±10.689 38.956±9.934 0.485
MMO 45.389±8.550 44.557±8.857 44.038±8.031 0.660
Capsule palpation 1.167±1.699 0.679±1.198 1.222±1.575 0.006** (II, III)
Muscle palpation, face 4.139±3.474 1.069±1.642 5.177±2.892 0.000** (I, II), (II, III) Muscle palpation, neck 1.056±1.739 0.466±1.139 2.139±2.282 0.000** (I, III) (II, III)
Pain on open 0.500±0.507 0.588±0.494 0.551±0.499 0.611
Eccentric movement pain 0.639±0.833 0.794±0.966 0.703±1.000 0.604
DJD 0.444±0.504 0.382±0.488 0.405±0.492 0.782
Pain on open 6 0.111±0.319 0.252±0.436 0.323±0.469 0.029* (I, III)
CMO 6 47.042±6.727 43.734±9.302 42.726±8.183 0.068
MMO 6 47.958±6.118 45.651±8.217 44.788±6.671 0.129
Capsule palpation 6 0.375±0.576 0.147±0.381 0.514±2.257 0.220
Muscle palpation, face 6 0.375±0.711 0.193±0.481 0.774±2.708 0.068
NRS 6 0.850±1.089 0.850±0.788 0.959±0.089 0.668
TMD, temporomandibular disorder; NRS, numeric rating scale; CMO, comfortable mouth opening; MMO, maximum mouth opening; DJD, degenerative joint disease.
Values are presented as mean±standard deviation.
Group I, muscular pain group; Group II, joint pain group; Group III, muscular and joint pain group.
NRS first, NRS score before treatment initiation; Palpation, number of capsule/muscle areas that showed a positive response on palpation;
Pain on open, whether there is pain on mouth opening (0: without pain, 1: with pain); Eccentric movement pain, Whether there is pain on eccentric movement (0: without pain, 1: with pain); Pain on open 6, whether there is pain when mouth opening after 6 months of treatment;
CMO 6, CMO following 6 months of treatment; MMO 6, MMO following 6 months of treatment; NRS 6, NRS score after 6 months of treatment.
Pain intensity scores were calculated based on answers to the research diagnostic criteria/TMD Axis II questionnaire (mean score of question
#7, 8, 9, 10).
*p<0.05, **p<0.01.
Total protein showed significant correlation with CMO (
γ=0.106, p<0.05) and number of positive muscles on pal- pation (
γ=0.126, p<0.01). WBC showed significant correla- tion with pain duration (
γ=0.12, p<0.05). RBC showed sig- nificant correlation with NRS at before treatment (
γ=–111, p<0.05), CMO (
γ=0.237, p<0.01), MMO (
γ=0.287, p<0.01), CMO at 6 months after treatment (
γ=0.306, p<0.01), MMO at 6 months after treatment (
γ=0.345, p<0.01), and pain
intensity (
γ=–0.126, p<0.05). Hemoglobin concentration showed significant correlation with CMO (
γ=0.229, p<0.01), MMO (
γ=0.276, p<0.01), CMO at 6 months after treatment (
γ=0.295, p<0.01) and MMO at 6 months after treatment (
γ=0.343, p<0.01). Significant correlation was shown be- tween haematocrit with NRS at before treatment (
γ=–0.114, p<0.05), CMO (
γ=0.247, p<0.01), MMO (
γ=0.298, p<0.01), CMO at 6 months after treatment (
γ=0.333, p<0.01) and
Table 2. Hematological characteristics according to source of temporomandibular disorder pain
Hematological parameter Group I (n=36) Group II (n=126) Group III (n=141) p-value Multiple comparison
CRP (mg/dL) 0.086±0.08 0.127±0.247 0.073±0.077 0.032* (II, III)
ESR (mm/h) 10.417±10.5 8.687±7.57 7.544±5.536 0.068
Total protein (g/dL) 7.517±0.39 7.591±0.379 7.574±0.097 0.599
White blood cell (103/μL) 6.663±1.584 6.145±1.708 5.989±1.734 0.103
Red blood cell (106/μL) 4.501±0.434 4.537±0.471 4.488±0.382 0.618
Hemoglobin (g/dL) 13.531±1.33 13.732±1.419 13.520±1.182 0.361
Hct (%) 40.197±3.381 40.544±3.502 40.037±3.037 0.420
MCV (fL) 89.536±5.234 89.637±3.705 89.309±3.705 0.815
MCH (pg) 30.111±2.00 30.305±1.889 30.173±1.468 0.746
MCHC (g/dL) 33.633±0.87 33.811±1.062 33.761±0.836 0.600
Platelet (103/μL) 251.750±46.553 250.275±54.962 252.722±61.324 0.937
PCT (%) 0.244±0.056 0.237±0.056 0.241±0.06 0.702
MPV (fL) 9.536±0.661 9.482±0.838 9.416±0.745 0.623
Absolute neutrophil count (/μL) 3,897.361±1,382 3,603.244±1,502.287 3,411.722±1,530.756 0.183
CRP, C-reactive protein; ESR, erythrocyte sedimentation rate; Hct, hematocrit; MCV, mean corpuscular volume; MCH, mean corpuscular hemoglobin; MCHC, mean corpuscular hemoglobin concentration; PCT, platelet crit; MPV, mean platelet volume.
Values are presented as mean±standard deviation.
Group I, muscular pain group; Group II, joint pain group; Group III, muscular and joint pain group.
*p<0.05.
Table 3. Hematological characteristics according to GCPS group
Hematological parameter No disability group (n=39) Low disability group (n=152) High disability group (n=166) p-value
CRP (mg/dL) 0.135±0.275 0.104±0.183 0.083±0.112 0.187
ESR (mm/h) 8.692±6.092 7.283±5.899 8.651±7.869 0.178
Total protein (g/dL) 7.623±0.367 7.524±0.422 7.587±0.386 0.235
White blood cell (103/μL) 6.436±1.161 6.119±1.721 6.085±1.759 0.515
Red blood cell (106/μL) 4.569±0.472 4.512±0.421 4.485±0.417 0.527
Hemoglobin (g/dL) 13.687±1.5 13.664±1.243 13.543±1.333 0.663
Hct (%) 40.392±3.662 40.383±3.183 40.036±3.307 0.608
MCV (fL) 88.754±6.58 89.668±3.932 89.413±4.147 0.505
MCH (pg) 30.059±2.651 30.352±1.525 30.202±1.588 0.567
MCHC (g/dL) 33.844±1.169 33.825±0.938 33.787±0.948 0.915
Platelet (103/μL) 254.79±54.676 242.901±49.795 255.355±61.295 0.121
PCT (%) 0.233±0.066 0.232±0.052 0.245±0.060 0.140
MPV (fL) 9.577±0.772 9.472±0.785 9.436±0.762 0.586
Absolute neutrophil count (/μL) 3,866.487±1,193.416 3,534.921±1,516.136 3,474.675±1,552.078 0.341 GCPS, graded chronic pain scale; CRP, C-reactive protein; ESR, erythrocyte sedimentation rate; Hct, hematocrit; MCV, mean corpuscular volume;
MCH, mean corpuscular hemoglobin; MCHC, mean corpuscular hemoglobin concentration; PCT, platelet crit; MPV, mean platelet volume.
Values are presented as mean±standard deviation.
Table 4.Relationship between hematological and TMD pain-related indices Hematological parameterNRS firstCMOMMOCapsule palpationMuscle palpationCMO 6MMO 6Capsule palpation 6Muscle palpation 6NRS 6Pain durationPain intensity CRP (mg/dL)0.055 –0.065 –0.087 –0.053 –0.072 –0.002 –0.019 –0.041 –0.043 –0.029
0.0740.047 ESR (mm/h)0.104
–0.140**
–0.216**
–0.026 –0.043 –0.133*
–0.184**
–0.035 –0.052
0.0620.122*0.116* Total protein (g/dL)
–0.030
0.106*0.0660.004
–0.126*
0.0330.0140.0310.0050.0270.069
–0.025
White blood cell (103/μL)0.006
–0.074 –0.063
0.023
–0.001
0.003
–0.031 –0.057 –0.049 –0.046
0.120*
–0.001
Red blood cell (106/μL)
–0.111*
0.237**0.287**
–0.065 –0.090
0.306**0.345**
–0.034 –0.051 –0.063
0.080
–0.126*
Hemoglobin (g/dL)
–0.074
0.229**0.276**
–0.046 –0.099
0.295**0.343**
–0.003 –0.022 –0.042 –0.011 –0.089
Hct (%)
–0.114*
0.247**0.298**
–0.036 –0.077
0.333**0.383**
–0.005 –0.015 –0.031
0.017
–0.097
MCV (fL)0.014
–0.033 –0.049
0.0620.044
–0.046 –0.039
0.0600.0760.057
–0.127*
0.077 MCH (pg)0.062
–0.003 –0.007
0.019
–0.015 –0.031 –0.019
0.0530.0540.039
–0.154**
0.060 MCHC (g/dL)0.106*0.0520.075
–0.053 –0.101
0.0300.0480.003
–0.023 –0.031 –0.083
0.003 Platelet (103 /μL)0.011
–0.107*
–0.066 –0.009
0.037
–0.047 –0.046 –0.045 –0.036
0.0040.024
–0.001
PCT (%)
–0.004 –0.053 –0.041
0.0670.0760.000
–0.028 –0.014 –0.033
0.0590.008
–0.037
MPV (fL)
–0.042
0.0090.0360.0540.0440.0180.0440.0300.0020.067
–0.026 –0.080
Absolute neutrophil count (/μL) –0.027 –0.076 –0.073
0.017
–0.008 –0.008 –0.050 –0.058 –0.052 –0.098
0.134*
–0.049
TMD, temporomandibular disorder; NRS, numeric rating scale; CMO, comfortable mouth opening; MMO, maximum mouth opening; CRP, C-reactive protein; ESR, erythrocyte sedimentation rate; Hct, hematocrit; MCV, mean corpuscular volume; MCH, mean corpuscular hemoglobin; MCHC, mean corpuscular hemoglobin concentration; PCT, platelet crit; MPV, mean platelet volume. Palpation, number of muscle that showed a positive response on palpation; CMO 6, CMO following 6 months of treatment; NRS first, numeric rating scale score before treatment initiation; the of treatment; MMO 6, MMO following 6 months of treatment. Pain intensity scores were calculated based on answers to the research diagnostic criteria/TMD Axis II questionnaire (mean score of question #7, 8, 9, 10). *p<0.05, **p<0.01.
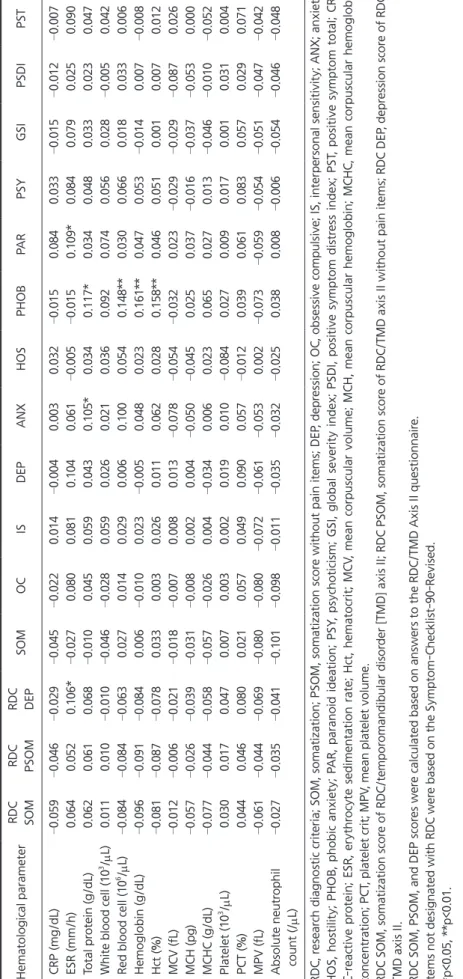
Table 5. Relationship between hematological and psychological indices Hematological parameterRDC SOMRDC PSOMRDC DEPSOMOCISDEPANXHOSPHOBPARPSYGSIPSDIPST CRP (mg/dL) –0.059 –0.046 –0.029 –0.045 –0.022
0.014
–0.004
0.0030.032
–0.015
0.0840.033
–0.015 –0.012 –0.007
ESR (mm/h)0.0640.0520.106*
–0.027
0.0800.0810.1040.061
–0.005 –0.015
0.109*0.0840.0790.0250.090 Total protein (g/dL)0.0620.0610.068
–0.010
0.0450.0590.0430.105*0.0340.117*0.0340.0480.0330.0230.047 White blood cell (103/μL)0.0110.010
–0.010 –0.046 –0.028
0.0590.0260.0210.0360.0920.0740.0560.028
–0.005
0.042 Red blood cell (106/μL)
–0.084 –0.084 –0.063
0.0270.0140.0290.0060.1000.0540.148**0.0300.0660.0180.0330.006 Hemoglo bin (g/dL)
–0.096 –0.091 –0.084
0.006
–0.010
0.023
–0.005
0.0480.0230.161**0.0470.053
–0.014
0.007
–0.008
Hct (%)
–0.081 –0.087 –0.078
0.0330.0030.0260.0110.0620.0280.158**0.0460.0510.0010.0070.012 MCV (fL)
–0.012 –0.006 –0.021 –0.018 –0.007
0.0080.013
–0.078 –0.054 –0.032
0.023
–0.029 –0.029 –0.087
0.026 MCH (pg)
–0.057 –0.026 –0.039 –0.031 –0.008
0.0020.004
–0.050 –0.045
0.0250.037
–0.016 –0.037 –0.053
0.000 MCHC (g/dL)
–0.077 –0.044 –0.058 –0.057 –0.026
0.004
–0.034
0.0060.0230.0650.0270.013
–0.046 –0.010 –0.052
Platelet (103 /μL)0.0300.0170.0470.0070.0030.0020.0190.010
–0.084
0.0270.0090.0170.0010.0310.004 PCT (%)0.0440.0460.0800.0210.0570.0490.0900.057
–0.012
0.0390.0610.0830.0570.0290.071 MPV (fL)
–0.061 –0.044 –0.069 –0.080 –0.080 –0.072 –0.061 –0.053
0.002
–0.073 –0.059 –0.054 –0.051 –0.047 –0.042
Absolute neutro phil count (/μL)
–0.027 –0.035 –0.041 –0.101 –0.098 –0.011 –0.035 –0.032 –0.025
0.0380.008
–0.006 –0.054 –0.046 –0.048
RDC, research diagnostic criteria; SOM, somatization; PSOM, somatization score without pain items; DEP, depression; OC, obsessive compulsive; IS, interpersonal sensitivity; ANX; anxiety; HOS, hostility; PHOB, phobic anxiety; PAR, paranoid ideation; PSY, psychoticism; GSI, global severity index; PSDI, positive symptom distress index; PST, positive symptom total; CRP, C-reactive protein; ESR, erythrocyte sedimentation rate; Hct, hematocrit; MCV, mean corpuscular volume; MCH, mean corpuscular hemoglobin; MCHC, mean corpuscular hemoglobin concentration; PCT, platelet crit; MPV, mean platelet volume. RDC SOM, somatization score of RDC/temporomandibular disorder [TMD] axis II; RDC PSOM, somatization score of RDC/TMD axis II without pain items; RDC DEP, depression score of RDC/ TMD axis II. RDC SOM, PSOM, and DEP scores were calculated based on answers to the RDC/TMD Axis II questionnaire. Items not designated with RDC were based on the Symptom-Checklist-90-Revised. *p<0.05, **p<0.01.
MMO at 6 months after treatment (
γ=0.383, p<0.01). MCV (
γ=–0.127, p<0.05) and MCH (
γ=–0.154, p<0.01) showed sig- nificant correlation with pain duration. MCHC showed sig- nificant correlation with NRS at before treatment (
γ=0.106, p<0.05). Platelet showed significant correlation with COM (
γ=–0.107, p<0.05). And absolute neutrophil count showed significant correlation with pain duration (
γ=0.134, p<0.01) (Table 4).
4. Relationship between Hematologic and Psychological Indices
Significant correlation was shown between ESR with de- pression score of RDC/TMD axis II (
γ=0.106, p<0.05) and paranoid ideation (
γ=0.109, p<0.05). Total protein showed significant correlation with anxiety (
γ=0.105, p<0.05) and phobic anxiety (
γ=0.117, p<0.05). RBC (
γ=0.148, p<0.01), hemoglobin (
γ=0.161, p<0.01) and hematocrit (
γ=0.158, p<0.01) showed a significant correlation with phobic anxi- ety (Table 5).
DISCUSSION
This study investigated the hematologic characteristics of TMD patients. The purpose of this study was to present the tentative diagnostic usefulness of hematologic testing in TMD diagnosis. The results of this study suggest that CRP levels in patients with TMD may be useful in predicting the source and prognosis of a patient’s pain. We found that CRP was significantly higher in the arthrogenous pain group compared to the combined pain group. There were also sig- nificant correlations between TMD pain related indices and hematological indices.
When analyzing clinical characteristics according to the source of TMD pain, pain intensity was significantly lower in the arthrogenous pain group compared to the 2 other groups. In the case of arthrogenous pain, medication and physical therapy are known to efficiently alleviate the pain in a relatively short period of time. Therefore, the duration of the pain could be shorter than in the myogenous pain group and hence the less disability days.
10)When classify- ing the patients by GCPS, pain intensity and pain on mouth opening were significantly higher in the high disabil- ity group. This is an expected result and shows that GCPS
accurately reflects the degree of TMD pain of the patient.
As a major result of this study, the CRP level was found to be significantly higher in the arthrogenous pain group compared to the combined pain group. CRP levels are known to show a rapid and distinct increase following an acute inflammatory challenge. Therefore CRP is a valuable index of systemic inflammation that is produced in the liver in response to increases in inflammatory cytokines, such as interleukin-6.
11)CRP is currently recognized as a valuable marker of active and persistent inflammation in the body.
Also many previous studies have shown that CRP can act as a biomarker of various diseases. CRP levels are known to predict cardiovascular events and are used as an indicator for its prevention.
12-14)In addition, studies have suggested that CRP can be an index of disease activity in inflamma- tory bowel syndrome,
15)rheumatoid arthritis
16)and diabetes mellitus.
17)Inflammation may exist according to the state of the TMJ in conditions, such as synovitis, capsulitis, and retrodisci- tis, depending on which structure is involved. And osteo- arthritis (OA) is also known as a state of inflammation as- sociated with destructive changes of the bone.
18)In studies on OA, CRP levels were significantly higher in OA patients than in the healthy control group,
19-21)and high CRP lev- els could predict incidents of OA.
20)However, the relation- ship between synovitis and OA is not well established yet.
22)Synovial fluid analysis results of patients with TMJ arthral- gia revealed an increase in inflammatory cytokines.
23-26)CRP has a pro-inflammatory effect, so it is understandable that the increased level of CRP may worsen pain in patients with arthralgia. Myogenous pain was traditionally considered to be related to contraction and ischemia of the masticatory muscles.
27)However recent studies tell us that myofascial pain is highly associated with psychological disorders and can be initiated and prolonged by abnormalities of the pain control system in the central nervous system.
10)In addition, the mechanism underlying the development of chronic pain is much more intricate and involves both biologic and psy- chologic factors.
28)Therefore, it could be said that myog- enous pain is affected by more various factors compared to pain that is resulting from an acute inflammation.
There are previous studies based on the analysis of TMJ
synovial fluid. However, it is difficult to aspirate a sufficient
amount of synovial fluid from the TMJ due to its small volume and the specimen is easily contaminated by blood causing distortion of the analysis results. Compared to this, blood tests are relatively simple and the analysis results are generally accurate. Therefore, the possibility applying blood tests to the diagnosis of TMD pain is feasible and merits further consideration. Especially considering the current lack of diagnostic tools that are available.
ESR is known to show low specificity but reflects an in- flammatory state. Thus, an increased ERS level means the possible existence of an inflammatory condition that is closely related to an increased pro-inflammatory cyto- kine level. Therefore, ESR levels may show a certain level of association with several TMD-related symptoms.
29)In this study, ERS level was highly correlated with various TMD pain-related indices including CMO, MMO, CMO at 6 months after treatment, MMO at 6 months after treat- ment, pain duration, and pain intensity. In the pathogen- esis of certain immune mediated inflammatory diseases, an increase in platelet derived factors and platelet activation can be observed.
30)In the results of this study, there was a significant correlation between CMO and platelet levels. All these results indicate a relationship between pain and in- flammation. In liver cirrhosis, multiple myeloma, and lym- phoma, an increase in total protein level can be observed.
Total protein is also known to be increased in chronic in- flammatory states. CMO and number of positive muscles on palpation were highly correlated with the total protein level. This fact may indirectly support the possible presence of a chronic inflammatory condition in myalgia. Increased WBC levels indicate the presence of an inflammatory con- dition. WBC is also known to be increased in psychological states, such as depression.
31)The relationship between de- pression and TMD pain has already been revealed through many previous studies.
29)In this study, there was a signifi- cant correlation between WBC level and pain duration.
Unexpectedly, as the RBC, hemoglobin, and hematocrit level increased, the pain level tended to decrease. Although study results with sickle cell disease show that high hematocrit levels affect pain, the mechanism is yet to be defined.
32)There are various studies on the hematological features of psychological disorders. Shafiee et al.
31)reported that de- pression and anxiety are associated with an increased WBC
and red cell distribution width (RDW) indicating an in- creased inflammatory state. Köhler-Forsberg et al.
33)report- ed that high CRP levels in women were associated with the symptom severity of depression. Many other studies also supported the association between CRP and depression.
34-36)This study also supports the positive correlation between depression and inflammation.
There are some limitations of this study to be considered in the interpretation of the results. First, this study did not consider gender and age in the analysis of blood samples.
Although there are no consistent data suggesting different hematologic levels studies exist that do show diversity ac- cording to gender and age, and some of the results of this study may have been affected. In addition, in the case of fe- male subjects, the menstrual cycle may have caused further inconsistencies. Second, there may be bias in the data since we could not conduct blood testing on all TMD patients visiting the clinic. However, whether the blood test was per- formed was not based on the severity of disease, age, and gender. So we believe that results were not largely affected.
Third, the number of arthrogenous pain patients was rela- tively small. It could have lowered the statistical power re- sulting in insignificant results. This study was conducted to tentatively suggest the possibility of using hematologic tests in the diagnosis of TMD. And the results indicated that the usage of CRP should be assessed through future studies with more refined study designs.
This study suggests the possibility of diagnosing TMD pain using an easy and accurate blood test. Such early dif- ferentiation of patients based on the etiology of pain could offer backgrounds to establish a cause targeting treatment plan which will result in better prognosis. Although the re- sults of this study do not provide direct evidence of the re- lationship between hematologic and clinical indices of TMD pain, the results suggest the need of future studies to verify hematologic indices that could be recognized as markers of TMD pain.
CONFLICT OF INTEREST
No potential conflict of interest relevant to this article
was reported.
REFERENCES
1. Aktürk S, Büyükavcı R. Evaluation of blood neutrophil-lympho- cyte ratio and platelet distribution width as inflammatory mark- ers in patients with fibromyalgia. Clin Rheumatol 2017;36:1885- 1889.
2. de Leeuw R, Klasser GD; American Academy of Orofacial Pain.
Orofacial pain: guidelines for assessment, diagnosis, and manage- ment. 5th ed. Chicago, IL: Quintessence Publishing; 2013. pp.127- 186.
3. Dworkin SF, Huggins KH, LeResche L, et al. Epidemiology of signs and symptoms in temporomandibular disorders: clinical signs in cases and controls. J Am Dent Assoc 1990;120:273-281.
4. Barros Vde M, Seraidarian PI, Côrtes MI, de Paula LV. The impact of orofacial pain on the quality of life of patients with temporo- mandibular disorder. J Orofac Pain 2009;23:28-37.
5. Sasidharan PK, Bindya M, Sajeeth Kumar KG. Hematological manifestations of SLE at initial presentation: is it underestimated?
ISRN Hematol 2012;2012:961872.
6. Blaes F, Schmitz K, Tschernatsch M, et al. Autoimmune etiol- ogy of complex regional pain syndrome (M. Sudeck). Neurology 2004;63:1734-1736.
7. Dworkin SF, LeResche L. Research diagnostic criteria for tem- poromandibular disorders: review, criteria, examinations and specifications, critique. J Craniomandib Disord 1992;6:301-355.
8. Von Korff M, Ormel J, Keefe FJ, Dworkin SF. Grading the severity of chronic pain. Pain 1992;50:133-149.
9. Derogatis LR, Cleary PA. Confirmation of the dimensional struc- ture of the SCL-90: a study in construct validation. J Clin Psychol 1977;33:981-989.
10. Maixner W, Fillingim R, Booker D, Sigurdsson A. Sensitivity of patients with painful temporomandibular disorders to experimen- tally evoked pain. Pain 1995;63:341-351.
11. Black S, Kushner I, Samols D. C-reactive protein. J Biol Chem 2004;279:48487-48490.
12. Ridker PM, Hennekens CH, Buring JE, Rifai N. C-reactive protein and other markers of inflammation in the prediction of cardio- vascular disease in women. N Engl J Med 2000;342:836-843.
13. Ridker PM. C-reactive protein and the prediction of cardio- vascular events among those at intermediate risk: moving an inflammatory hypothesis toward consensus. J Am Coll Cardiol 2007;49:2129-2138.
14. Ridker PM. Clinical application of C-reactive protein for car- diovascular disease detection and prevention. Circulation 2003;107:363-369.
15. Vermeire S, Van Assche G, Rutgeerts P. C-reactive protein as a marker for inflammatory bowel disease. Inflamm Bowel Dis 2004;10:661-665.
16. Gonzalez-Gay MA, Gonzalez-Juanatey C, Piñeiro A, Garcia- Porrua C, Testa A, Llorca J. High-grade C-reactive protein eleva- tion correlates with accelerated atherogenesis in patients with rheumatoid arthritis. J Rheumatol 2005;32:1219-1223.
17. Thorand B, Löwel H, Schneider A, et al. C-reactive protein as a predictor for incident diabetes mellitus among middle-aged men:
results from the MONICA Augsburg cohort study, 1984-1998.
Arch Intern Med 2003;163:93-99.
18. Okeson JP. Management of temporomandibular disorders and occlusion-E-Book. 7th ed. Edinburgh: Mosby Elsevier; 2014.
19. Lee YC, Lu B, Bathon JM, et al. Pain sensitivity and pain reactiv- ity in osteoarthritis. Arthritis Care Res (Hoboken) 2011;63:320- 327.
20. Spector TD, Hart DJ, Nandra D, et al. Low-level increases in serum C-reactive protein are present in early osteoarthritis of the knee and predict progressive disease. Arthritis Rheum 1997;40:723-727.
21. Sowers M, Jannausch M, Stein E, Jamadar D, Hochberg M, La- chance L. C-reactive protein as a biomarker of emergent osteoar- thritis. Osteoarthritis Cartilage 2002;10:595-601.
22. Bonnet CS, Walsh DA. Osteoarthritis, angiogenesis and inflam- mation. Rheumatology (Oxford) 2005;44:7-16.
23. Kubota E, Kubota T, Matsumoto J, Shibata T, Murakami K. Syno- vial fluid cytokines and proteinases as markers of temporoman- dibular joint disease. J Oral Maxillofac Surg 1998;56:192-198.
24. Kubota E, Imamura H, Kubota T, Shibata T, Murakami K. Inter- leukin 1 beta and stromelysin (MMP3) activity of synovial fluid as possible markers of osteoarthritis in the temporomandibular joint. J Oral Maxillofac Surg 1997;55:20-27; discussion 27-28.
25. Takahashi T, Nagai H, Seki H, Fukuda M. Relationship between joint effusion, joint pain, and protein levels in joint lavage fluid of patients with internal derangement and osteoarthritis of the temporomandibular joint. J Oral Maxillofac Surg 1999;57:1187- 1193; discussion 1193-1194.
26. Emshoff R, Puffer P, Rudisch A, Gassner R. Temporomandibular joint pain: relationship to internal derangement type, osteo- arthrosis, and synovial fluid mediator level of tumor necrosis factor-alpha. Oral Surg Oral Med Oral Pathol Oral Radiol Endod 2000;90:442-449.
27. List T, Jensen RH. Temporomandibular disorders: old ideas and new concepts. Cephalalgia 2017;37:692-704.
28. Schmidt BL, Milam SB, Caloss R. Future directions for pain re- search in oral and maxillofacial surgery: findings of the 2005 AAOMS Research Summit. J Oral Maxillofac Surg 2005;63:1410- 1417.
29. Tanaka E, Detamore MS, Mercuri LG. Degenerative disorders of the temporomandibular joint: etiology, diagnosis, and treatment.
J Dent Res 2008;87:296-307.
30. Pankratz S, Bittner S, Kehrel BE, et al. The inflammatory role of platelets: translational insights from experimental studies of au- toimmune disorders. Int J Mol Sci 2016;17:E1723.
31. Shafiee M, Tayefi M, Hassanian SM, et al. Depression and anxiety symptoms are associated with white blood cell count and red cell distribution width: a sex-stratified analysis in a population-based study. Psychoneuroendocrinology 2017;84:101-108.
32. Platt OS, Thorington BD, Brambilla DJ, et al. Pain in sickle cell disease. Rates and risk factors. N Engl J Med 1991;325:11-16.
33. Köhler-Forsberg O, Buttenschøn HN, Tansey KE, et al. Associa- tion between C-reactive protein (CRP) with depression symptom severity and specific depressive symptoms in major depression.
Brain Behav Immun 2017;62:344-350.
34. Howren MB, Lamkin DM, Suls J. Associations of depression with C-reactive protein, IL-1, and IL-6: a meta-analysis. Psychosom Med 2009;71:171-186.
35. Khandaker GM, Pearson RM, Zammit S, Lewis G, Jones PB. Asso- ciation of serum interleukin 6 and C-reactive protein in childhood with depression and psychosis in young adult life: a population-
based longitudinal study. JAMA Psychiatry 2014;71:1121-1128.
36. Tayefi M, Shafiee M, Kazemi-Bajestani SMR, et al. Depression and anxiety both associate with serum level of hs-CRP: a gender- stratified analysis in a population-based study. Psychoneuroen- docrinology 2017;81:63-69.