© 2019 The Korean Ophthalmological Society
This is an Open Access article distributed under the terms of the Creative Commons Attribution Non-Commercial License (http://creativecommons.org/licenses /by-nc/3.0/) which permits unrestricted non-commercial use, distribution, and reproduction in any medium, provided the original work is properly cited.
Original Article
Association between Three Heavy Metals and Dry Eye Disease in Korean Adults: Results of the Korean National Health and Nutrition
Examination Survey
Sang Joon Jung, Si Hyung Lee
Department of Ophthalmology, Soonchunhyang University Bucheon Hospital, Soonchunhyang University College of Medicine, Bucheon, Korea
Purpose: To investigate the associations between blood heavy metal concentrations and dry eye disease using a Korean population-based survey.
Methods: This study included 23,376 participants >40 years of age who participated in the Korean National Health and Nutrition Examination Survey from 2010 to 2012. Blood concentrations of lead, cadmium, and mer- cury were measured in all participants. The associations between blood heavy metal concentrations and dry eye disease were assessed using multivariate logistic regression analyses.
Results: After adjusting for potential confounders, including age, sex, lifestyle behaviors and sociodemographic factors, the analyses revealed an increased odds ratio (OR) for dry eye disease with higher blood mercury concentrations (tertile 2: OR, 1.22; 95% confidence interval [CI], 0.91 to 1.64; tertile 3: OR, 1.39; 95% CI, 1.02 to 1.89; p = 0.039). The prevalence of dry eye disease was not associated with blood lead (tertile 2: OR, 1.15;
95% CI, 0.87 to 1.51; tertile 3: OR, 0.83; 95% CI, 0.59 to 1.16; p = 0.283) or cadmium (tertile 2: OR, 1.05; 95%
CI, 0.77 to 1.44; tertile 3: OR, 1.15; 95% CI, 0.84 to 1.58; p = 0.389) concentrations. There were no significant associations between any of the three heavy metals and dry eye disease in males after adjusting for potential confounding factors, but blood mercury concentrations in females were associated with dry eye disease (tertile 2: OR, 1.18; 95% CI, 0.83 to 1.69; tertile 3: OR, 1.58; 95% CI, 1.12 to 2.24; p = 0.009).
Conclusions:Mercury concentrations in blood were associated with dry eye disease. Our results suggest- ed that controlling environmental exposure to mercury may be necessary to reduce the incidence of dry eye disease.
Key Words: Dry eye syndromes, Heavy metals, Mercury, Republic of Korea
Dry eye disease is a multifactorial disease of the ocular surface characterized by a loss of homeostasis of the tear
film. Affected patients typically present with tear film in- stability and hyperosmolarity, ocular surface inflammation and damage, and neurosensory abnormalities [1]. There are various risk factors for dry eye disease including older age, female sex, lifestyle factors, lower socioeconomic status, and previous ocular surgery (including cataract and refrac- tive surgeries) [1]. However, because of the multiple mecha- nisms involved in the pathogenesis of dry eye disease,
Received: June 13, 2018 Accepted: August 23, 2018
Corresponding Author: Si Hyung Lee, MD. Department of Ophthal- mology, Soonchunhyang University Bucheon Hospital, Soonchunhyang University College of Medicine, 170 Jomaru-ro, Bucheon 14584, Korea.
Tel: 82-32-621-6719, Fax: 82-32-621-5018, E-mail: [email protected]
many additional risk factors likely remain to be elucidated.
Heavy metals are metallic elements that have a relatively high density compared to water [2]. Sources of heavy met- als in the environment include geogenic, industrial, agri- cultural, pharmaceutical, and atmospheric sources, as well as domestic effluents [3]. As a result of the increased use of heavy metals in industrial, agricultural, domestic, and technological applications, the likelihood of being exposed to these materials has risen dramatically [4]. Among the many types of heavy metals, arsenic, cadmium, chromi- um, lead, and mercury have the greatest toxicity. These heavy metals are known to induce damage to multiple or- gans, even at low levels of exposure [5]. Several studies ad- dressing the associations between heavy metals and ocular diseases have been published, but there have been few in- vestigations of the association between dry eye disease and heavy metal exposure [6,7]. It is therefore necessary to clarify the associations between heavy metals and dry eye disease. We investigated possible associations between three toxic heavy metals—lead, cadmium, and mercury—
and dry eye disease using a large, nationally representative population-based cohort for the Republic of Korea. Addi- tionally, because the prevalence of dry eye disease differs by sex, we also examined the associations between heavy metal exposure and dry eye disease according to sex.
Materials and Methods
Study population
This study was conducted using data from a cross-sec- tional analysis of the fifth (2010–2012) Korean National Health and Nutrition Examination Survey (KNHANES) completed by the Korea Centers for Disease Control and Prevention. The KNHANES provides data on national health insurance status, health behaviors, and nutritional status for the non-institutionalized civilian population of the Republic of Korea using multistage, stratified, proba- bility-clustered sampling methods [8,9].
Among 23,376 participants from the 2010–2012 KN- HANES who underwent an ophthalmic examination, we excluded those aged below 40 years, and those for whom dry eye symptoms, heavy metal exposure, and/or eye sur- gery history data were missing. The final study population comprised 2,811 participants. This study was approved by
the institutional review board of the Soonchunhyang Uni- versity Bucheon Hospital (2018-06-021) and written in- formed consent was obtained from all the KNHANES par- ticipants by the Korea Centers for Disease Control and Prevention and all data are publicly available.
Heavy metal concentrations
Blood concentrations of lead and cadmium were mea- sured using graphite furnace atomic absorption spectrom- etry (AAnalyst600; Perkin-Elmer, Turku, Finland), and mercury concentrations were measured using the gold amalgamation method (DMA-80; Milestone, Sorisole, Ita- ly). Blood samples were collected and stored in trace ele- ment ethylenediaminetetraacetic acid tubes (Becton Dick- inson, Franklin Lakes, NJ, USA) for heavy metal assays.
The detection limits were 0.223, 0.087, and 0.05 μg/L for lead, cadmium, and mercury, respectively. The concentra- tions of all samples were greater than the detection limits.
All blood analyses were carried out by the Seoul Medical Science Institute, which is certified by the Korean Minis- try of Health and Welfare. Internal and external quality control procedures for this institute were described in a previous study [7].
Definition of dry eye symptoms
Since July 2008, the Korean Ophthalmological Society has participated in the KNHANES by performing oph- thalmic interviews and examinations of study participants.
Participants were considered to have dry eye disease if they responded positively to questions addressing symp- toms such as persistent dryness or eye irritation. If the par- ticipant stated that they only had these symptoms “some- times” or “occasionally”, they were classified as not having dry eye disease.
Other variables
Demographic variables included age, sex, area of resi- dence, occupation, income, and education level. These were obtained from health interviews. Age was classified as 40 to 49, 50 to 59, or ≥60 years. Education status was di- vided into two groups: middle school or lower, and high school or higher. Family income was split into upper and lower 50% groups. The other covariates were health-relat-
ed behaviors (smoking status, alcohol consumption, and body mass index [BMI]), history of ophthalmic surgery, and family history of ophthalmic disease. Smoking status was categorized as non-smoker, ex-smoker, or current smoker. Alcohol consumption was categorized as none, occasional (<2 drinks/wk) or frequent (≥2 drinks/wk). BMI was classified as <18.5, 18.5 to 24.9, or ≥25 kg/m2.
Statistical analyses
Given the complex sampling design, all statistical analy- ses were performed using SAS ver. 9.4 (SAS Institute, Cary, NC, USA), and the results yielded nationally repre- sentative estimates of the prevalence of dry eye disease.
The PROC SURVEY procedure was used for all analyses.
To investigate the prevalence of dry eye disease according to participant characteristics, the Rao-Scott chi-square test was used. Blood concentrations of lead, mercury, and cad- mium were log-transformed, and then geometric means and proportional changes were compared by analysis of covariance after adjusting for age group, sex, region of residence, occupation, education level, smoking status, drinking status, family income, family history of ophthal- mic disease, and history of ophthalmic surgery. Multivari- ate logistic regression analyses were conducted to assess the associations between dry eye disease and blood heavy metal concentrations. For the logistic regression analyses, Four models were established: model 1 used simple logistic regression; model 2 adjusted for age group and sex; model 3 adjusted for model 2 and lifestyle behaviors (smoking status, drinking status, and region of residence); and model 4 adjusted for model 3 and sociodemographic factors (edu- cational level, occupation, family income, family history of ophthalmic disease, and history of ophthalmic surgery).
Odds ratios (ORs) and 95% confidence intervals (CIs) for the prevalence of dry eye disease were determined. All p-values of less than 0.05 were considered to indicate sta- tistical significance.
Results
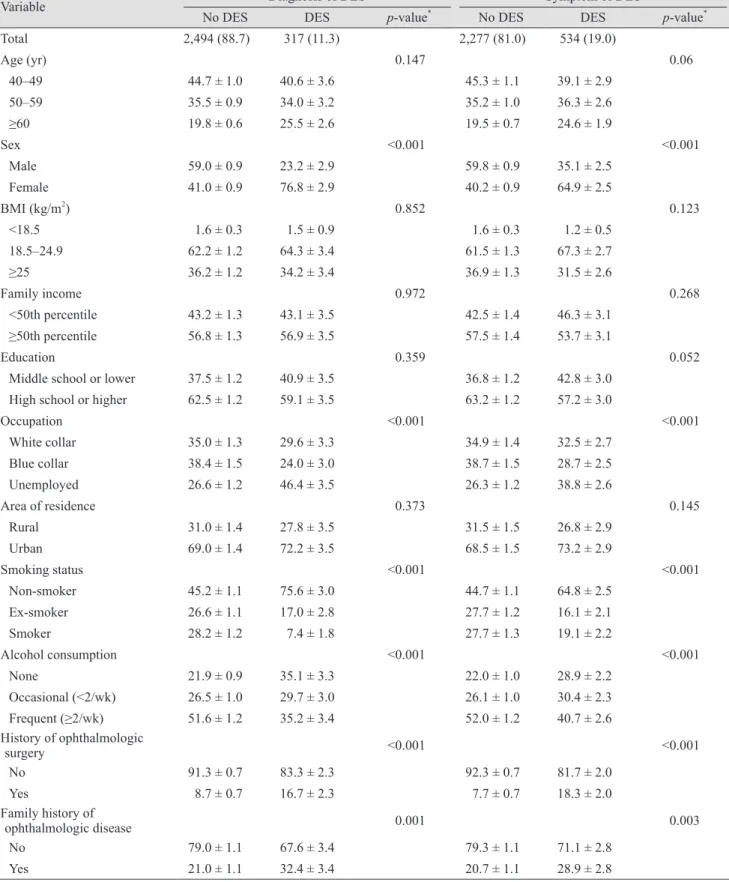
Table 1 presents the associations between the prevalence of dry eye disease and the demographic characteristics of our study population. Of the 2,811 participants, 534 had symptoms of dry eye disease and 2,277 had no symptoms,
while 317 participants were diagnosed with dry eye disease and 2,494 were not. Signs and symptoms of dry eye dis- ease were significantly more prevalent in females than in males (p < 0.001), while family income, educational level, and area of residence did not differ according to the pres- ence of dry eye disease. Regarding occupation, unem- ployed participants were more likely to suffer from dry eye disease than white or blue collar workers (p < 0.001).
Contrary to the findings of many other reports, the preva- lence of dry eye disease was greater in non-smokers than in smokers or ex-smokers (p < 0.001), in non-drinkers than alcohol drinkers (p < 0.001), and in participants with a his- tory of ophthalmic surgery (p < 0.001) or family history of ophthalmic disease (p = 0.001).
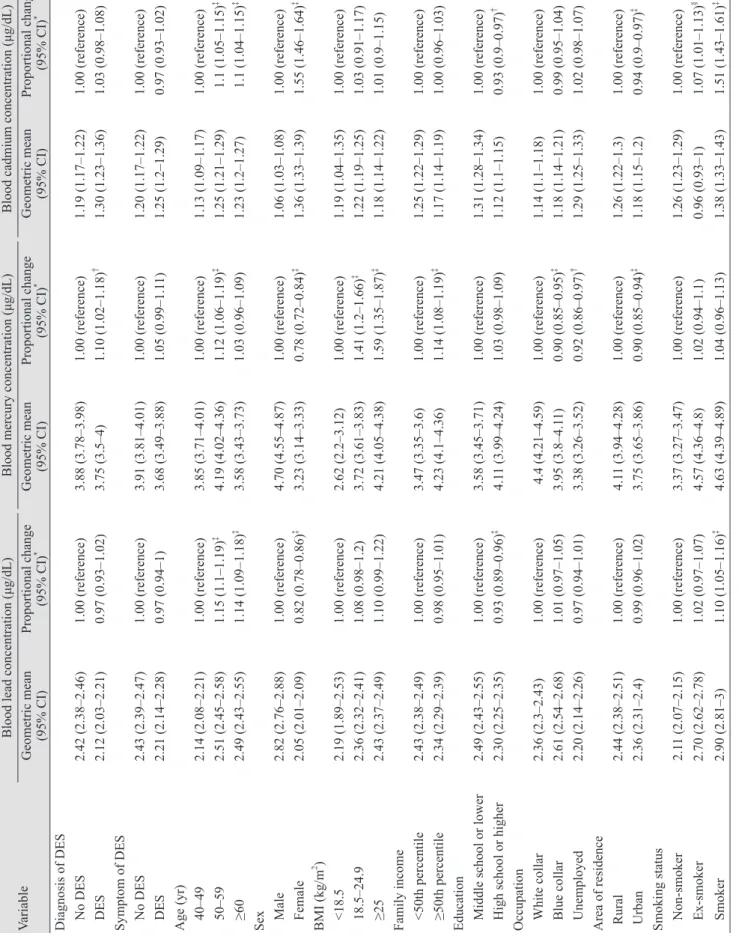
Table 2 presents the associations between blood concen- trations of heavy metals and demographic factors. Blood lead concentrations were greater in the older, smoking and frequent alcohol consumption groups compared to the younger, non-smoking and non-drinking groups, respec- tively (p < 0.001). Blood lead concentrations were lower in more educated participants and in females. Blood mercury concentrations were greater in the high BMI group, and in the dry eye disease, high family income, and frequent al- cohol consumption groups (p < 0.001), and were lower in females, blue collar or unemployed workers, and those liv- ing in urban areas (p < 0.001). Blood cadmium concentra- tions were significantly greater in the 50- to 59-year-old age group compared to the <50 age group, and in females versus males (p < 0.001). In addition, the cadmium blood concentration was greater in smokers, those with a lower education level, and those living in rural areas (p < 0.001).
Table 3 presents the associations between blood heavy metal concentrations and dry eye disease. Multivariate lo- gistic regression analyses were used to calculate ORs by dividing heavy metal concentrations into tertiles. After adjusting for age and sex, lifestyle behaviors (smoking sta- tus, alcohol consumption, and region of residence), and so- ciodemographic factors (education level, occupation, fami- ly income, family history of ophthalmic disease, and history of ophthalmic surgery), the prevalence of dry eye disease was not significantly associated with blood lead (tertile 2: OR, 1.15; 95% CI, 0.87 to 1.51; tertile 3: OR, 0.83;
95% CI, 0.59 to 1.16; p = 0.283) or cadmium (tertile 2: OR, 1.05; 95% CI, 0.77 to 1.44; tertile 3: OR, 1.15; 95% CI, 0.84 to 1.58; p = 0.389) concentrations. Furthermore, blood mer- cury concentrations were directly proportional to the prev-
Table 1. Demographic characteristics of DES
Variable Diagnosis of DES Symptom of DES
No DES DES p-value* No DES DES p-value*
Total 2,494 (88.7) 317 (11.3) 2,277 (81.0) 534 (19.0)
Age (yr) 0.147 0.06
40–49 44.7 ± 1.0 40.6 ± 3.6 45.3 ± 1.1 39.1 ± 2.9
50–59 35.5 ± 0.9 34.0 ± 3.2 35.2 ± 1.0 36.3 ± 2.6
≥60 19.8 ± 0.6 25.5 ± 2.6 19.5 ± 0.7 24.6 ± 1.9
Sex <0.001 <0.001
Male 59.0 ± 0.9 23.2 ± 2.9 59.8 ± 0.9 35.1 ± 2.5
Female 41.0 ± 0.9 76.8 ± 2.9 40.2 ± 0.9 64.9 ± 2.5
BMI (kg/m2) 0.852 0.123
<18.5 1.6 ± 0.3 1.5 ± 0.9 1.6 ± 0.3 1.2 ± 0.5
18.5–24.9 62.2 ± 1.2 64.3 ± 3.4 61.5 ± 1.3 67.3 ± 2.7
≥25 36.2 ± 1.2 34.2 ± 3.4 36.9 ± 1.3 31.5 ± 2.6
Family income 0.972 0.268
<50th percentile 43.2 ± 1.3 43.1 ± 3.5 42.5 ± 1.4 46.3 ± 3.1
≥50th percentile 56.8 ± 1.3 56.9 ± 3.5 57.5 ± 1.4 53.7 ± 3.1
Education 0.359 0.052
Middle school or lower 37.5 ± 1.2 40.9 ± 3.5 36.8 ± 1.2 42.8 ± 3.0
High school or higher 62.5 ± 1.2 59.1 ± 3.5 63.2 ± 1.2 57.2 ± 3.0
Occupation <0.001 <0.001
White collar 35.0 ± 1.3 29.6 ± 3.3 34.9 ± 1.4 32.5 ± 2.7
Blue collar 38.4 ± 1.5 24.0 ± 3.0 38.7 ± 1.5 28.7 ± 2.5
Unemployed 26.6 ± 1.2 46.4 ± 3.5 26.3 ± 1.2 38.8 ± 2.6
Area of residence 0.373 0.145
Rural 31.0 ± 1.4 27.8 ± 3.5 31.5 ± 1.5 26.8 ± 2.9
Urban 69.0 ± 1.4 72.2 ± 3.5 68.5 ± 1.5 73.2 ± 2.9
Smoking status <0.001 <0.001
Non-smoker 45.2 ± 1.1 75.6 ± 3.0 44.7 ± 1.1 64.8 ± 2.5
Ex-smoker 26.6 ± 1.1 17.0 ± 2.8 27.7 ± 1.2 16.1 ± 2.1
Smoker 28.2 ± 1.2 7.4 ± 1.8 27.7 ± 1.3 19.1 ± 2.2
Alcohol consumption <0.001 <0.001
None 21.9 ± 0.9 35.1 ± 3.3 22.0 ± 1.0 28.9 ± 2.2
Occasional (<2/wk) 26.5 ± 1.0 29.7 ± 3.0 26.1 ± 1.0 30.4 ± 2.3
Frequent (≥2/wk) 51.6 ± 1.2 35.2 ± 3.4 52.0 ± 1.2 40.7 ± 2.6
History of ophthalmologic
surgery <0.001 <0.001
No 91.3 ± 0.7 83.3 ± 2.3 92.3 ± 0.7 81.7 ± 2.0
Yes 8.7 ± 0.7 16.7 ± 2.3 7.7 ± 0.7 18.3 ± 2.0
Family history of
ophthalmologic disease 0.001 0.003
No 79.0 ± 1.1 67.6 ± 3.4 79.3 ± 1.1 71.1 ± 2.8
Yes 21.0 ± 1.1 32.4 ± 3.4 20.7 ± 1.1 28.9 ± 2.8
Values are presented as number (%) or weighted percentage ± standard error.
DES = dry eye syndrome; BMI = body mass index.
*The p-values were calculated by Rao-Scott Chi-square test.
Table 2. Distribution of blood heavy metal concentrations according to demographic characteristics VariableBlood lead concentration (μg/dL)Blood mercury concentration (μg/dL)Blood cadmium concentration (μg/dL) Geometric mean (95% CI)Proportional change (95% CI)*Geometric mean (95% CI)Proportional change (95% CI)*Geometric mean (95% CI)Proportional change (95% CI)* Diagnosis of DES No DES2.42 (2.38–2.46)1.00 (reference)3.88 (3.78–3.98)1.00 (reference)1.19 (1.17–1.22)1.00 (reference) DES2.12 (2.03–2.21)0.97 (0.93–1.02)3.75 (3.5–4)1.10 (1.02–1.18)† 1.30 (1.23–1.36)1.03 (0.98–1.08) Symptom of DES No DES2.43 (2.39–2.47)1.00 (reference)3.91 (3.81–4.01)1.00 (reference)1.20 (1.17–1.22)1.00 (reference) DES2.21 (2.14–2.28)0.97 (0.94–1)3.68 (3.49–3.88)1.05 (0.99–1.11)1.25 (1.2–1.29)0.97 (0.93–1.02) Age (yr) 40–492.14 (2.08–2.21)1.00 (reference)3.85 (3.71–4.01)1.00 (reference)1.13 (1.09–1.17)1.00 (reference) 50–592.51 (2.45–2.58)1.15 (1.1–1.19)‡ 4.19 (4.02–4.36)1.12 (1.06–1.19)‡ 1.25 (1.21–1.29)1.1 (1.05–1.15)‡ ≥602.49 (2.43–2.55)1.14 (1.09–1.18)‡ 3.58 (3.43–3.73)1.03 (0.96–1.09)1.23 (1.2–1.27)1.1 (1.04–1.15)‡ Sex Male2.82 (2.76–2.88)1.00 (reference)4.70 (4.55–4.87)1.00 (reference)1.06 (1.03–1.08)1.00 (reference) Female2.05 (2.01–2.09)0.82 (0.78–0.86)‡ 3.23 (3.14–3.33)0.78 (0.72–0.84)‡ 1.36 (1.33–1.39)1.55 (1.46–1.64)‡ BMI (kg/m2 ) <18.52.19 (1.89–2.53)1.00 (reference)2.62 (2.2–3.12)1.00 (reference)1.19 (1.04–1.35)1.00 (reference) 18.5–24.92.36 (2.32–2.41)1.08 (0.98–1.2)3.72 (3.61–3.83)1.41 (1.2–1.66)‡ 1.22 (1.19–1.25)1.03 (0.91–1.17) ≥252.43 (2.37–2.49)1.10 (0.99–1.22)4.21 (4.05–4.38)1.59 (1.35–1.87)‡ 1.18 (1.14–1.22)1.01 (0.9–1.15) Family income <50th percentile2.43 (2.38–2.49)1.00 (reference)3.47 (3.35–3.6)1.00 (reference)1.25 (1.22–1.29)1.00 (reference) ≥50th percentile2.34 (2.29–2.39)0.98 (0.95–1.01)4.23 (4.1–4.36)1.14 (1.08–1.19)‡ 1.17 (1.14–1.19)1.00 (0.96–1.03) Education Middle school or lower2.49 (2.43–2.55)1.00 (reference)3.58 (3.45–3.71)1.00 (reference)1.31 (1.28–1.34)1.00 (reference) High school or higher2.30 (2.25–2.35)0.93 (0.89–0.96)‡ 4.11 (3.99–4.24)1.03 (0.98–1.09)1.12 (1.1–1.15)0.93 (0.9–0.97)† Occupation White collar2.36 (2.3–2.43)1.00 (reference)4.4 (4.21–4.59)1.00 (reference)1.14 (1.1–1.18)1.00 (reference) Blue collar2.61 (2.54–2.68)1.01 (0.97–1.05)3.95 (3.8–4.11)0.90 (0.85–0.95)‡ 1.18 (1.14–1.21)0.99 (0.95–1.04) Unemployed2.20 (2.14–2.26)0.97 (0.94–1.01)3.38 (3.26–3.52)0.92 (0.86–0.97)† 1.29 (1.25–1.33)1.02 (0.98–1.07) Area of residence Rural2.44 (2.38–2.51)1.00 (reference)4.11 (3.94–4.28)1.00 (reference)1.26 (1.22–1.3)1.00 (reference) Urban2.36 (2.31–2.4)0.99 (0.96–1.02)3.75 (3.65–3.86)0.90 (0.85–0.94)‡ 1.18 (1.15–1.2)0.94 (0.9–0.97)‡ Smoking status Non-smoker2.11 (2.07–2.15)1.00 (reference)3.37 (3.27–3.47)1.00 (reference)1.26 (1.23–1.29)1.00 (reference) Ex-smoker2.70 (2.62–2.78)1.02 (0.97–1.07)4.57 (4.36–4.8)1.02 (0.94–1.1)0.96 (0.93–1)1.07 (1.01–1.13)§ Smoker2.90 (2.81–3)1.10 (1.05–1.16)‡ 4.63 (4.39–4.89)1.04 (0.96–1.13)1.38 (1.33–1.43)1.51 (1.43–1.61)‡ (Continuing)
alence of dry eye disease (tertile 2: OR, 1.22; 95% CI, 0.91 to 1.64; tertile 3: OR, 1.39; 95% CI, 1.02 to 1.89; p = 0.039).
Table 4 presents the associations between blood heavy metal concentrations and dry eye disease according to sex.
None of the three heavy metals were associated with dry eye disease in males after adjusting for potential con- founding factors. In females, there was a positive associa- tion between the blood mercury levels and dry eye disease in adjusted model 4 (male; tertile 2: OR, 1.43; 95% CI, 0.74 to 2.82; tertile 3: OR, 1.71; 95% CI, 0.9 to 3.35; p = 0.107;
female; tertile 2: OR, 1.18; 95% CI, 0.83 to 1.69; tertile 3:
OR, 1.58; 95% CI, 1.12 to 2.24; p = 0.009).
Discussion
We investigated the associations between dry eye disease and heavy metal concentrations in blood using a large, na- tionally representative population-based database for the Republic of Korea. There were no associations between blood lead or cadmium concentrations and dry eye disease.
Mercury was the only heavy metal found to be significant- ly associated with dry eye disease, and subgroup analyses revealed that this association only applied to females.
Mercury is a ubiquitous environmental toxicant and pol- lutant that induces severe changes in body tissues and causes numerous adverse health effects [10]. In animal studies, ionic mercury has been found in the vitreous hu- mor, and is transported to the retinal pigment epithelium where it accumulates in the plexiform layer and ganglion cells [11-13]. Reduced color vision and visual acuity have been reported in mercury-exposed populations [14]. The duration of exposure and amount of methylmercury in- gested may influence the severity of the visual disturbance [15]. In a previous study investigating the relationships be- tween mercury and dry eye symptoms based on the KN- HANES data, Chung and Myong [7] noted an association between dry eye symptoms and blood mercury concentra- tions. These findings are consistent with the results of our study, with both studies showing a positive association be- tween blood levels of mercury and dry eye disease in the Korean population; however, in our study we analyzed the associations between blood concentrations of toxic heavy metals and actual diagnoses of dry eye disease rather than dry eye symptoms, which yielded more accurate results.
There are several hypothetical mechanisms by which
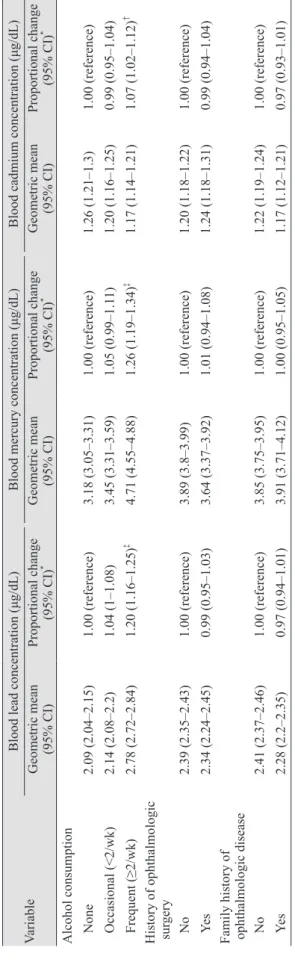
VariableBlood lead concentration (μg/dL)Blood mercury concentration (μg/dL)Blood cadmium concentration (μg/dL) Geometric mean (95% CI)Proportional change (95% CI)*Geometric mean (95% CI)Proportional change (95% CI)*Geometric mean (95% CI)Proportional change (95% CI)* Alcohol consumption None2.09 (2.04–2.15)1.00 (reference)3.18 (3.05–3.31)1.00 (reference)1.26 (1.21–1.3)1.00 (reference) Occasional (<2/wk)2.14 (2.08–2.2)1.04 (1–1.08)3.45 (3.31–3.59)1.05 (0.99–1.11)1.20 (1.16–1.25)0.99 (0.95–1.04) Frequent (≥2/wk)2.78 (2.72–2.84)1.20 (1.16–1.25)‡ 4.71 (4.55–4.88)1.26 (1.19–1.34)‡ 1.17 (1.14–1.21)1.07 (1.02–1.12)†
History of ophthalmologic sur
gery No2.39 (2.35–2.43)1.00 (reference)3.89 (3.8–3.99)1.00 (reference)1.20 (1.18–1.22)1.00 (reference) Yes2.34 (2.24–2.45)0.99 (0.95–1.03)3.64 (3.37–3.92)1.01 (0.94–1.08)1.24 (1.18–1.31)0.99 (0.94–1.04)
Family history of ophthalmologic disease No2.41 (2.37–2.46)1.00 (reference)3.85 (3.75–3.95)1.00 (reference)1.22 (1.19–1.24)1.00 (reference) Yes2.28 (2.2–2.35)0.97 (0.94–1.01)3.91 (3.71–4.12)1.00 (0.95–1.05)1.17 (1.12–1.21)0.97 (0.93–1.01) CI = confidence interval; DES = dry eye syndrome; BMI = body mass index. *†‡§ The exponential β-coefficient from multiple log-linear regression including all covariates in the table;p < 0.01; p < 0.001;p < 0.05.
Table 2. Continued
mercury may cause dry eye symptoms. The first hypothe- sis is that neurotoxicity induced by methylmercury expo- sure may affect the lacrimal glands. The main lacrimal glands are innervated by both parasympathetic and sym- pathetic nerves [16,17]. Stimulation of the parasympathetic and sympathetic nerves induces release of neurotransmit- ters that activate secretion of water and electrolytes from the lacrimal gland [18]. The possibility that neurotoxicity secondary to mercury exposure may influence the devel- opment of dry eye disease was first identified in a study that showed mercury vapor may damage the sympathetic nervous system. We speculate that if the autonomic ner- vous system is damaged by mercury, secretions from the glands may decrease, resulting in dry eye disease [19]. The second hypothetical mechanism is that acceleration of free radical reactions as a result of mercury exposure may cause dry eye disease. This theory may be supported by a previous study that showed that methylmercury exposure induces conjunctival inflammation through increased for- mation of reactive radicals and acceleration of free radical reactions [20,21]. The inflammation at the ocular surface promotes epithelial disease and eventually results in dry
eye symptoms [22]. Finally, tear film hyperosmolarity may explain the association between blood mercury concentra- tions and dry eye disease. Tear film hyperosmolarity has been identified as one of the main mechanisms underlying dry eye disease. A positive association between plasma os- molarity and tear osmolarity has been reported, and both are increased in patients with dry eye disease or systemic dehydration [23-25]. Given previous animal studies have shown that mercury toxicity may increase serum osmolar- ity, increased blood mercury concentration may alter se- rum osmolarity, leading to increased tear hyperosmolarity and dry eye disease [26-28].
Previous studies showed that cadmium and lead toxicity can cause various ocular conditions. These two toxic heavy metals have been found in all of the pigmented ocular tis- sues, and accumulate in other ocular tissues, especially in the retinal pigment epithelium and choroid [29], where they could induce oxidative stress by producing reactive oxygen species [30]. Because oxidative stress is thought to play an important role in age-related macular degeneration [31], cadmium and lead ions have also been implicated in this disorder [32]. In another report, blood cadmium con- Table 3. OR (95% CI) for diagnosis of dry eye syndrome according to the blood heavy metal concentrations in Korean adults over 40-aged
Blood heavy metal concentrations n Model 1*
OR (95% CI) Model 2†
OR (95% CI) Model 3‡
OR (95% CI) Model 4§ OR (95% CI) Blood lead (μg/dL)
Tertile 1 (<2.031) 928 1 (reference) 1 (reference) 1 (reference) 1 (reference) Tertile 2 (2.031–2.822) 927 0.9 (0.68–1.17) 1.09 (0.82–1.43) 1.12 (0.85–1.48) 1.15 (0.87–1.51) Tertile 3 (≥2.824) 956 0.48 (0.35–0.65)ǁ 0.75 (0.54–1.03) 0.79 (0.56–1.1) 0.83 (0.59–1.16)
p-value for trend <0.001 0.082 0.162 0.283
Blood mercury (μg/dL)
Tertile 1 (<2.85) 928 1 (reference) 1 (reference) 1 (reference) 1 (reference) Tertile 2 (2.85–4.916) 928 0.97 (0.73–1.29) 1.24 (0.93–1.66) 1.27 (0.95–1.7) 1.22 (0.91–1.64) Tertile 3 (≥4.919) 955 0.87 (0.65–1.16) 1.37 (1.01–1.85)# 1.44 (1.06–1.96)# 1.39 (1.02–1.89)#
p-value for trend 0.341 0.041 0.019 0.039
Blood cadmium (μg/dL)
Tertile 1 (<1.004) 930 1 (reference) 1 (reference) 1 (reference) 1 (reference) Tertile 2 (1.004–1.466) 925 1.33 (0.99–1.8) 1 (0.73–1.37) 1.05 (0.77–1.44) 1.05 (0.77–1.44) Tertile 3 (≥1.467) 956 1.51 (1.13–2.04)** 1.03 (0.76–1.4) 1.14 (0.83–1.57) 1.15 (0.84–1.58)
p-value for trend 0.005 0.850 0.418 0.389
OR = odds ratio; CI = confidence interval.
*Model 1: crude model; †Model 2: adjusted for age and sex; ‡Model 3: model 2 + lifestyle behaviors (smoking status, alcohol drinking, and living region); §Model 4: model 3 + sociodemographic factors (education, occupation, family income, family history of ophthalmologic disease, and history of ophthalmologic surgery); ǁp < 0.001; #p < 0.05; **p < 0.01.
centrations were positively associated with the prevalence of open-angle glaucoma in teenagers [6]. Although our study did not find any positive associations between dry eye disease and blood cadmium or lead concentrations,
possible associations between oxidative stress caused by excessive free radicals from toxic heavy metals (including lead and cadmium) and dry eye disease have been suggest- ed previously [33]. The potential ocular toxicity of these Table 4. OR (95% CI) for diagnosis of dry eye syndrome according to the level of blood heavy metal concentration in Korean adults over 40-aged
Variable n Model 1*
OR (95% CI) Model 2†
OR (95% CI) Model 3‡
OR (95% CI) Model 4§
OR (95% CI) Males
Blood lead (μg/dL)
Tertile 1 (<2.458) 441 1 (reference) 1 (reference) 1 (reference) 1 (reference) Tertile 2 (2.458–3.207) 440 0.67 (0.36–1.2) 0.65 (0.35–1.17) 0.63 (0.34–1.16) 0.65 (0.35–1.2) Tertile 3 (≥3.208) 452 0.68 (0.37–1.23) 0.64 (0.35–1.16) 0.63 (0.34–1.16) 0.68 (0.36–1.26)
p-value for trend 0.205 0.147 0.139 0.223
Blood mercury (μg/dL)
Tertile 1 (<3.537) 440 1 (reference) 1 (reference) 1 (reference) 1 (reference) Tertile 2 (3.537–5.966) 440 1.31 (0.69–2.54) 1.46 (0.76–2.85) 1.45 (0.75–2.84) 1.43 (0.74–2.82) Tertile 3 (≥5.985) 453 1.64 (0.89–3.1) 1.8 (0.98–3.44) 1.79 (0.96–3.46) 1.71 (0.9–3.35)
p-value for trend 0.117 0.064 0.073 0.107
Blood cadmium (μg/dL)
Tertile 1 (<0.858) 440 1 (reference) 1 (reference) 1 (reference) 1 (reference) Tertile 2 (0.858–1.292) 440 0.75 (0.4–1.38) 0.72 (0.39–1.33) 0.74 (0.39–1.38) 0.76 (0.4-1.42) Tertile 3 (≥1.293) 453 0.89 (0.49–1.59) 0.82 (0.46–1.48) 0.9 (0.47–1.71) 0.95 (0.5–1.81)
p-value for trend 0.689 0.518 0.755 0.873
Female
Blood lead (μg/dL)
Tertile 1 (<1.748) 488 1 (reference) 1 (reference) 1 (reference) 1 (reference) Tertile 2 (1.748–2.431) 487 0.93 (0.66–1.3) 0.91 (0.65–1.27) 0.94 (0.67–1.32) 0.97 (0.69–1.37) Tertile 3 (≥2.434) 503 1.01 (0.72–1.4) 0.96 (0.68–1.34) 1.03 (0.74–1.45) 1.09 (0.77–1.54)
p-value for trend 0.972 0.792 0.847 0.621
Blood mercury (μg/dL)
Tertile 1 (<2.434) 488 1 (reference) 1 (reference) 1 (reference) 1 (reference) Tertile 2 (2.434–4.030) 487 1.16 (0.82–1.64) 1.2 (0.84–1.7) 1.22 (0.86–1.74) 1.18 (0.83–1.69) Tertile 3 (≥4.031) 503 1.5 (1.08–2.1)* 1.53 (1.09–2.14)ǁ 1.63 (1.17–2.3)# 1.58 (1.12–2.24)#
p-value for trend 0.017 0.013 0.005 0.009
Blood cadmium (μg/dL)
Tertile 1 (<1.145) 489 1 (reference) 1 (reference) 1 (reference) 1 (reference) Tertile 2 (1.145–1.610) 486 0.84 (0.6–1.18) 0.83 (0.59–1.16) 0.84 (0.59–1.18) 0.84 (0.59–1.18) Tertile 3 (≥1.613) 503 1.02 (0.74–1.42) 1.01 (0.73–1.4) 1.06 (0.77–1.48) 1.07 (0.77–1.49)
p-value for trend 0.9 0.966 0.71 0.692
OR = odds ratio; CI = confidence interval.
*Model 1: crude model; †Model 2: adjusted for age and sex; ‡Model 3: model 2 + lifestyle behaviors (smoking status, alcohol drinking, and living region); §Model 4: model 3 + sociodemographic factors (education, occupation, family income, family history of ophthalmologic disease, and history of ophthalmologic surgery); ǁp < 0.05; #p < 0.01.
heavy metals therefore requires further study.
We also investigated the associations between dry eye disease and blood heavy metal concentrations in male and female participants in our study. In this subgroup analysis, we found a positive association only in females. The rea- son for this result is unclear, but one possible hypothesis involves differences in the distribution and excretion of mercury according to sex [34,35]. Additionally, the greater prevalence of dry eye disease among females may also have contributed to our results.
This study had several limitations. First, we did not define dry eye disease according to the results from physi- cal examination or dry eye tests. Due to the inherent lim- itations of the data provided by the Korea Centers for Dis- ease Control and Prevention, we used a questionnaire to define dry eye disease. Further studies using more strict diagnostic criteria for dry eye disease are needed to reveal the true associations between heavy metal concentrations in blood and dry eye disease. Second, we could not deter- mine temporal associations or causality because of the cross-sectional nature of the study. Longitudinal studies are necessary to confirm our results. Third, other unmea- sured factors could have confounded the reported associa- tions. Fourth, there are heavy metals that we did not inves- tigate, including arsenic, magnesium, and zinc. Finally, the odds ratios for diagnosis of dry eye disease according to the level of blood mercury concentration were only mar- ginally elevated; however, since environmental variables are becoming important risk factors for dry eye disease [36], the results of our study may have important clinical implications with respect to the pathogenesis of dry eye disease by demonstrating a possible association between increase blood mercury concentrations and dry eye dis- ease. This study also had several important strengths.
First, it included a large number of participants, which may have minimized any selection bias; furthermore, the large population-based sample was representative of the population of the Republic of Korea. Second, we consid- ered and adjusted for various potential confounders that may have affected the true associations between blood heavy metal concentrations and dry eye disease, including sex, age, area of residence, education level, household in- come, smoking and alcohol consumption.
In this study, we investigated the associations between blood heavy metal concentrations and dry eye disease us- ing a representative national sample of Korean adults. The
results showed that blood concentrations of mercury were associated with dry eye disease, especially in females. Al- though further experimental and longitudinal studies are needed to confirm the causal association between blood mercury concentrations and dry eye disease, our results suggest that controlling environmental exposure to mercu- ry may be necessary to address the increasing incidence of dry eye disease.
Conflict of Interest
No potential conflict of interest relevant to this article was reported.
Acknowledgments
This research was supported by Basic Science Research Program through the National Research Foundation of Ko- rea (NRF) funded by the Ministry of Education (2017R1D- 1A1B03029944).
References
1. Craig JP, Nichols KK, Akpek EK, et al. TFOS DEWS II definition and classification report. Ocul Surf 2017;15:276-83.
2. Fergusson JE. The heavy elements: chemistry, environmen- tal impact, and health effects. Oxford: Pergamon Press;
1990. p. 614.
3. He ZL, Yang XE, Stoffella PJ. Trace elements in agroeco- systems and impacts on the environment. J Trace Elem Med Biol 2005;19:125-40.
4. Bradl H. Heavy metals in the environment: origin, interac- tion and remediation. Amsterdam: Elsevier Academic Press; 2005. p. 1-25.
5. Tchounwou PB, Yedjou CG, Patlolla AK, Sutton DJ. Heavy metal toxicity and the environment. In: Luch A, editor.
Molecular, clinical and environmental toxicology. Basel:
Springer; 2012. p. 133-64.
6. Lee SH, Kang EM, Kim GA, et al. Three toxic heavy met- als in open-angle glaucoma with low-teen and high-teen intraocular pressure: a cross-sectional study from South Korea. PLoS One 2016;11:e0164983.
7. Chung SH, Myong JP. Are higher blood mercury levels asso-
ciated with dry eye symptoms in adult Koreans? A popula- tion-based cross-sectional study. BMJ Open 2016;6:e010985.
8. Kweon S, Kim Y, Jang MJ, et al. Data resource profile: the Korea National Health and Nutrition Examination Survey (KNHANES). Int J Epidemiol 2014;43:69-77.
9. Yoon KC, Mun GH, Kim SD, et al. Prevalence of eye dis- eases in South Korea: data from the Korea National Health and Nutrition Examination Survey 2008-2009. Korean J Ophthalmol 2011;25:421-33.
10. Bhan A, Sarkar NN. Mercury in the environment: effect on health and reproduction. Rev Environ Health 2005;20:39-56.
11. Warfvinge K, Bruun A. Mercury distribution in the squir- rel monkey retina after in Utero exposure to mercury va- por. Environ Res 2000;83:102-9.
12. Bridges CC, Battle JR, Zalups RK. Transport of thiol-con- jugates of inorganic mercury in human retinal pigment ep- ithelial cells. Toxicol Appl Pharmacol 2007;221:251-60.
13. Tanan CL, Ventura DF, de Souza JM, et al. Effects of mer- cury intoxication on the response of horizontal cells of the retina of thraira fish (Hoplias malabaricus). Braz J Med Biol Res 2006;39:987-95.
14. Cavalleri A, Belotti L, Gobba F, et al. Colour vision loss in workers exposed to elemental mercury vapour. Toxicol Lett 1995;77:351-6.
15. Sabelaish S, Hilmi G. Ocular manifestations of mercury poisoning. Bull World Health Organ 1976;53 Suppl:83-6.
16. Botelho SY, Hisada M, Fuenmayor N. Functional innerva- tion of the lacrimal gland in the cat. Origin of secretomotor fibers in the lacrimal nerve. Arch Ophthalmol 1966;76:581-8.
17. Sibony PA, Walcott B, McKeon C, Jakobiec FA. Vasoactive intestinal polypeptide and the innervation of the human lacrimal gland. Arch Ophthalmol 1988;106:1085-8.
18. Dartt DA. Neural regulation of lacrimal gland secretory processes: relevance in dry eye diseases. Prog Retin Eye Res 2009;28:155-77.
19. Milioni AL, Nagy BV, Moura AL, et al. Neurotoxic impact of mercury on the central nervous system evaluated by neuropsychological tests and on the autonomic nervous system evaluated by dynamic pupillometry. Neurotoxicolo- gy 2017;59:263-9.
20. Augustin AJ, Spitznas M, Kaviani N, et al. Oxidative reac- tions in the tear fluid of patients suffering from dry eyes.
Graefes Arch Clin Exp Ophthalmol 1995;233:694-8.
21. Nabi S. Mercury as a source of reactive oxygen species. In:
Nabi S. Toxic effects of mercury. [place unknown]: Spring- er; 2014. p. 95-9.
disease. J Ophthalmic Vis Res 2014;9:240-50.
23. Fortes MB, Diment BC, Di Felice U, et al. Tear fluid osmo- larity as a potential marker of hydration status. Med Sci Sports Exerc 2011;43:1590-7.
24. Walsh NP, Fortes MB, Esmaeelpour M. Influence of mod- est changes in whole-body hydration on tear fluid osmolar- ity: important considerations for dry eye disease detection.
Cornea 2011;30:1517.
25. Walsh NP, Fortes MB, Raymond-Barker P, et al. Is whole- body hydration an important consideration in dry eye? In- vest Ophthalmol Vis Sci 2012;53:6622-7.
26. The definition and classification of dry eye disease: report of the Definition and Classification Subcommittee of the International Dry Eye WorkShop (2007). Ocul Surf 2007;5:75- 92.
27. Research in dry eye: report of the Research Subcommittee of the International Dry Eye WorkShop (2007). Ocul Surf 2007;5:179-93.
28. Brake J, Hester PY, Thaxton P, et al. Effect of mercury tox- iocity on serum osmolality, plasma sodium and potassium, and serum proteins in the chicken. Arch Environ Contam Toxicol 1980;9:431-6.
29. Erie JC, Butz JA, Good JA, et al. Heavy metal concentra- tions in human eyes. Am J Ophthalmol 2005;139:888-93.
30. Bhattacharyya MH, Wilson AK, Rajan SS, Jonah M. Bio- chemical pathways in cadmium toxicity. In: Zalup RK, Koropatnick J, editors. Molecular biology and toxicology of metals. London: Taylor & Francis; 2000. p. 1-74.
31. Beatty S, Koh H, Phil M, et al. The role of oxidative stress in the pathogenesis of age-related macular degeneration.
Surv Ophthalmol 2000;45:115-34.
32. Hahn P, Milam AH, Dunaief JL. Maculas affected by age-related macular degeneration contain increased chelat- able iron in the retinal pigment epithelium and Bruch's membrane. Arch Ophthalmol 2003;121:1099-105.
33. Tsubota K, Kawashima M, Inaba T, et al. The antiaging ap- proach for the treatment of dry eye. Cornea 2012;31 Suppl 1:S3-8.
34. Hirayama K, Yasutake A. Sex and age differences in mer- cury distribution and excretion in methylmercury-adminis- tered mice. J Toxicol Environ Health 1986;18:49-60.
35. Thomas DJ, Fisher HL, Sumler MR, et al. Sexual differenc- es in the distribution and retention of organic and inorganic mercury in methyl mercury-treated rats. Environ Res 1986;41:219-34.
36. Stapleton F, Alves M, Bunya VY, et al. TFOS DEWS II ep-