Vol. 16, No. 1, 2004;120-129 http://www.esasang.com
I. Introduction
31)
Sasang Constitution is one of the Oriental medicinal theories, which has not been scientifically proved.
Sasang Constitution based on traditional Oriental philosophy consists of four types of people that are
접수일2004년 월3 24 ;일 승인일2004년 월4 17일
* 교신저자 이 상 민:
광주광역시 남구 주월동 543-8
Tel: +82-62-670-6528 E-mail: [email protected]
Taeyangin, Taeumin, Soyangin, Soumin. People are grouped in accordance with the four internal organs, which are lung, spleen, liver and kidney. For example, the person with large spleen and small kidney belongs to Soyangin. According to this theory, people who belong to different type of constitution have different prescription respectively to a same disease. Yangkyuk- Sanhwa-Tang (YST), a prescription of Traditional Oriental Medicine, has long been used as a specific
중풍환자에서 양격산화탕에 의한 세포활성 물질 생성의 조절 효과
노현수이상민 배영춘박혜선이재흥송승연유관석주종천․ *․ ․ ․ ․ ․ ․
원광대학교 한의과대학 사상체질의학교실
Abstract
The Effect of The Effect of The Effect of
The Effect of Yangkyuk-Sanhwa-Tang Yangkyuk-Sanhwa-Tang Yangkyuk-Sanhwa-Tang Yangkyuk-Sanhwa-Tang on Cytokine Production in the Patients on Cytokine Production in the Patients on Cytokine Production in the Patients on Cytokine Production in the Patients with Cerebral Infarction
with Cerebral Infarction with Cerebral Infarction with Cerebral Infarction
Lo Hyun-Soo Lee Sang-Min* Bae Young-Chun Park Hye-Sun Lee Jae-Heung Lo Hyun-Soo Lee Sang-Min* Bae Young-Chun Park Hye-Sun Lee Jae-Heung Lo Hyun-Soo Lee Sang-Min* Bae Young-Chun Park Hye-Sun Lee Jae-Heung Lo Hyun-Soo Lee Sang-Min* Bae Young-Chun Park Hye-Sun Lee Jae-Heung ․․․․ ․․․․ ․․․․ ․․․․ ․․․․
Song Seung-Yun Yoo Kwan-Seok Joo Jong-Chon Song Seung-Yun Yoo Kwan-Seok Joo Jong-Chon Song Seung-Yun Yoo Kwan-Seok Joo Jong-Chon Song Seung-Yun Yoo Kwan-Seok Joo Jong-Chon ․․․․ ․․․․
Department of Sasang Constitutional Medicine, College of Oriental Medicine, Wonkwang University
Yangkyuk-Sanhwa-Tang(YST) has been widely used as a formula for the Soyangin cerebral infarction (CI) patients according to Sasang constitutional philosophy. Brain cells produce cytokines and chemokines during the inflammatory process after stroke both in animal models and in patients. Previously, regulation of serum cytokine levels by YSThas been observed in individuals at the acute stage of CI disease, but there have not been other scientific investigations on YST. The author investigated the effect of YST on theproduction of various cytokines using peripheral blood mononuclear cells (PBMCs)from the Soyangin (CI) patients, and Soyangin normal group. The cytokine production was analyzed using enzyme-linked immunosorbent assay (ELISA). The amount of interleukin (IL)-1, IL-1, IL-6, IL-8, and tumor necrosis factor (TNF)- in culture supernatant significantly increased in the LPS-treated cells compared with unstimulated-cells (P < 0.05). However, in LPS-stimulated PBMCs, cytokines level in CI patients group was higher than that of normal group. YST (1 mg/ml) significantly inhibited IL-1, IL-1, and IL-8 production in PBMCs stimulated with LPS (about 85% for IL-1, 87% for IL-1, and 53% for IL-8, P < 0.05), but did not significantly inhibit IL-6 and TNF- production in the CI patients group. We also show that YST significantly increased LPS-induced IL-1, IL-6, and TNF- production in the normal group. Thesedata suggest that YST has a regulatoryeffect on the cytokine production, which might explain its beneficial effect in the treatment of CI.
Key words Key words Key words
Key words
: Yangkyuk-Sanhwa-Tang, lipopolysaccharide, cerebral infarction, cytokineprescription for cerebral infarction (CI) in the type of Soyangin to increase cerebral blood flow and to recover an injured brain cell. Recently, Jeong et al.
1)have reported that the serum level of cytokine was regulated by YST in an acute CI of Soyangin.
Patients with CI due to either thrombi or emboli are frequently suffered from irreversible neurologic deficits that markedly hinder their activity of daily living.
Patients may also be suffered from disturbances of mo- tor strength and coordination, sensory discrimination, visual function, speech, memory, or other intellectual abilities. Although recovery is often incomplete, partial recovery often occurs in weeks to months.
2)Early gene expression of inflammatory cytokines has been reported in the brain following global and focal CI.
3)Interleukin (IL)-1 has pleiotropic actions in the central nervous system. During the past decade, a growing corpus of evidence has indicated an important role of this cytokine in the development of brain damage following cerebral ischemia. The expression of IL-1 in the brain is dramatically increased during the early and chronic stage of infarction.
4)IL-6 is a differentiation factor for B and T lymphocytes, monocytes, neural cells, and hepatocytes.
5-7)It has been shown that high levels of IL-6 can occur in the cerebrospinal fluid of neurological patients,
8-11)but the possible etiopathogenetic role of the interleukin in diseases of the central nervous system (CNS) is not clarified. Brain tissue levels of IL-8, a potent neutrophil chemotactic cytokine (chemokine), increased significantly after reperfusion.
12)The inflammatory cytokine, TNF-α is known to be expressed in brain ischemia. Focal cerebral ischemia in rats produces elevated levels of TNF- in the ischemic brain region. α
13-14)As described above, various inflammatory cytokines are related to CI, directly or indirectly.
In this study, the regulating effect of YST on inflammatory cytokine production induced by LPS in peripheral blood mononuclear cells (PBMCs) was investigated. An experiment on the regulating effect of
YST on cytokine production in PBMCs was conducted to determine how the regulating mechanism takes place. The author now reports the results that provide the basis for the clinical therapeutic effect on YST in CI patients.
. Materials and Methods
Ⅱ
1. material 1. material 1. material 1. material
1) Reagents
Ficoll-Hypaque, lipopolysaccharide (LPS), avidin-per- oxidase, 3-[4,5-Dimethylthiazole-2-yl]-2,5,-diphenyl-te- trazolium bromideand (MTT), and 2'-azino-bis (3-ethyl- benzithiazoline-6-sulfonic acid) tablets substrate (ABTS) were purchased from Sigma (St. Louis, MO, USA).
RPMI 1640, ampicillin, streptomycin and fetal bovine serum (FBS) were purchased from Gibco BRL (Grand Island, NY, USA). Anti-human IL-1 , IL-1 , and α β TNF- , biotinylated anti-human IL-1 , IL-1 , and α α β TNF- , and recombinant (r) human IL-1 , IL-1 , and α α β TNF- were purchased from RD systems (Minneapolis, α MN, USA). Anti-human IL-6 and IL-8, biotinylated anti-human IL-6 and IL-8, and human IL-6 and IL-8 were purchased from Pharmingen (San Diego, CA, USA).
2) Patient
Patients with CI were examined at ** University.
The diagnosis of CI was confirmed with computerized
tomography (CT) and magnetic resonance imaging and
clinical signs (hemiparesis, hemiplegia, slurred speech,
facial palsy etc.). Signs and symptoms at cerebral
infarction included: vertigo (100%), gait disturbance
(60%), headache (85%), slurred speech (60%), weakness
(20%), drowsiness (60%) and sensory disturbances
(40%). Blood was obtained from 4 patients (2 males
and 2 females, age range 65-70) with CI and 10
healthy adults (5 males and 5 females, age range
60-67) with no medically diagnosable illness as a
control group. All samples were collected by
centrifugation and quickly frozen and stored in aliquots
at -80 ℃ until assay.
3) Preparation of YST
The ingredients of 44g YST include 8g of Rehmanniae Radix , 8g of Lonicera Japonica , 4g of Forsythiae Frutus , 4g of Gardeniae Fructus , 4g of Menthae Herba , 4g of Anemarrhenae Rhizoma , 4g of Gypsum Fibrosum , 4g of Schizonepetae Herba , and 4g of Ledebouriellae Radix . An extract of YST was prepared by decocting the dried prescription of herbs with boiling distilled water. The plant materials were obtained from the Oriental Medicine Hospital, Wonkwang University and identified by Dr. K.Y. Kim, College of Oriental Medicine, Wonkwang University, and their voucher specimens have been deposited in the Herbarium in the College of Pharmacy, Wonkwang University.
4) PBMCs isolation and culture
PBMCs (CI patients or normal group) from heparinized venous blood were isolated by Ficoll-gradient centrifugation, washed three times in phosphate-buffered saline (PBS) solution and resuspended in RPMI 1640 medium (GIBCO) supplemented with 2mM L-gluta- mine, 100U/ml penicillin G, 100g/ml streptomycin, and 10% FBS inactivated for 30min at 56 . PBMCs ℃ were adjusted to a concentration of 2 × 10
6cells/ml in 30ml falcon tube, and 100 l aliquots of cell suspension μ were placed in a four-well cell culture plate. PBMCs were cultured for 24h in 95% humidified air containing 5% CO
2(37 ), in the presence or the absence of LPS, ℃ and the supernatants were collected by centrifugation and stored at -20 . ℃
2. Method 2. Method 2. Method 2. Method
1) MTT assay
The MTT colorimetric assay of cell survival was executed by the method of Trivedi et al .,
15)with minor modifications. Cell aliquots (2 × 10
5)were seeded in microplate wells and incubated with 20 l of a MTT μ solution (5 mg/ml) for 4h at 37 ℃ under 5% CO
2and 95% air. Consecutively, 250 l of DMSO was added to μ extract the MTT formazan and an automatic microplate
reader read the absorbance of each well at 540nm.
2) ELISA of IL-1 , IL-1 , IL-6, IL-8, and TNF- α β α Cytokine production was measured by a modified ELISA, as described previously.
16)ELISA for IL-1 , IL-1 α
, IL-6, IL-8 and TNF-
β α was carried out in duplicate in 96-well, ELISA plates (Nunc) coated with each of 100 l μ aliquots of mouse anti-human IL-1 , IL-1 , IL-6, α β IL-8 and TNF-α monoclonal antibodies at 1.0g/ml in PBS at pH 7.4 and were incubated overnight at 4 . ℃ The plates were washed in PBS containing 0.05%
Tween-20 (Sigma) and blocked with PBS containing 1% BSA, 5% sucrose and 0.05% NaN₃ for 1h. After additional washes, serum sample or IL-1 , IL-1 , IL-6, α β IL-8, and TNF- standards were added and incubated α at 37 ℃ for 2h. After a 2h incubation at 37 , the ℃ wells were washed and then each of 0.2g/ml of biotinylated anti-human IL-1 , IL-1 , IL-6, IL-8, and α β TNF- were added and again incubated at 37 α ℃ for 2h. After washing the wells, streptavidin-peroxidase was added and plates were incubated for 20min at 37 . ℃ Wells were again washed and ABTS substrate (Sigma) was added. Color development was measured at 450nm using an automated microplate ELISA reader. A standard curve was run on each assay plate using recombinant human IL-1 , IL-1 , IL-6, IL-8 and TNF- α β (R&D Systems or Pharmingen) in serial dilutions.
α
3. Statistical analysis 3. Statistical analysis 3. Statistical analysis 3. Statistical analysis
The experiments shown are presented as the mean ± SD. Statistical evaluation of the results was performed by independent t -test and ANOVA with the Tukey post hoc test. The results were considered significant at a value of P < 0.05.
. Results
Ⅲ
1. Cytokine production by LPS in the CI 1. Cytokine production by LPS in the CI 1. Cytokine production by LPS in the CI 1. Cytokine production by LPS in the CI
patients and normal group patients and normal group patients and normal group patients and normal group
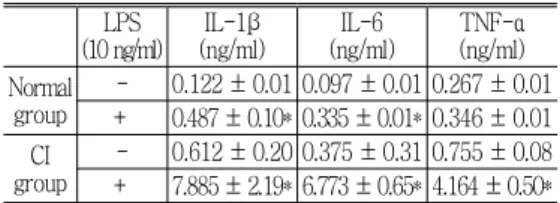
The amount of IL-1, IL-6, and TNF- , in CI α
patients and normal group culture supernatants, was
significantly increased in the LPS treated cells compared with unstimulated cells. The level of cytokine in CI patients group was higher than that of normal group, when LPS (10 ng/ml) stimulated PBMCs (Table 1).
PBMCs (2 10 ) were stimulated with LPS ✕ ⁵ (10ng/ml) for 24h. The cells were separated from the released cytokines by centrifugation at 400 g for ✕ 5min at 4 . Cytokine levels in culture supernatants ℃ were measured using ELISA. Values are the mean ± SD of duplicate determinations (n=6). * P < 0.05, significantly different from the control.
2. Effect of YST on LPS -induced IL-1 2. Effect of YST on LPS -induced IL-1 2. Effect of YST on LPS -induced IL-1 2. Effect of YST on LPS -induced IL-1α α α α
production in the CI patients group production in the CI patients group production in the CI patients group production in the CI patients group To evaluate the regulatory effect of YST on the IL-1
production, PBMCs were treated with LPS for 24h.
α
The supernatants were analyzed using ELISA for IL-1 . α As shown in Fig. 1, LPS (10 or 100ng/ml) significantly increased cytokine production on the PBMCs (unstimulated cells, 0.303±0.06ng/ml; LPS 10ng/ml, 0.99±0.17ng/ml, P =0.002; LPS 100ng/ml, 1.04 ± 0.47ng/ml, P =0.001). The author also tested the effect of YST on LPS-induced IL-1 production. IL-1 α increased by LPS 10ng/ml was significantly inhibited by YST 1mg/ml. Inhibition rate was 85±2%. Cell cytotoxicity by YST was not observed (Fig. 1).
PBMCs (2 10 ) were treated with various ✕ ⁵ concentration of YST for 1 h and then stimulated with LPS (10ng/ml or 100ng/ml) for 24h. Cytokine concentrations were measured from cell supernatants using ELISA method. Values are the mean±SD of duplicate determinations (n=6). * P <0.05: significantly different from the LPS-stimulated cells.
3. Effect of YST on LPS-induced IL-1 3. Effect of YST on LPS-induced IL-1 3. Effect of YST on LPS-induced IL-1 3. Effect of YST on LPS-induced IL-1β β β β
production in the CI patients group production in the CI patients group production in the CI patients group production in the CI patients group To assess the regulatory effect of YST on IL-1β production, PBMCs were treated with LPS for 24h. The supernatants were analyzed using ELISA for IL-1 . As β shown in Fig. 2, LPS (10 or 100ng/ml) significantly increased cytokine production on the PBMCs (unstimulated cells, 0.61±0.2ng/ml; LPS 10ng/ml, 7.88±2.19ng/ml, P =0.00; LPS 100ng/ml, 4.96±2.55 ng/ml, P =0.01). The author also tested the effect of YST on LPS-induced IL-1 production. IL-1 increased β β by LPS 10ng/ml was significantly inhibited by YST 1mg/ml. Inhibition rate was 87±8% (Fig. 2).
PBMCs (2 10 ) were treated with various ✕ ⁵ concentration of YST for 1h and then stimulated with LPS (10ng/ml or 100ng/ml) for 24h. Cytokine concentrations were measured from cell supernatants using ELISA method. Values are the mean ± SD of duplicate determinations (n=6). * P <0.05: significantly different from the LPS-stimulated cells.
LPS (10 ng/ml)
IL-1β (ng/ml)
IL-6 (ng/ml)
TNF-α (ng/ml) Normal
group
- 0.122 ± 0.01 0.097 ± 0.01 0.267 ± 0.01 + 0.487 ± 0.10* 0.335 ± 0.01* 0.346 ± 0.01 CI
group
- 0.612 ± 0.20 0.375 ± 0.31 0.755 ± 0.08 + 7.885 ± 2.19* 6.773 ± 0.65* 4.164 ± 0.50*
Table 1. Effect of LPS on the Cytokine Production from PBMCs of CI patients Group or Normal Group.
a
B=unstimulated PBMCs
b
LPS=Treated cells with LPS
c
YST=Treated cells with Yangkyuk-Sanhwa-Tang after LPS stimulation
Fig. 1. Effect of YST on LPS -induced IL-1α production
4. Effect of YST on the IL-6 production in 4. Effect of YST on the IL-6 production in 4. Effect of YST on the IL-6 production in 4. Effect of YST on the IL-6 production in
the CI patients group the CI patients group the CI patients group the CI patients group
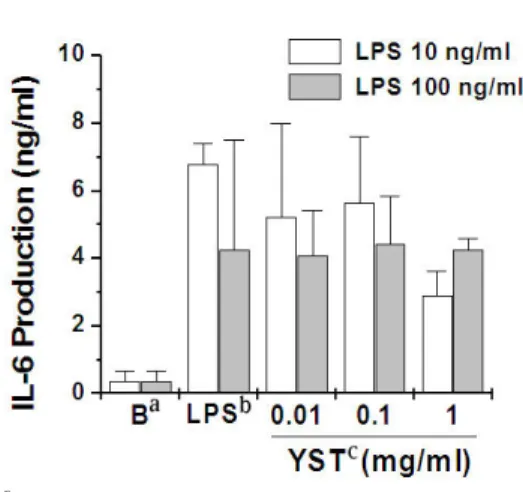
To evaluate the regulatory effect of YST on the IL-6 production, PBMCs were treated with LPS for 24h. The supernatants were analyzed using ELISA for IL-6. As shown in Fig. 3, LPS (10ng/ml) significantly increased cytokine production on the PBMCs (unstimulated cells, 0.37±0.31ng/ml; LPS 10ng/ml, 6.77±0.65ng/ml, P = 0.001), but did not significant at LPS 100ng/ml (4.25±3.27ng/ml, P =0.099). The author also tested the effect of YST on LPS-induced IL-6 production. IL-6 increased by LPS 10ng/ml was inhibited by YST, but there was no significant difference. YST had no effect on the LPS 100ng/ml-induced IL-6 production (LPS 10ng/ml, YST 1mg/ml, P=1; LPS 100ng/ml, YST 1mg/ml, P=0.569) (Fig. 3).
PBMCs (2 10 ) were treated with various ✕ ⁵ concentration of YST for 1h and then stimulated with LPS (10 or 100ng/ml) for 24h. Cytokine concentrations were measured from cell supernatants using ELISA method. Values are the mean ± SD of duplicate determinations (n=6).
5. Effect of YST on LPS-induced IL-8 5. Effect of YST on LPS-induced IL-8 5. Effect of YST on LPS-induced IL-8 5. Effect of YST on LPS-induced IL-8
production in the CI patients group production in the CI patients group production in the CI patients group production in the CI patients group To assess the regulatory effect of YST on IL-8 production, PBMCs were treated with LPS for 24h. The supernatants were analyzed using ELISA for IL-8. LPS (10 or 100ng/ml) significantly increased cytokine production on the PBMCs (unstimulated cells, 0.33±0.03ng/ml; LPS 10ng/ml, 8.73±1.07ng/ml, P =0.00; LPS 100ng/ml, 8.46±0.2ng/ml, P =0.00). The author tested the effect of YST on LPS-induced IL-8 production. IL-8 increased by LPS was significantly inhibited by YST 1mg/ml ( P <0.05). Inhibition rate of LPS 10ng/ml and 100ng/ml was about 53% and 37.2%, respectively (Fig. 4).
PBMCs (2 10 ) were treated with various ✕ ⁵ concentration of YST for 1 h and then stimulated with LPS (10 or 100ng/ml) for 24h. Cytokine concentrations were measured from cell supernatants using ELISA method. Values are the mean±SD of duplicate determinations (n=6). * P <0.05: significantly different from the LPS 10ng/ml-stimulated cells. ** P <0.05:
significantly different from the LPS 100ng/ml-stimulated cell.
a
B=unstimulated PBMCs
b
LPS=Treated cells with LPS
c
YST=Treated cells with Yangkyuk-Sanhwa-Tang after LPS stimulation
Fig. 2. Effect of YST on LPS -induced IL-1β production
a
B=unstimulated PBMCs
b
LPS=Treated cells with LPS
c
YST=Treated cells with Yangkyuk-Sanhwa-Tang after LPS stimulation
Fig. 3. Effect of YST on LPS -induced IL-6 production
6. Effect of YST on LPS induced TNF- 6. Effect of YST on LPS induced TNF- 6. Effect of YST on LPS induced TNF- 6. Effect of YST on LPS induced TNF-α α α α
production in the CI patients group production in the CI patients group production in the CI patients group production in the CI patients group To evaluate the regulatory effect of YST on the TNF- production, PBMCs were treated with LPS for α 24h. The supernatants were analyzed using ELISA for TNF- . LPS (10 or 100ng/ml) significantly increased α cytokine production on the PBMCs (unstimulated cells, 0.75±0.08ng/ml; LPS 10ng/ml, 4.16±0.5ng/ml, P = 0.001; LPS 100ng/ml, 5.24±0.15ng/ml, P =0.00). The author tested the effect of YST on LPS-induced TNF-α production. TNF- increased by LPS was inhibited by α YST 1mg/ml, but there was no significant difference (LPS 10ng/ml, YST 1mg/ml, P=0.72 ) (Fig. 5).
PBMCs (2 10 ) were treated with various ✕ ⁵ concentration of YST for 1 h and then stimulated with LPS (10 or 100ng/ml) for 24h. Cytokine concentrations were measured from cell supernatants using ELISA
method. Values are the mean ± SD of duplicate determinations (n=6).
7. Effect of YST on LPS induced cytokine 7. Effect of YST on LPS induced cytokine 7. Effect of YST on LPS induced cytokine 7. Effect of YST on LPS induced cytokine
production in the normal group production in the normal group production in the normal group production in the normal group
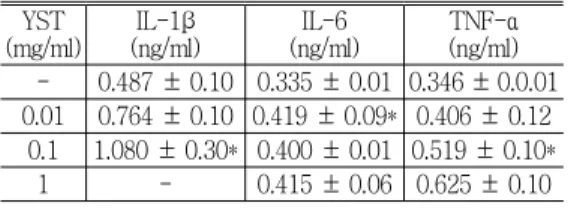
The effect of YST on LPS induced IL-1 , IL-6, and β TNF- production in PBMCs was evaluated. These α cytokines are an important inflammatory cytokine. LPS induce inflammatory cytokine production by PBMCs.
As shown in Table 2, YST increased the LPS-induced IL-1 , IL-6, and TNF- production. β α
PBMCs (2 10 ) were treated with various ✕ ⁵ concentration of YST for 1h and then stimulated with LPS (10ng/ml) for 24h. The cells were separated from the released cytokines by centrifugation at 400 g for ✕ 5min at 4 . Cytokine levels in culture supernatants ℃ were measured using ELISA. Values are the mean±SD of duplicate determinations (n=6). * P <0.05, significantly different from the control.
. Discussion
Ⅳ
In this study, the regulatory effect of YST on LPS-induced cytokine production in PBMCs was
a
B=unstimulated PBMCs
b
LPS=Treated cells with LPS
c
YST=Treated cells with Yangkyuk-Sanhwa-Tang after LPS stimulation
Fig. 4. Effect of YST on LPS -induced IL-8 production
a
B=unstimulated PBMCs
b
LPS=Treated cells with LPS
c
YST=Treated cells with Yangkyuk-Sanhwa-Tang after LPS stimulation
Fig. 5. Effect of YST on LPS -induced TNF- productionα
YST (mg/ml)
IL-1β (ng/ml)
IL-6 (ng/ml)
TNF-α (ng/ml) - 0.487 ± 0.10 0.335 ± 0.01 0.346 ± 0.0.01 0.01 0.764 ± 0.10 0.419 ± 0.09* 0.406 ± 0.12
0.1 1.080 ± 0.30* 0.400 ± 0.01 0.519 ± 0.10*
1 - 0.415 ± 0.06 0.625 ± 0.10
Table 2. Effect of YST on the LPS-Induced cytokine Production from PBMCs of Normal Group.