259 https://doi.org/10.9713/kcer.2019.57.2.259
PISSN 0304-128X, EISSN 2233-9558
Tuning of Electro-optical Properties of Nano-structured SnO
2:Ga Powders in a Micro Drop Fluidized Reactor
Dae Ho Lim*, Si Woo Yang**, Dong June Yoo**, Chan Gi Lee*** and Yong Kang**,†
*Greenhouse Gas Laboratory, Korea Institute of Energy Research, Daejeon, 34129, Korea
**Department of Chemical Engineering, Chungnam National University, Daejeon, 34134, Korea
***Advanced Materials & Processing Center, Institute for Advanced Engineering, Yongin, 17180, Korea (Received 28 January 2019; Received in revised form 4 March 2019; accepted 5 March 2019)
Abstract − Tuning of electro-optical properties of nano-structured SnO2:Ga powders in a micro drop fluidized reactor (MDFR) was highly effective to enhance the activities of powders to be used as sensor materials. The tuning was conducted continuously in a facile one-step process during the formation of powders. The microscopic hydrodynamic forces affected the band gap structure and charge transfer of SnO2:Ga powders through the oxygen and interfacial tin vacancies by pro- viding plausible pyro-hydraulic conditions, which resulted in the decrease in the electrical resistance of the materials.
The analyses of room-temperature photoluminescence (PL) spectra and FT-IR exhibited that the tuning could improve the surface activities of SnO2:Ga powders by adjusting the excitation as well as separation of electrons and holes, thus maximizing the oxygen vacancies at the surface of the powders. The scheme of photocatalytic mechanism of SnO2:Ga powders was also discussed.
Key words: SnO2:Ga powder, One-step continuous process, Pyro-hydraulic reaction, Fluidized reactor, Chemical sensing
1. Introduction
Tin oxides (SnO2) have been regarded as materials to be devel- oped as chemical sensing materials, due to their inherent characteris- tics including high electron mobility and transparent conductance, wide band gap structure and chemical stability. Those advantages of SnO2 allow them to be applied in the fields of various kinds of light cells, gas sensors, batteries, electrodes, magnetic semiconductors, etc [1-13].
Since the doping of foreign components into the host materials has been simple but impactive to improve the qualities to reveal the unique functions of host materials, various kinds of ions have been doped into SnO2 to develop and explore the specific functions of SnO2 based materials [14-39]. Several methods, including hydrothermal, sol-gel, precipitation, chemical vapor deposition, spray pyrolysis and elec- trospinning method, have been utilized for the doping of foreign components into SnO2 and preparation of SnO2 based materials [25-41].
It has been understood that the optical, electronic, chemical and physical characteristics of the final products are directly related to the methods of doping as well as preparation, since the surface facet, crystallite structure, chemical bonding and electron distribution have been adjusted and determined by means of atomic and electronic behaviors of components during the formation and doping.
For practical applications, however, the doping and preparation method should be continuous in order to make a compromise with the batch modes, which are taking a long time, requiring additional steps such as calcination, annealing, washing or drying and prepar- ing only small amount of product. Spray pyrolysis has been success- fully utilized to prepare various kinds of advanced functional powder materials with uniform size and composition continuously [42-46].
However, a more effective method has been required to meet the needs of creation for the more specific and special functions of SnO2 based advanced materials, which could be possible by controlling the operation conditions during the very short powder formation reaction. In addition, the method should be economic in order to be a process, which can be facilely employed in many fields of indus- tries. To solve those practical demands, a micro drop fluidized reactor (MDFR) was developed, since it can realize the continuous prepara- tion of nanostructured powders with uniform size and composition by means of a one-step process with reasonable production effi- ciency in a short time [47-52].
A micro drop fluidized reactor was employed in the present study to prepare the Ga doped SnO2 (SnO2:Ga) nanostructured powders in a one-step and continuous process with plausible production effi- ciency. The doping of Ga3+ ions was conducted to modify the SnO2 surface to enhance the gas sensing abilities. Because the Ga3+ ion can be a better choice, since its radius (0.062 nm) is more similar to that of Sn4+ (0.069 nm) than those of other Group III elements [53], which would compromise the reduction of lattice deformation. The mecha- nism of sensing reaction of ethanol at the active sites of SnO2:Ga was examined by considering the excitation and separation of electron- hole pairs at the surface of the powders.
†To whom correspondence should be addressed.
E-mail: [email protected]
‡This article is dedicated to Prof. Yong Kang on the occasion of his retire- ment from Chungnam National University.
This is an Open-Access article distributed under the terms of the Creative Com- mons Attribution Non-Commercial License (http://creativecommons.org/licenses/by- nc/3.0) which permits unrestricted non-commercial use, distribution, and reproduc- tion in any medium, provided the original work is properly cited.
of micro bubbles generated by a micro bubble generator with a micro flow controller (MFC) and injected into the bottom of the reactor.
The flow rates of micro drops and bubbles were 4.0 L/min and 0.4 L/
min, respectively, to adjust the favorable reaction conditions [48-51].
As-prepared powders of SnO2 and SnO2:Ga were collected by using a thimble filter (ADVANTEC, grade 84).
Diluted solution of SnCl4·5H2O (Sigma Aldrich 98%) in ethyl alcohol was used as the Sn source and diluted GaCl3 (Alfa Aesar 99.9%) in de-ionized water as the Ga source, respectively, which were mixed sufficiently before atomizing. The atomic ratio of Ga/Sn was in the
infrared (FT-IR) spectroscope (Nicolet 6700). The electrical resistivity of each sample, which was fabricated on the alumina substrate equipped with a pair of Pt electrodes, was measured by using an elec- trometer system. The sensing response was determined by means of the ratio of Ra and Re, which are the resistances in the air and in the ethanol vapor, respectively. The adsorption and recovery times were determined as the times taken by the sensing system to achieve 90%
of the total resistance change.
3. Results and Discussion
Fig. 2 shows the crystalline phases of as-prepared SnO2 and SnO2:Ga powders determined by XRD with varying the amount of Ga3+ (CGa).
In XRD patterns, all the diffraction peaks could be well indexed to the tetragonal structure of SnO2 based on the standard data file (JCPDS file no. 41-1445), confirming that single crystal phases of SnO2 and SnO2:Ga are mainly formed in a one-step process without any other additional process such as calcination, annealing, washing, and drying. Any other considerable characteristic peaks of impuri- ties were not detected. The magnifications of the main peaks around
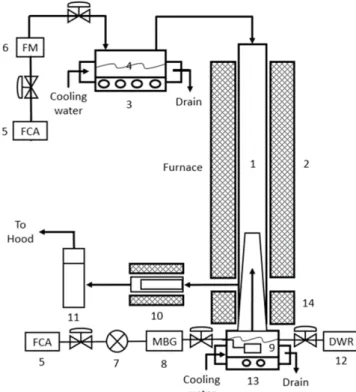
Fig. 1. Schematic diagram of experimental apparatus.
1. Reactor 2. Furnace
3. Ultrasonic atomizer 4. Precursor solution 5. Filtered & compressed air 6. Flow meter
7. Regulator & controller 8. Micro Bubble Generator 9. Microbubble port 10. Filter & collector 11. Gas scrubber 12. Distilled water reservoir 13. Liquid foam generator 14. Calming section
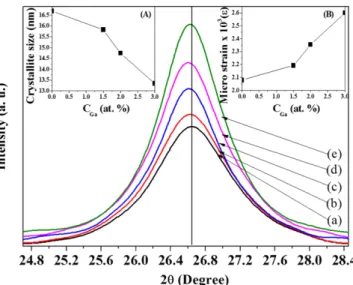
Fig. 2. X-ray diffraction pattern of SnO2 and SnO2:Ga powders prepared in the micro drop fluidized reactor (CGa [at.%]:
(a) 0, (b) 1.0, (c) 1.5, (d) 2.0, (e) 3.0).
26.7° for (110) plane were shifted toward lower angles with varying CGa (Fig. 3), indicating that the Ga3+ ions were doped into the crystal lattice of SnO2. Since the ionic radius of Ga3+ (0.062 nm) is similar to that of Sn4+ (0.069 nm), some parts of Sn4+ in the crystal lattice of host material were easily substituted by Ga3+[53]. The substitution of Ga3+ for Sn4+ resulted in a slight distortion of the lattice structure of SnO2 [18], representing a slight shift of the main peaks toward a lower angle. Note that the shift increased with increasing CGa up to 2.0 at.%; however, the shift tended to decrease with a further increase in CGa from 2.0 to 3.0 at%. The inset of Fig. 3(A) shows that the crystallite size of SnO2:Ga Powders decreased with increasing CGa, because of the corresponding increase in the number of defects in the crystal lattice [42,54,55]. The crystallite size was calculated by using the Scherrer equation from XRD data.
Fig. 4 shows the diffuse reflectance spectra (DRS) of SnO2 and SnO2:Ga at different Ga3+ content doped into the SnO2 lattice. The spectra were transformed to absorbance intensity through the Kubela- Munk method. The doping of Ga3+ into SnO2 extended the absorption band to the longer wavelength, indicating the modification of the band gap structure of SnO2. In the inset of Fig. 4, the band gap energy of SnO2:Ga powders, which was estimated from the onset of the absorption of DRS analysis, decreased with increasing Ga3+ content up to 2.0 at.% but it increased slightly with a further increase in CGa from 2.0 to 3.0 at.%, as listed in Table 1. The shifts of spectra pattern to the visible region are associated with the change of electron coor-
dination around the Sn4+ ions, resulting in the change of band gap structure. It can be ascribed to the formation of a new energy level of Ga-O between the conduction and valance bands of SnO2 [42,48-50, 56]. That is, the bandgap energy of SnO2 powders prepared in the MDFR was 3.09 eV, which is composed of Sn 5s5p conduction band and O 2p valance band. However, the substitution of Ga3+ ions for Sn4+ ions could lead to the formation of an acceptor level (Ga3+ 4s4p) below the conduction band of Sn, which results in the decrease in the bandgap energy.
Fig. 5 shows the field-emission SEM images of as-prepared SnO2 and SnO2:Ga powders. The powders were spherical and porous; how- ever, the surface became more wrinkled and furrowed with increas- ing CGa. The size of aggregate was in the range of 500 - 600 nm. The change of surface morphology of SnO2:Ga powders is ascribed to the doping of Ga3+ into SnO2 which induces the formation of parti- tioned parts at the surface of the powders. The unique partitioned parts can be due to the change of ionic strength and electro-negativity in the lattice of SnO2 by doping Ga3+ ions. The effects of regional breaking of charge homogeneity at the surface of the powders could increase with increasing dopant content [39].
Fig. 6 shows the room - temperature photoluminescence (PL) spec- tra of as-prepared powders. In Fig. 6, all the samples have a broad visible emission centered at 530~600 nm, due to the vacancies of oxygen and interstitial tin [7,16,17,22,31,32,38]. The intensity of PL spectra becomes weaker with an increase in the content of Ga3+. Fig. 3. Magnification of the diffraction peak around 26.7°. The insets
of (A) and (B) show the crystallite size and micro strain of SnO2:Ga with varying CGa, respectively (CGa [at.%]: (a) 0, (b) 1.0, (c) 1.5, (d) 2.0, (e) 3.0).
Fig. 4. Diffuse reflectance spectra of SnO2 and SnO2:Ga powders prepared in the micro drop fluidized reactor. The inset shows the change of band gap energy with varying CGa (CGa [at.%]: (a) 0, (b) 1.0, (c) 1.5, (d) 2.0, (e) 3.0).
Table 1. Crystallite size, bandgap energy and BET surface area of SnO2:Ga powders
UC [L/min] T [oC] CSn [mol/L] UMB [L/min] CGa/Sn [at.%] Crystallite size [nm] Bandgap energy [eV] BET surface area [m2/g]
4.0 800 0.3 0.4 0 16.60 3.09 28.69
4.0 800 0.3 0.4 1.0 16.14 2.91 30.38
4.0 800 0.3 0.4 1.5 15.91 2.64 36.83
4.0 800 0.3 0.4 2.0 14.72 2.36 38.03
4.0 800 0.3 0.4 3.0 13.21 2.44 37.91
Similar trends were also observed by doping of Zn, Fe or Ag into SnO2 lattice prepared by hydrothermal method [31,38]. Since the PL spectra reflect the charge transfer at the surface of the material, the doping of Ga3+ into SnO2 lattice can induce the charge transfer due to vacancies of the oxygen and interfacial tin. The vacancies could lead to the formation of trapped states by forming metastable energy level in the band gap structure, which consequently results in the induc- tion of charge transfer at the surface of host material. The vacancies of oxygen and interfacial tin could increase with increasing the con- tent of Ga3+ doped into SnO2 lattice. Thus, the intensity of PL spec- tra became weaker with increasing CGa up to 2.0 at.%. However, the PL intensity tended to increase slightly with a further increase in CGa from 2.0 to 3.0 at.%. Because, the modified band gap structure of SnO2 by doping Ga3+ ions could be less effective with a further increase in CGa owing to the recombination of charge carriers [32,38].
Fig. 7 shows the nitrogen adsorption isotherms (Fig. 7A) and pore size distribution (Fig. 7B) of SnO2:Ga powders. All of the isotherms Fig. 5. Field-emission SEM images of SnO2 and SnO2:Ga powders prepared in the micro drop fluidized reactor (CGa [at.%]: (a) 0, (b) 1.0, (c)
1.5, (d)2.0, (e) 3.0).
Fig. 6. Room temperature photoluminescence spectra of SnO2 and SnO2:Ga powders prepared in the micro drop fluidized reactor (CGa [at.%]: (a) 0, (b) 1.0, (c) 1.5, (d) 2.0, (e) 3.0).
Fig. 7. (A) Nitrogen adsorption isotherms and (B) BJH pore size distribution of SnO2 and SnO2:Ga powders prepared in the micro drop fluidized reactor. The inset of (A) shows the BET surface area with varying CGa (CGa [at.%]: (a) 0, (b) 1.0, (c) 1.5, (d) 2.0, (e) 3.0).
show Type IV hysteresis loops according to the IUPAC classifica- tion. The inset of Fig. 7(A) shows that the BET surface area of SnO2:Ga powders increases with increasing CGa up to 2.0 at.%, but it decreases slightly at 3.0 at.%, indicating a maximum at 2.0 at.%. The main peaks of pore size distribution are in the range of 8~15 nm, and the distributions tend to shift to the smaller size range with increas- ing CGa, showing the smallest pore size distribution at the content of Ga3+ is 2.0 at.% (Fig. 7(B)).
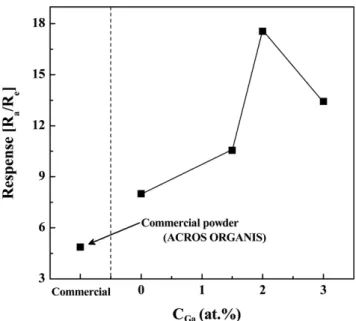
Fig. 8 shows the effects of CGa on the response of SnO2:Ga sam- ples to ethyl alcohol at 150oC. The Ra and Re are the resistances in air and ethyl alcohol, respectively. Compared to the commercial powders, the response of SnO2 powders prepared by MDFR shows higher relative resistance (Ra/Re). In addition, the doping of Ga3+
enhances the response intensity, exhibiting a maximum at CGa is 2.0 at.%, due to the increase in the number as well as strength of
active sites [8,14,15,30].
Fig. 9 shows the transient relative response of SnO2:Ga samples to ethyl alcohol (100 ppm) at 150 C with varying CGa. The response and recovery times were 5~8 s and 7~10 s, respectively. The response behavior becomes sensitive with increasing CGa up to 2.0 at.%. Since the electrical resistance stems basically from the charge transfer at the surface of the sensor, the doping of Ga3+ ions into SnO2 lattice resulted in the loss of oxygen and generation of free electrons and holes, so that the extrinsic semiconducting properties could take place at the surface of host materials. The electric resistivity could decrease with increasing oxygen vacancies as well as densities of free electrons and holes at the active sites of the surface, since they are highly sensitive to the external sensing gas [3,17,57- 60]. How- ever, the resistivity could increase with a further increase in CGa, showing a minimum value at CGa is 2.0 at.%. This can be because the charge carriers tend to interact with the ionic lattice in SnO2 with increasing the amount of Ga3+ ions. That is, the extra free electrons and oxygen vacancies generated by the doping of Ga3+ ions could interact for recombination, which prevents the active sites of SnO2:Ga from the surface reaction with exterior gas (ethyl alcohol) and thus from the gas sensing [17,38,61-64].
Fig. 10 shows the FT-IR spectrum of as-prepared SnO2 and SnO2:Ga powders at different content of Ga3+ ions, by which the chemi- cal compositions and bonds were analyzed. Sn-O vibration modes such as Sn-O-Sn and O-Sn-O were observed between 600 and 800 cm-1, indicating that some of metal oxides were bounded more than one oxygen atom [3,15,64-67]. The Sn-OH vibration peak was observed at around 1110 cm-1. The O-H bending vibration peak due to the adsorbed water molecule was observed at 1610 cm-1. Broad band peaks of hydrogen bounded OH group on the surface of SnO2:Ga were observed between 3300~3650 cm-1 [3,7,15,64,68-70]. Note that the distinctive peak indicating the presence of OH group on the surface of SnO2:Ga powders was most noticeable at CGa is 2.0 at.%.
Fig. 11 shows the scheme of excitation and separation of electron- hole pairs and possible reaction mechanism of SnO2:Ga powders with Fig. 8. Effects of CGa on the response of SnO2:Ga powders to ethyl
alcohol (100 ppm) at 150oC.
Fig. 9. Transient response of SnO2:Ga powders to ethyl alcohol (100 ppm) at 150oC with varying CGa (CGa [at.%]: (a) com- mercial (Acros Organics), (b) 0, (c) 1.5, (d) 2.0, (e) 3.0).
Fig. 10. FT-IR spectra of SnO2 and SnO2:Ga powders prepared in the micro drop fluidized reactor (CGa [at.%]: (a) 0, (b) 1.0, (c) 1.5, (d) 2.0, (e) 3.0).
varying CGa. Since the new formed Fermi energy level of SnO2:Ga hetero structure is lower than that of the bottom of the conduction band of the SnO2, the excited and separated electrons could be easily transferred to the acceptor level of Ga 4s4p, with remaining holes at the surface of SnO2 [38,61,70-72]. The adsorbed oxygen associated with the electrons on Ga3+ions could be formed O2-, and the holes could decompose H2O into OH- at the surface of SnO2. Both radicals could capture organic component such as ethyl alcohol, resulting in the surface reaction and thus the sensing. However, the excessive Ga3+ ions over a certain value (CGa is 2.0 at.%) could act as recombi- nation centers of separated electrons and holes owing to the electro- static attraction between the Ga3+ions and holes, which consequently results in the decrease in the surface activities of SnO2:Ga hetero structure [28,38,61-63,70-72].
4. Conclusion
Effective tuning of electro-optical properties of nano-structured SnO2:Ga powders was conducted successfully by employing a micro drop fluidized reactor. The bend gap structure was modified easily and the surface activity of SnO2:Ga powders was enhanced control- lably in a facile one-step process. The amount of dopant (Ga3+ ions) to minimize the band gap energy and to maximize the BET surface area as well as charge transfer at the surface of the material was 2.0 at.% within this experimental conditions. The response of as-pre- pared SnO2 powders to ethanol vapor was somewhat higher that of commercial powder, and the response became more sensitive with increasing the amount of Ga3+ ions doped into SnO2 up to 2.0 at.%.
A possible reaction mechanism was obtained to explain the surface activity of as-prepared SnO2:Ga powders.
Acknowledgments
This work was supported by the National Research Foundation of Korea (NRF) grant funded by Korea government (NRF-2013R1A1A2059124).
6(3), 2174-2184(2014).
4. Liu, B., Cheng, C. W., Chen, R., Shen, Z. X., Fan, H. J. and Sun, H. D., “Fine Structure of Ultraviolet Photoluminescence of tin Oxide Nanowires,” J. Phys. Chem. C, 114(8), 3407-3410(2010).
5. Gu, F., Wang, S. F., Lü, M. K., Zhou, G. J., Xu, D. and Yuan, D.
R., “Photoluminescence Properties of SnO2 Nanoparticles Syn- thesized by Sol-gel Method,” J. Phys. Chem. B, 108(24), 8119- 8123(2004).
6. Du, J., He, S., Zhao, R., Chen, S., Guo, T. and Wang, H., “Facile Self-assembly of SnO2 Nanospheres for Volatile Amine Gas Sens- ing,” Mater. Lett., 186, 318-321(2017).
7. Bonu, V., Das, A., Prasad, A. K., Krishna, N. G., Dhara, S. and Tyagi, A. K., “Influence of in-plane and Bridging Oxygen Vacancies of SnO2 Nanostructures on CH4 Sensing at Low Operating Tem- peratures,” Appl. Phys. Lett., 105, 243102(2014).
8. Wang, L., Wang, S., Wang, Y., Zhang, H., Kang, Y. and Huang, W., “Synthesis of Hierarchical SnO2 Nanostructures Assembled with Nanosheets and Their Improved Gas Sensing Properties,”
Sensors Actuators B., 188, 85-93(2013).
9. Hyodo, T., Sasahara, K., Shimizu, Y. and Egashira, M., “Preparation of Macroporous SnO2 Films Using PMMA Microspheres and Their Sensing Properties to NOx and H2,” Sensors Actuators B, 106, 580-590(2005).
10. Snaith, H. J. and Ducati, C., “SnO2-Based Dye-Sensitized Hybrid Solar Cells Exhibiting Near Unity Absorbed Photon-to-Electron Conversion Efficiency,” Nano Lett., 10, 1259-1265(2010).
11. Dai, S. and Yao, Z., “Synthesis of Flower-like SnO2 Single Crys- tals and Its Enhanced Photocatalytic Activity,” Appl. Surf. Sci., 258, 5703-5706(2012).
12. Guo, J., Zhang, J., Ju, D., Xu, H. and Cao, B., “Three-dimen- Sional SnO2 Microstructures Assembled by Porous Nanosheets and Their Superior Performance for Gas Sensing,” App. Surf.
Sci., 258, 5703-5706(2013).
13. Bhattacharjee, A. and Ahmaruzzaman, M., “Facile Synthesis of SnO2 Quantum Dots and Its Photocatalytic Activity in the Deg- radation of Eosin Y Dye: A Green Approach,” Mater. Lett., 139, 418-421(2014).
14. Guan, Y., Wang, D., Zhou, X., Sun, P., Wang, H., Ma, J. and Lu, G., “Hydrothermal Preparation and Gas Sensing Properties of Zn-doped SnO2 Hierarchical Architectures,” Sensors Actuators B, 191, 45-52(2014).
15. Ben, W., Othmen, H., Sdiri, N., Elhouichet, H. and Férid, M.,
“Study of Charge Transport in Fe-doped SnO2 Nanoparticles Prepared by Hydrothermal Method,” Mater. Sci. Semiconductor Processing, 52, 46-54(2016).
16. Reddy, P. V., Reddy, S. V. and Reddy, B. S., “Synthesis and Proper- ties of (Fe, Al) Co-Doped SnO2 Nanoparticles,” Mater. Today Pro- ceedings, 3, 1752-1761(2016).
17. Xu, X., Sun, J., Zhang, H., Wang, Z., Dong, B., Jiang, T., Wang, W., Li, Z. and Wang, C., “Effects of Al Doping on SnO2 Nano- fibers in Hydrogen Sensor,” Sensors Actuators B, 160, 858-863 (2011).
18. Ahmed, S. F., Ghosh, P. K., Khan, S., Mitra, M. K. and Chatto- padhyay, K. K., “Low-macroscopic Field Emission from Nano Crystalline Al Doped SnO2 Thin Films Synthesized by Sol-gel Technique,” Appl. Phys. A, 86, 139-143(2007).
19. Fang, L. M., Zu, X. T., Li, Z. J., Zhu, S., Liu, C. M., Zhou, W. L.
and Wang, L. M., “Synthesis and Characteristics of Fe3-doped SnO2 Nanoparticles via Sol-gel-calcination or Sol-gel-hydrothermal Route,”
J. Alloys Compd., 454, 261-267(2008).
20. Nomura, K., Okabayashi, J., Okamura, K. and Yamada, Y., “Mag- netic Properties of Fe and Co codoped SnO2 Prepared by Sol-gel Method,” Cit. J. Appl. Phys., 110, 83901(2011).
21. Huang, Z., Gao, H., Wang, Q., Zhao, Y. and Li, G., “Fabrication of Amorphous SnO2@C Nanofibers as Anode for Lithium-ion Bat- teries,” Mater. Lett., 186, 231-234(2017).
22. Huang, H., Tian, S., Xu, J., Xie, Z., Zeng, D., Chen, D. and Shen, G., “Needle-like Zn-doped SnO2 Nano Rods with Enhanced Photo- catalytic and Gas Sensing Properties,” Nanotechnology, 23, 105502- 105509(2012).
23. Li, Z., Zhou, Y., Yu, T., Liu, J. and Zou, Z., “Unique Zn-doped SnO2 Nano-echinus with Excellent Electron Transport and Light Harvesting Properties as Photo Anode Materials for High Perfor- mance Dye-sensitized Solar Cell,” Cryst Eng Comm, 14, 6462- 6468(2012).
24. Mondal, B., Basumatari, B., Das, J., Roychaudhury, C., Saha, H.
and Mukherjee, N., “ZnO-SnO2 Based Composite Type Gas Sen- sor for Selective Hydrogen Sensing,” Sensors Actuators B., 194, 389-396(2014).
25. Tang, W., Wang, J., Yao, P. and Li, X., “Hollow Hierarchical SnO2-ZnO Composite Nanofibers with Heterostructure Based on Electrospinning Method for Detecting Methanol,” Sensors Actua- tors B, 192, 543-549(2014).
26. Wang, H., Dou, K., Teoh, W. Y., Zhan, Y., Hung, T. F., Zhang, F., Xu, J., Zhang, R. and Rogach, A. L., “Engineering of Facets, Band Structure, and Gas-sensing Properties of Hierarchical Sn2+
Doped SnO2 Nano Structures,” Adv. Funct. Mater., 23(38), 4847- 4853(2013).
27. Lei, M., Hu, Q. R., Wang, S. L. and Tang, W. H., “Structural and Optical Properties of Al-doped SnO2 Nanowires,” Mater. Lett., 64, 19-21(2009).
28. Cui, S., Wen, Z., Mattson, E. C., Mao, S., Chang, J., Weinert, M., Hirschmugl, C. J., Gajdardziska-Josifovska, M. and Chen, J., “Indium-doped SnO2 Nanoparticle-graphene Nanohybrids:
Simple One-pot Synthesis and Their Selective Detection of NO2,”
J. Mater. Chem. A, 1(14), 4462-4467(2013).
29. Nilavazhagan, S. and Muthukumaran, S., “Investigation of Opti- cal and Structural Properties of Fe, Cu co-doped SnO2 Nanopar- ticles,” Superlattices Microstruct., 83, 507-520(2015).
30. Wang, W., Tian, Y., Li, X., Wang, X., He, H., Xu, Y. and He, C.,
“Enhanced Ethanol Sensing Properties of Zn-doped SnO2 Porous Hollow Microspheres,” Appl. Surf. Sci., 261, 890-895(2012).
31. Mazloom, J., Ghodsi, F. E. and Golmojdeh, H., “Synthesis and Characterization of Vanadium Doped SnO2 Diluted Magnetic Semiconductor Nanoparticles with Enhanced Photocatalytic Activ- ities,” J. Alloys Compd., 639, 393-399(2015).
32. Niu, M., Huang, F., Cui, L., Huang, P., Yu, Y. and Wang, Y.,
“Hydrothermal Synthesis, Structural Characteristics, and Enhanced Photocatalysis of SnO2/α-Fe2O3 Semiconductor Nanoheterostruc- tures,” Nano, 4, 681-688(2010).
33. Li, Z., Li, X., Zhang, X. and Qian, Y., “Hydrothermal Synthesis and Characterization of Novel Flower-like Zinc-doped SnO2 Nano- crystals,” J. Cryst. Growth, 291, 258-261(2006).
34. Kaur, J., Shah, J., Kotnala, R. K. and Verma, K. C., “Raman Spec- tra, Photoluminescence and Ferromagnetism of Pure, Co and Fe Doped SnO2 Nanoparticles,” Ceramics Int’l., 38, 5563-5570(2012).
35. Manikandan, D. and Murugan, R., “Room Temperature Dilute Magnetism in Nanoscale Co and Zn co-doped SnO2,” Superlat- tices Microstruct., 89, 7-14(2016).
36. Mohagheghi, M. B. and Saremi, M. S., “Semiconductor Science and Technology Electrical, Optical and Structural Properties of Li-doped SnO2 Transparent Conducting Films Deposited by the Spray Pyrolysis Technique: A Carrier-type Conversion Study,”
Semicond. Sci. Technol., 19, 764-769(2004).
37. Cheng, G., Wu, K., Zhao, P., Cheng, Y., He, X. and Huang, K.,
“Solvothermal Controlled Growth of Zn-doped SnO2 Branched Nanorod Clusters,” J. Cryst. Growth, 309(1), 53-59(2007).
38. Wang, X., Fan, H. and Ren, P., “Self-assemble Flower-like SnO2/ Ag Heterostructures: Correlation Among Composition, Struc- ture and Photocatalytic Activity,” Colloids Surfaces A Physico- chem. Eng. Asp., 419, 140-146(2013).
39. Gurakar, S., Serin, T. and Serin, N., “Electrical And Microstruc- tural Properties Of (Cu, Al, In)-doped SnO2 Films Deposited By Spray Pyrolysis,” Adv. Mater. Lett., 5(6), 309-314(2014).
40. Kim, J. H., Choi, C., Kim, H. Y., Kang, Y. and Park, Y. K., “Prepa- ration of Mono-dispersed Mixed Metal Oxide Micro Hollow Spheres by Homogeneous Precipitation in a Micro Precipitator,” Powder Technol., 153, 166-175(2005).
41. Kang, Y., Lee, C. K., Kang, G. M., Lim, D. H. and Yoo, D. J.,
“Aluminum ion and Lithium ion and Zinc ion co-doped Tin Oxide and Method for Continuous Synthesis the Same,” Korea Patent No. 10-1757424(2017).
42. Kang, H. W., Lim, S. N. and Park, S. B., “Effect of Tri-doping on H2 Evolution Under Visible Light Irradiation on SrTiO3:Ni/
Ta/La Prepared by Spray Pyrolysis from Polymeric Precursor,”
Int. J. Hydrogen Energy, 37(14), 10539-10548(2012).
43. Park, G. D., Cho, J. S. and Kang, Y. C., “Multiphase and Double- Layer NiFe2O4@NiO-Hollow-Nanosphere-Decorated Reduced Graphene Oxide Composite Powders Prepared by Spray Pyrolysis Applying Nanoscale Kirkendall Diffusion,” ACS Appl. Mater.
Interfaces, 7, 16842-16849(2015).
44. 44. Ko, Y. N., Park, S. B., Jung, K. Y. and Kang, Y. C., “One-Pot Facile Synthesis of Ant-Cave-Structured Metal Oxide-Carbon Microballs by Continuous Process for Use as Anode Materials in Li-Ion Batteries,” Nano Lett., 13, 5462-5466(2013).
45. Okuyama, K. and Lenggoro, W., “Preparation of Nanoparticles
50. Yoo, D. J., Lim, D. H., Kang, Y., Lee, C. G. and Kang, G. M.,
“Optical Properties of Nano–Structured ZnO:Sn Powders Pre- pared in a Micro Drop Fluidized Reactor,” J. Chem. Eng. Japan, 50(1), 21-25(2017).
51. Yang, S. W., Lim, D. H., Yoo, D. J., Kang, Y., Lee, C. G. and Kang, G. M., “Opto-magnetic Properties of Nano-structured MgO:Al Powders Prepared in a Micro Drop Fluidized Reactor,” Adv. Powder Technol., 29(3), 499-505(2018).
52. Cheng, B., Russell, J. M., Shi, W., Zhang, L. and Samulski, E.
T., “Large-Scale, Solution-Phase Growth of Single-Crystalline SnO2 Nanorods,” J. Am. Chem. Soc., 126, 5972-5973(2004).
53. Shannon, R. D., “Revised Effective Ionic Radii and Systematic Studies of Interatomie Distances in Halides and Chaleogenides,”
Acta. Cryst. A, 32, 751-767(1976).
54. Jia, A., Liang, X., Su, Z., Zhu, T. and Liu, S., “Synthesis and the Effect of Calcination Temperature on the Physical-chemical Properties and Photocatalytic Activities of Ni, La Codoped SrTiO3,” J. Hazard. Mater., 178(1-3), 233-242(2010).
55. Li, F., Yu, K., Lou, L. L., Su, Z. and Liu, S., “Theoretical and Experimental Study of La/Ni co-doped SrTiO3 Photocatalyst,”
Mater. Sci. Eng. B, 172(2), 136-141(2010).
56. Liu, H., Cao, W., Su, Y., Wang, Y. and Wang, X., “Synthesis, Characterization and Photocatalytic Performance of Novel Visi- ble-light-induced Ag/BiOI,” Applied Catal. B: Environ., 111, 271- 279(2011).
57. Yin X. T. and Guo, X. M., “Selectivity and Sensitivity of Pd-loaded and Fe-doped SnO2 Sensor for CO Detection,” Sensors Actuators B, 200, 213-218(2014).
58. Rani, S., Roy, S. C. and Bhatnagar, M. C., “Effect of Fe Doping on the Gas Sensing Properties of Nano-crystalline SnO2 Thin Films,”
Sensors Actuators B, 122(1), 204-210(2007).
59. Fukui, K. and Nakane, M., “CO Gas Sensor Based on Au-La2O3
Aqueous Solutions,” Ultrason. Sonochem., 15(4), 386-392(2008).
64. Reddy, C. V., Babu, B. and Shim, J., “Synthesis of Cr-doped SnO2 Quantum Dots and Its Enhanced Photocatalytic Activity,” Mater.
Sci. Eng. B, 223, 131-142(2017).
65. Baranauskas, V., Fontana, M., Guo, Z. J., Ceragioli, H. J. and Peterlevitz, A. C., “Field-emission Properties of Nanocrystalline Tin Oxide Films,” Sensors Actuators B, 107, 474-478(2005).
66. Gnanam S. and Rajendran, V., “Preparation of Cd-doped SnO2 Nanoparticles by Sol-gel Route and Their Optical Properties,” J.
Sol-Gel Sci. Technol., 56, 128-133(2010).
67. Long, D. A., “Infrared and Raman Characteristic Group Frequen- cies,” G. Socrates (ed.), 3rded. Wiley, NY, (2001).
68. Farahani, H., Wagiran, R. and Hamidon, M. N., “Humidity Sen- sors Principle, Mechanism, and Fabrication Technologies: A Com- prehensive Review,” Sensors, 14(5), 7881-939(2014).
69. Bonu, V., Das, A., Amirthapandian, S., Dhara, S. and Tyagi, A.
K., “Photoluminescence of Oxygen Vacancies and Hydroxyl Group Surface Functionalized SnO2 Nanoparticles,” Phys. Chem. Chem.
Phys., 17, 9774-9801(2015).
70. Chikhale, L. P., Patil, J. Y., Rajgure, A. V., Shaikh, F. I., Mulla, I.
S. and Suryavanshi, S. S., “Co-precipitation Synthesis of Nano- crystalline SnO2: Effect of Fe Doping on Structural, Morpholog- ical and Ethanol Vapor Response Properties,” Measurement, 57, 46-52(2014).
71. Xiong, Y., Zhang, G., Zhang, S., Zeng, D. and Xie, C., “Tin Oxide Thick Film by Doping Rare Earth for Detecting Traces of CO2: Operating in Oxygen-free Atmosphere,” Mater. Res. Bull., 52, 56-64(2014).
72. Vamathevan, V., Amal, R., Beydoun, D., Low, G. and McEvoy, S., “Photocatalytic Oxidation of Organics in Water Using Pure and Silver-modified Titanium Dioxide Particles,” J. Photochem.
Photobiol., 148(1-3), 233-245(2002).
![Fig. 6. Room temperature photoluminescence spectra of SnO 2 and SnO 2 :Ga powders prepared in the micro drop fluidized reactor (C Ga [at.%]: (a) 0, (b) 1.0, (c) 1.5, (d) 2.0, (e) 3.0).](https://thumb-ap.123doks.com/thumbv2/123dokinfo/5404712.218721/4.892.466.825.477.1023/room-temperature-photoluminescence-spectra-powders-prepared-fluidized-reactor.webp)