547 https://doi.org/10.9713/kcer.2018.56.4.547
PISSN 0304-128X, EISSN 2233-9558
Torrefaction Effect on the Grindability Properties of Several Torrefied Biomasses
Daru Setyawan, Jiho Yoo, Sangdo Kim, Hokyung Choi, Youngjoon Rhim, Jeonghwan Lim, Sihyun Lee and Dong Hyuk Chun†
Clean Fuel Laboratory, Korea Institute of Energy Research, 152, Gajeong-ro, Yuseong-gu, Daejeon, 34129, Korea (Received 5 February 2018; Received in revised form 24 May 2018; accepted 4 June 2018)
Abstract − Torrefaction is the promising process of pretreating biomass materials to increase the quality of their energy, especially to upgrade the materials’ grindability so that it is suitable for a commercial pulverizer machine. In this study, torrefaction of oak, bamboo, oil palm trunk, and rice husk was carried out under different torrefaction tempera- tures (300oC, 330oC, and 350oC) and different torrefaction residence times (30, 45, and 60 minutes). Complete char- acterization of the torrefied biomass, including proximate analysis, calorific value, thermogravimetric analysis, mass yield, energy yield, and grindability properties (Hardgrove Grindability Index) was carried out. Increasing the torrefac- tion temperature and residence time significantly improved the calorific value, energy density (by reducing the product mass), and grindability of the product. Furthermore, for commercial purposes, the torrefaction conditions that produced the desired grindability properties of the torrefied product were 330oC-30 minutes and 300oC-45 minutes, and the latter condition produced a higher energy yield for bamboo, oil palm trunk, and rice husk; however, torrefaction of oak did not achieve the targeted grindability property values.
Key words: Biomass, Torrefaction, Mass yield, energy yield, Grindability
1. Introduction
Interest in biomass fuel to generate energy has increased due to the optimism for its use as a source for 30% of energy generation by 2050 [1]. The shift in behavior from conventional energy to renew- able energy is based on the growth of people’s awareness about the environment as fossil fuel contributes to a significant amount of CO2 emission. This has led to using biomass fuel as a substitute for fossil fuel because biomass materials are considered to be carbon-neutral since the CO2 emitted from the combustion process is equal to the CO2 absorbed by the photosynthesis process of the plant [2]. Further- more, using biomass as a source of energy not only enhances the diversification of fuel generation, but it also reduces sulfur emissions and heavy metal production because the amount of sulfur and heavy metals in biomass is relatively low compared to coal [3].
Unfortunately, the limitation of biomass properties in comparison to the properties of fossil-fuel-based energy, such as its high mois- ture content, high bulk volume, hydrophilic nature, and low calorific value, leads to the high cost of transportation, handling, and storage of raw biomass [4]. Thus, a pretreatment process should be utilized to enhance biomass properties before this type of fuel can be eco- nomically feasible to use. Torrefaction is a biomass pretreatment process that has gained much attention due to its ability to improve the quality of biomass [5-7]. Furthermore, it is a promising process
to overcome the high energy-intensive characteristic of biomass grinding due to its fibrous structure [7-9].
Biomass torrefaction is the process of heating the biomass in the range of 200~300oC in an inert environment [5]. A torrefaction pro- cess at a temperature over 300oC may cause extensive devolatiliza- tion since it initiates the pyrolysis process [10]. The higher energy density of a torrefied product caused by the dehydration, dihydrox- ylation, and decarboxylation process that occurs during the torre- faction process decreases the oxygen/carbon (O/C) ratio and the hydrogen/carbon (H/C) ratio of that product in comparison to the raw biomass [5].
Biomass is pretreated to overcome its weaknesses; this step is very important if the biomass will be used for co-firing and as part of the co-gasification process. For instance, in the coal combustion process, it is important to achieve the right particle size for the coal in order to maintain the efficiency of the combustion process; otherwise the amount of unburned carbon and the stability of the combustion will be affected [11]. Existing machinery for the coal pulverizing pro- cess is typically used for coal with a Hardgrove Grindability Index (HGI) value as high as 50 [12]. For commercial purposes, it is nec- essary to know the optimum condition of torrefaction to achieve this HGI value.
In this paper, the torrefaction process of oak, bamboo, oil palm trunk, and rice husk, was carried out under different torrefaction tem- peratures (300oC, 330 oC, and 350 oC) and residence times (30, 45, and 60 minutes) in order to produce suitable torrefied biomass grind- ability properties for a commercial grinding machine. Complete characterization of the torrefied biomass, including proximate analysis, grindability properties (HGI value), calorific value, thermogravimet-
†To whom correspondence should be addressed.
E-mail: [email protected]
This is an Open-Access article distributed under the terms of the Creative Com- mons Attribution Non-Commercial License (http://creativecommons.org/licenses/by- nc/3.0) which permits unrestricted non-commercial use, distribution, and reproduc- tion in any medium, provided the original work is properly cited.
ric analysis (TGA), mass yield, and energy yield, was performed to analyze the chemical and physical properties of the product.
2. Experimental
2-1. Material
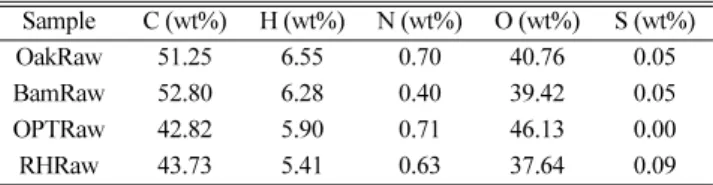
Four types of biomass were used in this experiment: oak, bamboo, oil palm trunk, and rice husk. All of the biomasses were used as received, without any treatment. The initial moisture content for those bio- masses was 29.18%, 18.31%, 69.21%, and 9.885%, respectively. The ultimate analysis of the raw biomasses is shown in Table 1.
2-2. Experimental procedure
The torrefaction process of the biomasses was performed in a lab- scale furnace. A total of 60 grams of biomass was placed in a 15.5 cm×15.5 cm×3.5 cm crucible. Nitrogen was introduced into the tube at 1.5 LPM to create an inert atmosphere. The biomass was torrefied in the range of 300~350oC for 30 minutes until a time period of 60 minutes was reached. The mass loss of the torrefied biomass was then calculated after the experiment. The schematic diagram of the experiment is shown in Fig. 1.
2-3. Hardgrove grindability index (HGI) value
Determination of the HGI value of the torrefied biomass was based on ASTM D409 and ISO5047 grindability testing methods.
The torrefied biomass was first ground with a grinder and then the material underwent a sieving process to produce a 600~1180 µm fraction of biomass. Next, 50 grams ± 0.01 grams of the sample was inserted evenly into the Hardgrove testing machine. After the sam- ple was crushed for 60 rotations by the apparatus, it was then sieved with a 75-µm sieve for 20 minutes. The two different fractions of biomass were then weighed using a balance; and the process was repeated if the mass loss was greater than 0.5 grams. The mass (m2) was the fraction of biomass that was sieved through the 75-µm sieve that can be calculated using Equation (1):
(1) where m1 is the biomass mass that was collected from the 75-µm sieve. The HGI value can be determined using the calibration chart that was produced using four standard types of coal with HGI values of 41, 61, 80, and 98.
2-4. Calorific value and proximate analysis
Proximate analysis of the raw and torrefied biomasses was based on the ASTM D7582 testing method using a TGA 701 Thermogravi- meter (LECO Co., Saint Joseph, MI, USA), while the calorific value was determined using a Parr Calorimeter (Parr Co., Moline, IL, USA).
2-5. Mass and energy yields
The mass and energy yields were calculated using the mass and calorific value of the biomass after torrefaction, and then those prop- erties were compared to the raw biomass properties. These calcula- tions are shown in Eq. (2) and Eq. (3), respectively:
Mass Yield (my) = ×100% (2)
m2=50 m– 1
Mass of torrefied biomass (mt) Mass of raw biomass (mr) Table 1. Ultimate analysis of the raw biomasses (Dry basis)
Sample C (wt%) H (wt%) N (wt%) O (wt%) S (wt%)
OakRaw 51.25 6.55 0.70 40.76 0.05
BamRaw 52.80 6.28 0.40 39.42 0.05
OPTRaw 42.82 5.90 0.71 46.13 0.00
RHRaw 43.73 5.41 0.63 37.64 0.09
Fig. 1. Schematic diagram of the torrefaction process.
Energy Yield (ey) =
×100% (3)
2-6. Thermogravimetric (TG) analysis
The degradation of the raw and torrefied biomasses was analyzed using TA SDT Q-600. A total of 10 mg of the sample was examined in a flow of 100 mL/min pure nitrogen at a heat rate of 10oC/min, with the temperature ranging from 25 oC up to 600 oC.
2-7. Sample labels
In this study, the abbreviations for oak, bamboo, oil palm trunk, and rice husk are Oak, Bam, OPT, and RH, respectively. The raw oak is labelled as OakRaw, while the torrefied oak is labelled as Oak- TXMY. The value of “X” indicates the temperature of torrefaction in Celsius (oC), while the value of “Y” indicates the period of torrefac- tion in minutes.
3. Results and Discussion
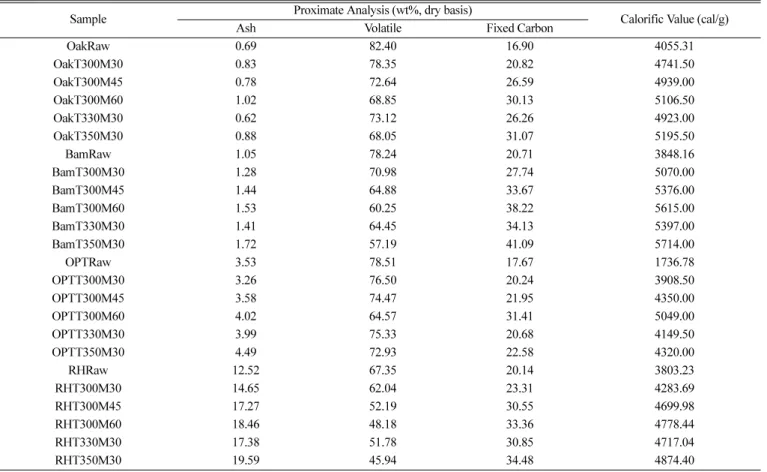
3-1. General characteristics of the torrefied biomass Table 2 presents the proximate analysis and calorific value of the raw and torrefied biomasses. The ash content of each torrefied biomass increased as the torrefaction temperature and torrefaction period increased. During the torrefaction process, ash remains in the torre- fied biomass product while volatile matter escapes into the environ-
ment. As the torrefaction temperature and torrefaction residence time increased, the fixed carbon value increased while the value of the volatile matter decreased gradually. Almeida et al. [13] and Yang et al. [14] explained that the volatile matter content in a torrefied bio- mass product decreased due to the thermochemical reaction of hemi- cellulose in the temperature range of 200~300oC. For the torrefied Oak, Bam, and RH, the fixed carbon value observed at the higher torrefaction temperature (350oC) was higher than the fixed carbon value of the torrefied biomass at a longer torrefaction residence time (60 minutes). This demonstrates that the removal of the volatile mat- ter was effective at the higher torrefaction temperature for those three types of biomass, while, for the OPT, the torrefaction residence time had a stronger effect on the torrefied product than the torrefaction temperature for the removal of the volatile matter.
The calorific values for the raw and torrefied biomasses are also shown in Table 2. The calorific value of the torrefied biomass is an important property because it will be used to consider the type of energy application required. Abnisa et al. [15] reported that the pre- treatment of biomass can improve the high heating value of the bio- mass, and the calorific value can be compared to the specific ranking of coals. The calorific value of torrefied biomasses, including Oak, Bam, OPT, and RH, increased with the higher torrefaction tempera- ture and longer torrefaction residence time. The higher torrefaction temperature (350oC) of Oak, Bam, and RH produced a greater calo- rific value than the longer torrefaction residence time (60 minutes).
These trends are similar due to the fixed carbon content of the torre- mt× Calorific value of torrefied biomass (ct)
mr× Calorific value of raw biomass (cr)
Table 2. Proximate analysis and calorific value of the raw and torrefied biomasses
Sample Proximate Analysis (wt%, dry basis)
Calorific Value (cal/g)
Ash Volatile Fixed Carbon
OakRaw 0.69 82.40 16.90 4055.31
OakT300M30 0.83 78.35 20.82 4741.50
OakT300M45 0.78 72.64 26.59 4939.00
OakT300M60 1.02 68.85 30.13 5106.50
OakT330M30 0.62 73.12 26.26 4923.00
OakT350M30 0.88 68.05 31.07 5195.50
BamRaw 1.05 78.24 20.71 3848.16
BamT300M30 1.28 70.98 27.74 5070.00
BamT300M45 1.44 64.88 33.67 5376.00
BamT300M60 1.53 60.25 38.22 5615.00
BamT330M30 1.41 64.45 34.13 5397.00
BamT350M30 1.72 57.19 41.09 5714.00
OPTRaw 3.53 78.51 17.67 1736.78
OPTT300M30 3.26 76.50 20.24 3908.50
OPTT300M45 3.58 74.47 21.95 4350.00
OPTT300M60 4.02 64.57 31.41 5049.00
OPTT330M30 3.99 75.33 20.68 4149.50
OPTT350M30 4.49 72.93 22.58 4320.00
RHRaw 12.52 67.35 20.14 3803.23
RHT300M30 14.65 62.04 23.31 4283.69
RHT300M45 17.27 52.19 30.55 4699.98
RHT300M60 18.46 48.18 33.36 4778.44
RHT330M30 17.38 51.78 30.85 4717.04
RHT350M30 19.59 45.94 34.48 4874.40
fied biomass. The higher value of the fixed carbon at the higher tor- refaction temperature had a significant impact on the calorific value of the sample. Those results are identical to the findings reported by Sulaiman and Anas [16]. Meanwhile, the opposite trend occurred for the torrefied OPT; the longer torrefaction residence time (60 min- utes) led to a higher calorific value than the value obtained at the higher torrefaction temperature (350oC). Increases in the calorific value of the torrefied biomasses varied depending on differences in the ash, moisture, volatile, and fixed carbon content of each of the raw biomasses. With the extremely high moisture content, the calo- rific value of the torrefied OPT (OPTT300M30) increased signifi- cantly (130.58%) in comparison to its raw material, while for the same torrefaction condition, the calorific value of the torrefied Oak, Bam, and RH only increased 11.61%, 3175%, and 12.63%, respec- tively.
3-2. Mass and energy yields
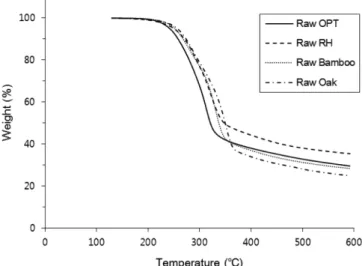
The substantial aim of torrefaction is to increase the energy den- sity of biomass by reducing the biomass weight due to the removal of water and volatile matter and the breaking of intermolecular bonds between the polymers [17]. Fig. 2 (a, b) shows the mass yields for the torrefied Oak, Bam, OPT, and RH. As seen, as the torrefaction tem- perature and torrefaction residence time increased, the mass yield decreased. The torrefaction product of Oak, Bam, OPT, and RH, at a torrefaction temperature of 300 oC and a torrefaction residence time of 30 minutes, resulted in a mass yield of 79.18%, 69.51%, 40.17%, and 78.87%, for Oak, Bam, OPT, and RH, respectively. Thus, the same torrefaction process condition produced different mass yields for the torrefied products. Fig. 3 shows the thermogravimetric curves for the raw Oak, Bam, OPT, and RH. The raw OPT had the highest water content, and the largest decrease in the sample weight occurred when the temperature ranged from 25 oC to 107 oC on the TGA. The Bam and Oak with the RH sample was found to have the smallest mass reduction because it had the lowest water content. This condi- tion resulted in the torrefied OPT having the smallest mass yield
compared to the other torrefied biomasses under the same torrefac- tion condition. This phenomenon also explains the reduction in the volatile matter in the torrefied biomass at the torrefaction tempera- ture of 300 oC and the torrefaction residence time of 30 minutes (Table 2). Due to its higher moisture content, the torrefied OPT had the lowest decrease in the amount of volatile matter in comparison to the other torrefied biomasses. In that biomass, the energy of the tor- refaction process was used for moisture vaporization instead of vola- tile evaporation.
The mass yield of the torrefaction product primarily depends on its hemicellulose content, which decomposes at 200~300 oC, resulting in different condensable and non-condensable products [10,18]. As seen in Fig. 3, the mass yield of TGA of Oak, Bam, and RH was sim- ilar at 300oC (71.85%, 70.05%, and 72.95, respectively). Thus, as the other two main components of biomass, cellulose and lignin, degrade in the higher temperature range (this experiment employed a higher torrefaction temperature than other studies), those two com- ponents significantly affected the mass yield of the torrefaction prod-
Fig. 2. (a) Mass yield of the torrefied biomasses for the 30-minute torrefaction residence time, (b) Mass yield of the torrefied biomasses at the torrefaction temperature of 300oC.
Fig. 3. Thermogravimetric (TG) curves of the raw oak, bamboo, oil palm trunk (OPT), and rice husk (RH).
uct. The degradation of cellulose, which produces anhydrous cellulose and levoglucosan, occurs between 240~350oC, while decomposition of lignin occurs when the temperature ranges between 280~500oC, producing phenols [10]. The mass yield of raw Oak, Bam, OPT, and RH from TGA at 350oC were 45.82%, 38.71%, 9.791%, and 46.75%, respectively. This mass reduction calculated by TGA corresponded to the mass yield of the torrefied biomass, and this was similar to the trend in which torrefied OPT had the lowest mass yield followed by torrefied Bam; the mass yield of torrefied Oak and torrefied RH was similar.
The effects of the torrefaction temperature on the mass yield of the torrefied biomasses are shown in Fig. 2(a), while Fig. 2(b) shows the influence of the torrefaction residence time on the mass yield product. For all biomass types, the higher torrefaction temperature resulted in greater mass reduction compared to the longer torrefac- tion residence time. The mass yield of torrefied Oak, Bam, OPT, and RH at 350oC and 30 minutes of torrefaction was 62.8%, 42.27%, 19.57%, and 60.98%, respectively; the mass yield at the longest torrefaction residence time (60 minutes at 300 oC) was only 65.03%, 48.43%, 23.30%, and 63.37%, respectively. As Bridge- man et al. [18] noted, the torrefaction temperature had a larger effect on the torrefied mass yield, followed by the reaction time and the particle size of the biomass.
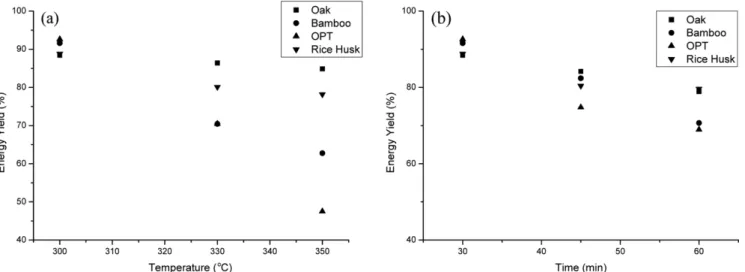
The effect of the torrefaction temperature and torrefaction resi- dence time on the energy yield of torrefied biomass is shown in Fig.
4. As determined by Eq. (3), the energy yield is the function of the mass yield and the calorific value of the torrefied biomass. Due to the decreasing mass yield at the higher torrefaction temperatures and for the longer torrefaction residence time, the energy yield of the torre- fied biomasses followed that trend. For the longer torrefaction resi- dence time (60 minutes at 300oC), the energy yield of the torrefied Bam, OPT, and RH was higher than the same biomass at a higher tor- refaction temperature and a lower torrefaction residence time (350
oC, 30 minutes). However, the torrefied Oak showed the opposite trend.
3-3. Grindability properties of the torrefied biomasses It is very important to understand the grindability properties of the torrefied biomasses especially when considering them for commer- cial applications. The HGI test is most commonly used to estimate the energy usage, capacity, and performance of the mill and the parti- cle distribution after the milling process [19].
Fig. 5(a) presents the effect of torrefaction temperature on the HGI value of the torrefied biomasses for the same torrefaction residence time (30 minutes), while Fig. 5(b) shows the HGI value for different torrefaction residence time at the same torrefaction temperature (300
oC). Increases in the torrefaction temperature and torrefaction resi- dence time led to improvements in the HGI value for all of the bio- masses. For the torrefaction of Oak, increasing the torrefaction temperature to 350 oC upgraded the HGI value to 109% in compari- son to OakT300M30. As shown in Fig. 5(b), increasing the torrefac- tion residence time to 60 minutes for the torrefied Oak only led to a 77% improvement in the HGI value in comparison to OakT300M30.
The HGI analysis of the torrefied Bam shows that the grindability trend for this biomass was similar to the grindability of the torrefied Oak. Although a comparison of the effect of the torrefaction tem- perature and torrefaction residence time of the bamboo torrefaction was slightly visible from the graph, the torrefaction temperature had a greater effect on the improvement of the biomass’ grindability than the torrefaction residence time. The HGI values for BamT350T30 and BamT300M60 increased to 94.87% and 79.49%, respectively, in comparison to BamT300M30. The trend of the torrefied RH grind- ability properties was similar to the trends for the two previous torre- fied biomasses. In comparison to RHT300M30, the HGI values of RHT300M60 and RHT350M30 were 154% and 177%, respec- tively. Chen et al. [19] explained the improvement in the grindability of the torrefied biomass by noting that, during the torrefaction pro- cess, the tight fiber structure is weakened, which results in the torrefied biomass becoming more fragile and brittle. Furthermore, Bridge- man et al. [20] showed that temperature was the most important parameter in terms of grindability of a torrefied biomass, although
Fig. 4. (a) Energy yield of the torrefied biomasses for the 30-minute torrefaction residence time, (b) Energy yield of the torrefied biomasses at the torrefaction temperature of 300oC.
residence time still had a significant effect on it.
The HGI analysis of torrefied OPT showed a different trend. Increas- ing the torrefaction temperature to 350oC increased the HGI value to 75% in comparison to the torrefied OPT at 300oC with the torrefac- tion residence time of 30 min. However, increasing the torrefaction residence time of OPT to 60 minutes strongly escalated the HGI value to 340% in comparison to OPTT300M30. Standberg et al. [21]
explained that the increase in the torrefied biomass brittleness caused by the degradation of the hemicellulose content of the biomass is due
to its biological role of strengthening the cell wall. Table 3 shows the percentage of mass loss of the raw and torrefied biomasses, based on the range of temperatures during TGA. From that table, the mass loss percentage of OPTT300M60 (11.75%) was smaller than the mass loss of OPTT350M30 (22.14%) at the temperature range of 200~300oC.
Thus, the hemicellulose content of OPTT300M60 was almost half that of OPTT350M30, thereby making it more brittle. Table 3 explicitly explains the phenomenon in which the HGI value of the torrefied biomasses increased as the torrefaction temperature and torrefaction Fig. 5. (a) HGI value of the torrefied biomasses for the 30-minute torrefaction residence time, (b) HGI value of the torrefied biomasses at the
torrefaction temperature of 300oC.
Table 3. Mass loss percentages of the raw and torrefied biomasses based on the temperature range during thermogravimetric analysis (TGA)
Sample Temperature Range (oC)
Residual Mass
151-200 201-250 251-300 301-350 351-400 401-450
OakRaw 0.56 3.10 17.51 29.36 15.05 3.32 31.10
OakT300M30 0.25 1.40 9.14 34.33 18.00 3.64 33.24
OakT300M45 0.27 0.71 3.44 31.68 17.17 4.83 41.89
OakT300M60 0.24 0.57 2.68 29.72 14.23 5.45 47.11
OakT330M30 0.28 0.81 4.03 31.25 17.18 4.71 41.74
OakT350M30 0.28 0.62 2.91 28.39 13.35 5.42 49.02
BamRaw 0.37 4.05 18.42 34.55 5.28 3.34 33.99
BamT300M30 0.35 2.65 12.79 37.08 6.14 3.45 37.53
BamT300M45 0.31 1.20 7.33 28.76 6.91 4.61 50.88
BamT300M60 0.32 0.84 4.37 21.03 7.99 5.47 59.98
BamT330M30 0.31 1.09 6.37 29.68 7.05 4.54 50.96
BamT350M30 0.35 0.89 4.33 18.10 7.26 5.44 63.63
OPTRaw 0.50 6.61 25.19 25.28 3.91 2.79 35.70
OPTT300M30 0.51 5.98 24.11 25.07 4.07 2.74 37.50
OPTT300M45 0.60 4.09 19.28 25.91 5.44 4.11 40.55
OPTT300M60 0.54 2.15 10.06 18.51 6.92 4.99 56.84
OPTT330M30 0.66 4.54 19.90 25.21 4.89 3.26 41.54
OPTT350M30 0.47 4.39 19.14 25.12 5.07 3.39 42.42
RHRaw 0.80 4.04 17.93 27.38 5.16 3.68 41.01
RHT300M30 0.28 1.25 8.39 30.73 5.92 3.79 49.64
RHT300M45 0.24 0.71 4.34 21.57 6.89 4.76 61.49
RHT300M60 0.26 0.64 3.23 14.66 7.11 5.36 68.75
RHT330M30 0.24 0.78 4.64 20.56 7.02 4.98 61.78
RHT350M30 0.30 0.60 2.45 10.32 6.88 5.84 73.62
residence time increased. The reduction of the hemicellulose con- tent, as represented by the mass loss percentage in the temperature range of 200~300oC, produced more brittle materials as the torrefac- tion temperature and torrefaction period increased.
Regarding the industrial need to determine a proper HGI value for a commercial grinding machine, for all the torrefaction conditions, torrefied Oak was the only biomass that could not fulfill the target value; its HGI value was below 50. For the other three torrefied bio- masses (Bam, OPT, and RH), in order to achieve the HGI target value, the optimum torrefaction process conditions were 300oC-45 min- utes and 330oC-30 minutes. These two conditions produced an HGI value greater than 50; however, increasing the torrefaction tempera- ture and the torrefaction residence time beyond those two conditions resulted in the HGI value exceeding the required value, which means that more energy is required. As shown in Figure 4, the energy yield of the torrefaction process with a temperature of 300 oC and a torre- faction residence time of 45 minutes was greater than the energy yield at the torrefaction process with a temperature of 330 oC and tor- refaction residence time of 30 minutes for the three torrefied bio- masses (Bam, OPT, and RH); thus, the torrefaction process was more favorable for the first condition, 300 oC-45 minutes.
4. Conclusions
Increasing the torrefaction temperature and torrefaction residence time led to an increase in the grindability property of the torrefied biomasses. The torrefaction temperature had a more significant impact on this value than the torrefaction residence time for all the torrefied biomasses except torrefied OPT. Torrefied oak was the only torre- fied biomass that could not achieve the minimum HGI value for commercial purposes. The optimum condition to produce a suitable HGI value for a torrefied biomass (Bam, OPT, and RH) was the tor- refaction temperature of 300oC and the torrefaction residence time of 45 minutes. This condition resulted in a higher energy yield com- pared to the torrefaction process with a temperature of 330 oC and a torrefaction residence time of 30 minutes, although that torrefaction condition produced similar grindability results for all of the torrefied products.
Acknowledgments
This work was conducted under the framework of the research and development program of the Korea Institute of Energy Research (B8-2436).
References
1. Fryda, L., Daza, C., Pels, J., Janssen, A. and Zwart, R., “Lab- scale Co-firing of Virgin and Torrefied Bamboo Species Gua- dua Angustifolia Kunth as a Fuel Substitute in Coal Fired Power Plants,” Biomass. Bioenerg., 65, 28-41(2014).
2. Darvell, L. I., Jones, J. M., Gudka, B., Baxter, X. C., Saddawi,
A., Williams A. and Malmgren, A., “Combustion Properties of Some Power Station Biomass Fuels,” Fuel, 89(10), 2881-2890 (2010).
3. Balat, M., “Influence of Coal as an Energy Source on Environ- mental Pollution,” Energ. Source., 29(7), 581-589(2007).
4. Arias, B. R., Pevida, C. G., Fermoso, J. D., Plaza, M. G., Rubiera, F. G. and Piz-Martinez, J. J., “Improvement of Coke Resistance of Ni/Al2O3 Catalyst in CH4/CO2 Reforming by ZrO2 Addition,”
Fuel. Process. Technol., 89(2), 169-175(2008).
5. Mei, Y., Che, Q., Yang, Q., Draper, C., Yang, H., Zhang S. and Chen, H., “Torrefaction of Different Parts from a Corn Stalk and Its Effect on the Characterization of Products,” Ind. Crop. Prod., 92, 26-33(2016).
6. Kim, Y.-H., Na, B.-I., Ahn, B.-J., Lee H.-W. and Lee, J.-W., “Opti- mal Condition of Torrefaction for High Energy Density Solid Fuel of Fast Growing Tree species,” Korean J. Chem. Eng., 32(8), 1547-1553(2015).
7. Park, D.-H., Ahn, B. J., Kim, S. T., Lee, J. W., Han, G.-S. and Yang, I., “Microscopic Observation of Pellets Fabricated with Torrefied Larch and Tulip Tree Chip and Effect of Binders on the Durability of the Pellets,” Korean Chem. Eng. Res., 53(2), 224-230(2015).
8. Commandre, J. M. and Leboeuf, A., “Volatile Yields and Solid Grindability after Torrefaction of Various Biomass Types,” Environ.
Prog. Sustain. Energy., 34(4), 1180-1186(2015).
9. Lee, M. S., Jeong, G., Jung, S.-J. and Lee, K.-Y., “The Fueliza- tion Study on the Oil Palm Frond through Torrefaction,” Korean Chem. Eng. Res., 51(4), 465-469(2013).
10. Tumuluru, J. S., Sokhansanj, S., Hess, J. R., Wright, C. T. and Board- man, R. D., “REVIEW: A review on Biomass Torrefaction Process and Product Properties for Energy Applications,” Ind. Biotechnol., 7(5), 384-401(2011).
11. Khalsa, J. H. A., Leistner, D., Weller, N., Darvell, L. I. and Dooley, B., “Torrefied Biomass Pellets—Comparing Grindability in Dif- ferent Laboratory Mills,” Energies., 9(10), 794-808(2016).
12. Hower, J. C., “Hardgrove Grindability Index and Petrology Used as an Enhanced Predictor of Coal Feed Rate,” Energeia, 1(6), 1-6 (1990).
13. Almeida, G., Brito, J. O. and Perre, P., “Alterations in Energy Prop- erties of Eucalyptus Wood and Bark Subjected to Torrefaction:
The Potential of Mass Loss as a Synthetic Indicator,” Bioresource.
Technol., 101(24), 9778-9784(2010).
14. Yang, H. P., Yan, R., Chen, H. P., Dong, H. I. and Zheng, C.,
“Characteristics of Hemicellulose, Cellulose and Lignin Pyroly- sis,” Fuel, 86(12), 1781-1788(2007).
15. Abnisa, F., Arami-Niya, A., Wan Daud, W. M. A., Sahu, J. N.
and Noor, I. M., “Utilization of Oil Palm Tree Residues to Pro- duce Bio-oil and Bio-char via Pyrolysis,” Energ. Convers. Man- age., 76, 1073-1082(2013).
16. Sulaiman, S. A. and Anas, M. I., “Torrefaction of Oil Palm Fronds for Enhancement of Fuel Quality,” Trends. Appl. Sci. Res., 7(3), 248-255(2012).
17. Correia, R., Goncalves, M., Nobre, C. and Mendes, B., “Impact of Torrefaction and Low-temperature Carbonization on the Proper- ties of Biomass Wastes from Arundo Donax L. and Phoenix Canar- iensis,” Bioresource. Technol., 223, 210-218(2017).
18. Bridgeman, T. G., Jones, J. M., Williams, A. and Waldron, D. J.,
“An Investigation of the Grindability of Two Torrefied Energy Crops,” Fuel, 89(12), 3911-3918(2010).
19. Chen, D., Zheng, Z., Fu, K., Zeng, Z., Wang, J. and Lu, M., “Torre- faction of Biomass Stalk and Its Effect on the Yield and Quality of Pyrolysis Products,” Fuel, 159, 27-32(2015).
20. Bridgeman, T. G., Jones, J. M., Shield, I. and Williams, P. T.,
“Torrefaction of Reed Canary Grass, Wheat Straw and Willow
to Enhance Solid Fuel Qualities and Combustion Properties,”
Fuel, 87(6), 844-856(2008).
21. Strandberg, M., Olofsson, I., Pommer, L., Wiklund-Lindstrom, S., Aberg, K. and Nordin, A., “Effects of Temperature and Res- idence Time on Continuous Torrefaction of Spruce Wood,” Fuel.
Process. Technol., 134, 387-398(2015).