327 http://dx.doi.org/10.9713/kcer.2015.53.3.327
PISSN 0304-128X, EISSN 2233-9558
Optimization of Anthraquinone Dyes Decolorization Conditions with Response Surface Methodology by Aspergillus
Yufeng Ge, Bin Wei, Siyu Wang, Zhiguo Guo and Xiaolin Xu†
College of Chemistry and Chemical Engineering, Shihezi University, Key Laboratory for Green Processing of Chemical Engineering of Xinjiang Bingtuan, Xinjiang, Shihezi 832003, China
(Received 15 July 2014; Received in revised form 24 November 2014; accepted 30 November 2014)
Abstract − A large amount of dye wastewater poses a threat to environmental safety. Disperse blue, an anthraquinone dye that is widely used in textile dyes, is difficult to degrade in wastewater. In this work, one fungus was screened according to the decolorization rate of disperse blue. The fungus was identified and named Aspergillus XJ-2 on the basis of its morphological characteristics and 18s rDNA. Response surface method was used to optimize culture conditions for A. XJ-2. The optimum values of obtained responses were as follows: temperature, 35 °C; pH, 5.2; carbon-to-nitrogen ratio, 30:5.5; and rotation ratio, 175 r·min-1. Under optimized conditions, the decolorization rate of A. XJ-2 was up to 94.8% in 48 h.
Key words: Anthraquinone Dye, Decolorization, Fungi, Wastewater, Response Surface Method
1. Introduction
A large amount of chemically different synthetic dyes are widely used in the textile and dyestuff industries for textile dying, paper printing, food packing, pharmaceutical and color photography [1,2].
Residue dyes in industrial wastewater affect the aesthetic quality, transparency, and gas solubility of water bodies because of their strong color and highly fluctuating pH [3]. Residue dyes have an adverse impact on water bodies in terms of biological oxygen demand (BOD) [4]. Moreover, the most familiar synthetic dyes, such as azo, anthraquinonic dyes, and/or their degradation prod- ucts, are toxic and potentially carcinogenic once released into the environment [5-7]. Compared with azo-based dyes, anthraquinone dyes are more resistant to biodegradation because of their fused aromatic structures, which may significantly affect photosynthetic activity in aquatic life [8,9]. Therefore, anthraquinonic dye removal has particularly attracted scientific attention.
A wide range of treatment methods have been used for dye removal from wastewaters. Advanced oxidation processes, chemical or electrochemical precipitation [10], and adsorption [11] have been used for color removal from effluent. However, these treatment methods have inherent drawbacks of high operating costs, as well as being economically unfeasible (owing to their requirement for a large amount of energy and chemicals) and the production of abun- dant sludge, which results in waste disposal problems [4,12].
Biological treatment for dye removal from wastewater is one of
the most widely used methods. The bio-decolorization of dyes is mainly completed by bacteria, such as Pseudomonas, Shewanella, Rhizobium, and Radiobacter [13,14], some of which fail to degrade anthraquinone dyes completely. Given that some intermediate products, such as aromatic amines, are more toxic than initial sub- strates, further decomposition is required [15]. Therefore, pure fungal cultures have attracted considerable attention relative to the devel- opment of bioprocesses for the mineralization of anthraquinonic dyes and the degradation of pollutants because of their extracellu- lar, nonspecific, high physical and enzymatic tolerance for high concentrations of toxicants [16,17].
Some fungi, especially white-rot fungi, appear quite effective in achieving removal rates as high as 40~88% for COD, 60~100% for phenolics, and 45~80% for synthetic dyes [18,19].
In this work, one fungus was screened to remove anthraquinone dyes from simulated wastewater. Decolorization conditions were optimized by response surface methodology (RSM), which is a powerful tool for optimizing the interactions of estimated parameter effects that could reduce the number of experiments to be under- taken [13,20].
2. Material and Methods
2-1. Materials
Samples, which were used to separate the microorganism, were obtained from plant biochemical treatment pool sludge and the sur- rounding soil of a cotton textile factory in Shihezi. Disperse blue, an anthraquinone dye, was also provided by this factory. The molecu- lar formula of this dye is shown in Fig. 1.
Czapek medium contained 2 g of NaNO3, 1 g of K2HPO4, 0.5 g of KCl, 0.5 g of MgSO4, 0.01 g of FeSO4, 30 g of glucose, and 1 L
†To whom correspondence should be addressed.
E-mail: [email protected]
This is an Open-Access article distributed under the terms of the Creative Com- mons Attribution Non-Commercial License (http://creativecommons.org/licenses/by- nc/3.0) which permits unrestricted non-commercial use, distribution, and reproduc- tion in any medium, provided the original work is properly cited.
of distilled water at pH 7.3±0.2. Meanwhile, the solid screening medium comprised agar and disperse blue at a 20 mg/L concentra- tion added to Czapek medium.
Simulated wastewater consisted of Czapek medium, adding disperse blue of 20 mg/L.
2-2. Screening of decolorizing microorganism
Samples were diluted and spread on a solid screening plate and left to stand for 2 d at 37oC. Mycelia on the plate were extracted and placed in simulated wastewater. Culture conditions were 100 ml medium in a 250 ml flask at 37oC with shaking at 150 r·min-1 for 48 h. The decolorization rates of microbes were determined after 48 h. The microbe with the maximum decolorization rate was selected as the target microorganism.
2-3. Determination of decolorization rate
The maximum absorbent wavelength of disperse blue was 567 nm.
Supernatants, which were extracted with equal volume of ethyl acetate at different culture times, were used to detect the absorbance value at 567 nm. The decolorization rate of each sample was calcu- lated according to the following formula:
Decolorization rate (%) = (A-B) / A×100% (1) A: absorbance value of supernatant before inoculation; and B: absorbance value of supernatant after being cultured;
2-4. Identification of decolorizing microorganism
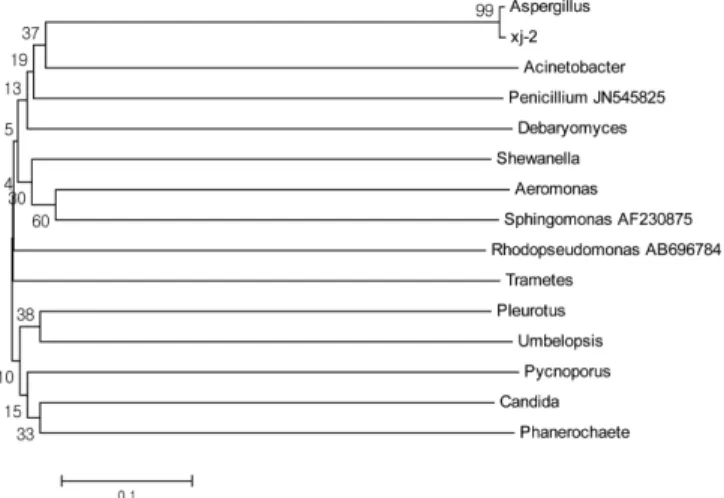
The decolorizing microbe was identified on the basis of its mor- phological characteristics and 18S rDNA. The colony characteris- tic of the strain was observed in the plate. The micro morphological characteristics of the decolorizing microorganism were examined by scanning electron microscopy (JSM-6490LV, Japan) and a Primo Star optical microscope (ZEISS, Germany). The fungi were identified on the basis of 18S rDNA homology. A phylogenetic tree was con- structed by using the National Centre for Biotechnology Information BLAST service and Molecular Evolutionary Genetics Analysis software with the neighbor-joining method [21].
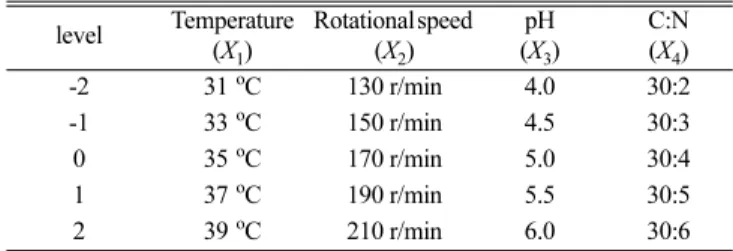
2-5. Optimization of decolorization conditions with RSM The statistical software DX8.0 central composite rotatable set
culture conditions. Based on the results of single-factor experiments (data not shown), four design factors were selected: temperature, rotational speed, pH of original medium and carbon-to-nitrogen ratio.
The design factors levels were coded -2 (low), 0 (central point), and +2 (high) (Table 1). Decolorization rate was optimized as a response. The dependence of the response, Y, on the design factors X1… Xn, is described by Eqs. (2, 3).
3. Results and Disscussion
3-1. Screening of decolorizing microorganism
First, a screening step was performed. Microbes that could grow on solid screening medium were rescreened according to their decolorizing capability in simulated wastewater. One fungus (num- bered XJ-2) with the maximum decolorizing rate (data not shown) was chosen as the target microbe. The decolorization rate was investigated throughout the growth of XJ-2. Results are shown in Fig. 2. Disperse blue was significantly decolorized at the logarith- mic phase (approximately 5-33 h) of XJ-2. The highest decoloriza- tion rate reached 88.4% at the stationary phase (growing time of 33-59 h).
3-2. Identification of decolorizing microorganism
The morphological characteristics of XJ-2 in the plate presented a loose structure with the separated vegetative hyphae, having a
Fig. 2. Growth curve and decolorization rate of XJ-2.
surface of grayish green. Electronic microscopic observation showed that part of the aerial hyphae formed some long and rough conidio- spores, at the top of which a nearly spherical shape or flask vesicle was produced. Numerous small terriers (usually double) were gen- erated by the spherical surface rough conidiospore (Fig. 3). That is, XJ-2 could belong to Aspergillus according to its morphological characteristics. The microbe was further identified by 18s rDNA.
The phylogenetic tree (Fig. 4) depicted that the sequence of XJ-2 matched the selected sequence from the GenBank database with 99% sequence identity. According to the homologous sequence, the microorganism was identified and named Aspergillus XJ-2 (A. XJ-2).
3-3. Optimization of culture conditions with RSM 3-3-1. CCRD design for conditions optimization.
From single-factor experiments, the pH of the original medium, growth temperature, carbon-to-nitrogen ratio, and rotation speed were selected as factors in the central composite experimental design (Table 1).
For statistical calculations, temperature (X1), rotation speed (X2), pH (X3) and carbon-to-nitrogen ratio (X4) were converted using the following equation:
(2)
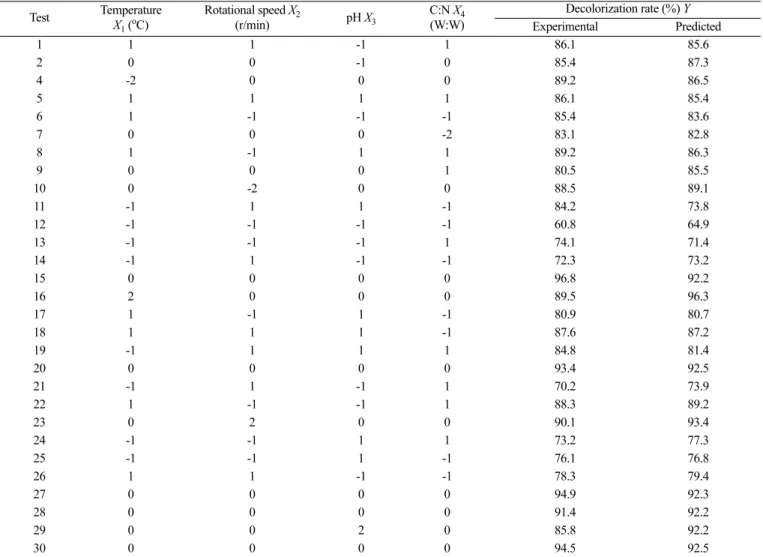
where X0 is the value of Xi at the center point, and δX presents the step of variables. Among 30 test points, 24 groups were the factorial experiments, and the other six groups were the center of test.
The test was repeated six times to estimate the test error. Through response surface analysis, results of the wastewater decolorization rate of A. XJ-2 are presented in Table 2.
Polynomial fitting regression was performed, with decoloriza- tion rate (Y) as the dependent variable and temperature (X1), rota- tion speed (X2), pH (X3), and carbon-to-nitrogen ratio (X4) as independent variables. The regression equation was established as follows:
Y = 0.92088 + 0.048000 x1+ 0.020444 x2+ 0.023944 x3 + 0.012889 x4+ 0.012125 x1x2- 0.021625 x1x3+ 0.005 x1x4 + 0.007125 x2x3- 0.019750 x2x4- 0.010500 x3x4- 0.0104221 x1x1 - 0.00842105 x2x2- 0.022921 x3x3- 0.083421 x4x4 (3) Reliability analysis of the regression equation indicated that the experimental data of the model had high reliability with R2 of 88.58% and could thus be used to explain and illustrate the model.
A lower value of CV indicated better stability of experiments. In sum, the regression equation was a good model for optimizing decolorization conditions of A. XJ-2.
3-3-2. Response analysis and interpretation
ANOVA of results was performed using DX 7 program 7.0, and the analysis results are shown in Table 3. Varieties X1 and X4X4 showed high significance in terms of decolorization rate. Varieties X2, X3, and X1X3 significantly affected decolorization rate. Table 3 also explains the relationship between varieties and decolorization rate. A higher F value of variety results in a more pronounced effect on decolorization rate. Temperature shows an extremely sig- nificant effect on decolorization rate (P < 0.01).
According to the fitting function, the contour maps were plotted on each of the two factors associated with decolorization rate.
When considering the relationship between the qualitative analysis of various factors and decolorization rate, two other factors were fixed, both with the “0” level of processing. Results are shown in Fig. 5. Temperature relative to decolorization rate impact is the xi=(Xi–X0)/δX
Fig. 3. Morphological characteristics of XJ-2 (a, Colony; b, Micrograph (400×); c, SEM images).
Fig. 4. Phylogenetic tree of decolorizing Microorganism.
most significant and exhibits steep performance curves. The effects of temperature, rotation speed, and pH on decolorization are evi-
dent. Contour shape could reflect the interaction strength. The con- tour shows that the interaction between temperature and pH was
10 0 -2 0 0 88.5 89.1
11 -1 1 1 -1 84.2 73.8
12 -1 -1 -1 -1 60.8 64.9
13 -1 -1 -1 1 74.1 71.4
14 -1 1 -1 -1 72.3 73.2
15 0 0 0 0 96.8 92.2
16 2 0 0 0 89.5 96.3
17 1 -1 1 -1 80.9 80.7
18 1 1 1 -1 87.6 87.2
19 -1 1 1 1 84.8 81.4
20 0 0 0 0 93.4 92.5
21 -1 1 -1 1 70.2 73.9
22 1 -1 -1 1 88.3 89.2
23 0 2 0 0 90.1 93.4
24 -1 -1 1 1 73.2 77.3
25 -1 -1 1 -1 76.1 76.8
26 1 1 -1 -1 78.3 79.4
27 0 0 0 0 94.9 92.3
28 0 0 0 0 91.4 92.2
29 0 0 2 0 85.8 92.2
30 0 0 0 0 94.5 92.5
Table 3. Regression analysis results
Sources of variation df SS (Sum of squares) MS (Mean squar) F (F-value) Pr> F (Prob>Fp-value)
X1 1 0.041 0.041 25.67 0.0001
X2 1 7.524E-003 7.524E-003 4.66 0.0476
X3 1 0.010 0.010 6.39 0.0232
X4 1 2.990E-003 2.990E-003 1.85 0.1938
X1X1 1 2.814E-004 2.814E-004 0.17 0.6824
X1X2 1 2.352E-003 2.352E-003 1.46 0.2463
X1X3 1 7.482E-003 7.482E-003 4.63 0.0481
X1X4 1 4.000E-004 4.000E-004 0.25 0.6260
X2X2 1 1.837E-004 1.837E-004 0.11 0.7406
X2X3 1 8.123E-003 8.123E-003 0.50 0.4892
X2X4 1 6.241E-003 6.241E-003 3.86 0.0682
X3X3 1 1.361E-003 1.361E-003 0.84 0.3732
X3X4 1 1.764E-003 1.764E-003 1.09 0.3126
X4X4 1 0.018 0.018 11.16 0.0045
model 14 0.18 0.013 7.88 0.0001 Significant
Lack of fit 10 0.023 2.257E-003 6.78 0.0238
pure error 5 1.665E-003 3.331E-003
Total deviation 29 0.2
significant (Fig. 5a).
3-4. Optimization results
The optimum conditions of the regression model in relation to the microorganism and wastewater decolorization were predicted as follows: temperature, 34.9oC; rotation speed, 177 r·min-1; pH, 5.2; and carbon-to-nitrogen ratio, 30:5.6. The theoretical decolor- ization rate of wastewater reached 95.7%. To test the reliability of RSM, the optimized decolorization conditions for wastewater were considered as: temperature, 35oC, rotation speed, 175 r·min-1; pH, 5.2; and carbon-to-nitrogen ratio, 30:5.5. The actual decolorization rate of A. XJ-2 was 94.8% in 48 h, which was slightly lower than the theoretical decolorization rate of 95.7%, under optimized con- ditions. This finding might be attributed to the mutual effects on
decolorization rate under actual operation conditions [18,22].
High decolorization efficiency is preferred for actual wastewa- ter treatment. As shown above, the decolorization rate of A. XJ-2 increased from 88.4% to 94.8% after the conditions were opti- mized by RSM, and decolorization time was decreased from 59 h to 48 h. The decolorization capability of A. XJ-2 within certain time was improved with RSM. This finding suggests that A. XJ-2 has potential for field applications.
Some other fungi, such as Phanerochaete chrysosporium, Pleu- rotus, Pycnoporus coccineus, and Lentinula, were also considered for the complete decolorization of anthraquinone dyes in industrial textile wastewater dyes. Approximately 40% COD and 50% color were degraded by Pycnoporus coccineus under culture conditions of 30oC for 21 d [19]. By contrast, XJ-2 showed high decoloriza- Fig. 5. Interaction of various factors under the analysis of response surface and contour map ((a) the Y = f (X1, X2) response surface and con-
tour analysis diagram, (b) the Y = f (X1, X3) response surface and contour analysis diagram, (c) the Y = f (X2, X3) response surface and contour analysis diagram, (d) the Y = f (X2, X4) response surface and contour analysis diagram).
emerging as a promising alternative to some old treatment sys- tems. One fungus was screened and identified as Aspergillus XJ-2 with good decolorization rate in this work also. Response surface methodology was one useful method to optimize the condition of decolorization rate. And the promising result obtained from it (more than 94.8% decolorization rate in 48 h) led us to study more about decolorization of Anthraquinone dye with A. XJ-2.
Acknowledgments
This work sponsored by the Fund of High-level Personnel from Shihezi University (NO. RCZX201121) is highly acknowledged, and authors are grateful to the environmental department research group for providing advice.
Nomenclatures
XJ-2 : Aspergillus XJ-2
RSM : Response Surface Methodology BOD : Biological oxygen demand COD : Chemical oxygen demand
NCBI : National Centre for Biotechnology Information CCRD : Central Composite Rotatable Design
CV : Coefficient of Variation ANOVA : Analysis of Variance
References
1. E. Sayan and M. E. Edecan, Ultrason. Sonochem., 15, 530 (2008).
2. D. P. Garcia, J. C. Francisco and B. Germán, J. Hazard. Mater.,
8. A. Srinivasan and V. Thiruvenkatachari, J. Environ. Manage., 91, 1915 (2010).
9. F. J. Deive, A. Dominguez, T. F. Barrio, Moscoso, P. Moran and M. A. Longo, J. Hazard. Mater., 182, 735 (2010).
10. I. A. Alaton, I. Kabdasli, B. Vardar and O. Tunay, J. Hazard.
Mater., 150, 166 (2008).
11. M. O¨z acar and I. A. Sengil, J. Hazard. Mater., 98, 211 (2003).
12. K. Papadopoulou, I. M. Kalagona, A. Philippoussis and F. Rigas, Int. Biodeterior. Biodegrad., 77, 31 (2013).
13. D. M. Cao, X. Xiao, Y. M. Wu, X. B. Ma, M. N. Wang, Y. Y. Wu and D. L. Du, Bioresour. Technol., 136,176 (2013).
14. X. M. Meng, G. F. Liu, J. T. Zhou and Q. S. Fu, Bioresour. Tech- nol., 151, 63 (2014).
15. Y. Y. Qu, S. G. Shi, F. Ma and B. Yan,Bioresour. Technol., 101, 8016 (2010).
16. Y. Y. Su, Y. F. Zhang, J. Wang, J. T. Zhou, X. B. Lu and H. Lu.
Bioresour. Technol., 100, 2982 (2009).
17. L. J. Zhao, J. T. Zhou, Y. H. Jia and J. F. Chen, J. Hazard. Mater., 181, 602 (2010).
18. M. Karatas, Y. A. Argun and M. E. Argun, J. Ind. Eng. Chem., 18, 1058 (2012).
19. M. Neifar, A. Jaouani, M. J. Martínez and M. J. Penninckx, J.
Microbiol., 50, 746 (2012).
20. A. R. Khataee, M. Zarei, M. Fathinia and M. Khobnasab Jafari, Desalination, 268, 126 (2011).
21. M. S. Ferhan, N. I. Santos, S. N. Melo and Y. M. Sain, World. J.
Microb. Biot., 29, 2437 (2013).
22. X. C. Jin and Y. Ning, J. Hazard. Mater., 26, 2870 (2013).