Print ISSN: 1738-3110 / Online ISSN 2093-7717 JDS website: http://www.jds.or.kr/
http://dx.doi.org/10.15722/jds.19.1.202101.27
The Effect of Managerial Ownership on Stock Price Crash Risk in Distribution and Service Industries*
Haeyoung RYU 1 , Soo-Joon CHAE 2
Received: September 14, 2020. Revised: December 12, 2020. Accepted: January 05, 2021
Abstract
Purpose: This study is to investigate the effect of managerial ownership level in distribution and service companies on the stock price crash. The managerial ownership level affects the firm’s information disclosure policy. If managers conceal or withholds business- related unfavorable factors over a long period, the firm’s stock price is likely to plummet. In a similar vein, management's equity affects information opacity, and information asymmetry affects stock price collapse. Research design, data, and methodology: A regression analysis is conducted using the data on companies listed on the Korea Composite Stock Price Index (KOSPI) between 2012–2017 to examine the effect of the managerial ownership level on stock price crash risks. Results: Logistic and regression results indicate that the stock price crash risk was reduced as managerial ownership levels are increased. The managerial ownership level has a significant negative coefficient on stock price crash risk, negative conditional return skewness of firm-specific weekly return distribution, and asymmetric volatility between positive and negative price-to-earnings ratios. Conclusions: As the ownership and management align, the likeliness of withholding business-related information is reduced. This study’s results imply that the stock price crash risk reduces as the managerial ownership level increases because shareholder and manager interests coincide, thereby reducing information asymmetry.
Keywords: Managerial Ownership, Information Asymmetry, Stock Price Crash Risk, Distribution and Service Industries JEL Classification Code: D52, G30, M41
1. Introduction 12
In November 2018, Yonhap News reported that the stock price of Walmart, a leading U.S. retailer, had been on the decline for four consecutive days. This report highlighted that the stock price crashed, although Walmart’s
* This work was supported by the Ministry of Education of the Republic of Korea and the National Research Foundation of Korea(NRF-2020S1A5A8041170)
This study was supported by 2017 Research Grant from Kangwon National University(No. 520170125)
1 First Author. Assistant Professor, Department of Business Administration, Hansei University, South Korea.
Email: [email protected]
2 Corresponding Author. Associate Professor, Department of Business Administration & Accounting, Kangwon National University, South Korea. Email: [email protected]
ⓒ Copyright: The Author(s)
This is an Open Access article distributed under the terms of the Creative Commons Attribution Non-Commercial License (http://Creativecommons.org/licenses/by-nc/4.0/) which permits unrestricted noncommercial use, distribution, and reproduction in any medium, provided the original work is properly cited.
adjusted earnings per share exceeded market expectations and that it raised its sales prospects. The report mentions that other retailers who reported good performances also experienced such stock price crashes. Additionally, on August 17, 2017, Asia Economic news also reported the unexpected stock price crashes of E-Mart and Lotte Shopping despite E-Mart reporting a good performance in the second-quarter and Lotte Shopping making a positive resolution for the issue of transformation into a holding company.
Why do stock prices fall despite the remarkable performances by distribution companies? As stock prices are calculated based on current and future cash flows, the current and future performances are correlated with the stock price. Hence, it is necessary to focus on the causes of stock price crashes rather than the factors that affect the calculation of the stock price.
However, a stock price crash refers to the phenomenon
in which the stock price, which has been set high, sharply
declines. As information opacity continues for a long period,
if the company’s information is not properly reflected in the stock price, the stock price is bound to be positioned higher than its intrinsic value. The accumulated opaque information spreads to the market at the threshold, at which the stock price falls sharply (Jin & Myers, 2006).
This study investigates the effect of the managerial ownership level of distribution and service companies on stock price crashes. The size of managerial ownership induces two conflicting effects, namely, the incentive alignment effect and the entrenchment effect (Morck, Shieifer & Vishny, 1988). The incentive alignment effect is the theory that states that the incentive for managers to act in a direction consistent with the interests of external shareholders increases as the managerial ownership increases. The entrenchment effect is the theory that states that the managers with high levels of ownership pursue personal interests based on the strong control over companies. According to the convergence of interest hypothesis, the interests of managers and external shareholders coincide as the managerial ownership increases, implying that managers want to reduce the information asymmetry with external shareholders by actively disclosing information about the companies.
However, according to the entrenchment hypothesis, managers engage in opportunistic behaviors for personal interests as the managerial ownership increase, implying that managers do not disclose business-related unfavorable factors externally.
The level of managerial ownership affects the firm’s information disclosure policy. If a manager, an insider of the firm, conceals or withholds business-related unfavorable factors over a long period, the firm’s stock price is likely to plummet. Hence, this study seeks to verify the effect of managerial ownership on the stock price crash phenomenon.
The remainder of this study is organized as follows.
Section 2 reviews the theories associated with this study and sets up the research hypothesis. Section 3 selects a sample for validating the hypothesis after establishing the validation model. Section 4 presents the results of empirical analysis and describes the interpretations. Lastly, Section 5 summarizes the study and describes its contribution.
2. Theoretical Background and Research Hypothesis
2.1. Managerial Ownership
The early studies on ownership structure support the convergence of interest hypothesis, which states that the interests of shareholders and managers converge and that the value of the firm increases as the managerial ownership
increases. Managers make decisions to increase shareholders’ wealth because managers must bear the consequences of circumstances in which their shares are increased, and the value of the firm declines (Jensen &
Meckling, 1976). Zajac and Westphal (1994) argue that the interests of shareholders and managers converge as the managers’ ownership increases, leading to a reduction of agency cost and an increase in the firm’s performance.
Bilter (2005) analyzes the relationship between managers’
efforts and wealth and found that managerial ownership increases with the value of the firm.
However, there exists the managerial entrenchment hypothesis, which states that managers pursue personal interests rather than maximizing the value of firms as the managerial ownership increases, thereby leading to a decline in the firm’s value. Demsetz (1983) argues that managers prioritize personal interests rather than pursuing companies’ interests because they would be empowered and free, to a certain degree, from threats such as hostile mergers and acquisitions (M&A) if the managerial ownership reaches above a certain level. Fama and Jesnsen (1983) argue that managers can be free from the pressure of governance mechanisms by increasing their ownership, thereby pursuing personal interests rather than making efforts to maximize shareholders’ wealth and firms’ values.
Stulz (1988) notes that the increase in the shares owned by the manager strengthens their authority and weakens the monitoring over them, eventually leading managers to pursue personal interests.
2.2. Stock Price Crash Risk
Stock price crash risk has been defined in various ways
by preceding literature. DeFond, Hung, Li, and Li (2015)
define stock price crash as “the frequency at which extreme
negative price-to-earnings ratio appears.” Chen, Hong, and
Stein (2001) identify the stock price crash risk by using the
price-to-earnings ratio’s negative skewness, the third
moment of the price-to-earnings ratio. Hutton, Marcus, and
Tehranian (2009) estimate the stock price crash risk as the
price-to-earnings ratio’s average standard deviation
multiplied by 3.09—namely the stock price fluctuation that
belongs to the bottom 0.1% distribution of the price-to-
earnings ratio—and interpret it as the same as tail risk. The
tail risk is a concept from the normal distribution of
statistics, where the values are most likely to occur near the
mean value because they are distributed in a symmetrical
bell shape around the mean value. In other words, the stock
price crash, a type of tail risk, is the risk that is hard to
predict in the financial and economic market and is an
important risk to be considered by market participants
because, once it occurs, it has a significant impact on
investment portfolios by inducing very low price-to-
earnings ratio.
Risk-averse investors repulse stocks with a high risk of crashing and require a high premium. As investors are more sensitive to risks associated with a fall than a rise in stock price, the stock price responses to negative information disclosure are asymmetrically distributed (Kothari, Leone, & Wasley, 2005). In the traditional capital asset pricing model (CAPM), it is assumed that price-to- earnings ratios are normally distributed. Thus, the risk can be dispersed through diversification. In reality, however, price-to-earnings ratios show negative skewness in the event of the stock price crash, making it difficult for investors to resolve risks through diversification (Ibragimov
&Walden, 2007). In other words, as it is difficult for investors to disperse the stock price crash risk through diversification on their own, it is necessary to conduct a preliminary analysis of which companies experience stock price crashes.
Recent studies highlight the agency problem, between managers and shareholders, as the cause for stock price crashes (Hutton, Marcus, & Tehranian, 2009). While pursuing private interests, managers are incentivised to conceal or delay the disclosure of the company’s information. If such a situation continues for a long period, the company’s information would not be accurately reflected in the stock price, causing the stock price to be set high. Jin and Myers (2006) explain that stock price crashes occur when the accumulated unfavorable factors reach their limit and are poured into the market. This study intends to expand the preceding research by analyzing the effect of the distribution company's managerial equity on the stock price plunge.
2.3. Research Hypothesis
According to the disclosure theory, by providing business-related information to external investors, managers prevent the adverse selection problem between themselves and investors (Verrecchia, 2001). However, in reality, where information asymmetry exists between managers and external stakeholders, it is possible for managers not to fully disclose or delay the business-related information due to moral hazard, and if the information is negative (Healy & Palepu, 2001). Managers can conceal business-related negative information, and if such negative information is concealed over a long period, the stock price will be set higher than its expected value. When such concealed negative information goes beyond the critical point, it will dissipate to the market, and the stock price that was once highly valued will decline sharply (Jin & Myers, 2006).
The studies on the stock price crash caused by concealing negative information can be approached from
the perspective of the agency problem between managers and shareholders (Hutton, Marcus, & Tehranian, 2009). As managers own more shares, it is less likely that the agency problem between managers and shareholders will occur. In other words, since the interests between shareholders and managers coincide, it is less likely that managers make decisions against shareholders’ intent and that managers hide business-related information from the outside world.
Therefore, by owning more shares, managers develop a sense of ownership provide both quantitative and qualitative business-related information to the outside world to build a better corporate image and maintain reputation. However, if managers become interested in pursuing personal interests as their managerial ownership increases, they prefer to withhold or conceal information on unfavorable factors from the outside the company.
Therefore, we arrive at the following research hypothesis as the form of the null hypothesis:
H1: The level of managerial ownership is not related to the stock price crash risk.
3. Research methodology
3.1. Estimation of Stock Price Crash Risk
This study seeks to verify the effect of managerial ownership on stock price crash risk. First, the stock price crash risk is estimated using the firm-specific weekly return net the market effect. The firm-specific weekly return is estimated using the regression equation (1) suggested by Chen, Hong and Stein (2001).
𝛾 ,
𝛼 𝛽 𝛾 , 𝛽 𝛾 , 𝛽 𝛾 , 𝛽 𝛾 ,
𝛽 𝛾 , 𝜖 , 1
The dependent variable 𝛾 , in the regression equation
(1) refers to j firm’s weekly return in t year and the
independent variable 𝛾 , refers to the value-weighted
market index in t years. The five weeks market returns from
t-2 to t+2 periods are included in the regression equation to
control for non-synchronous trading and simultaneously
estimate only the changes in the firm-specific weekly
returns. As the residuals i,t estimated in the regression
equation (1) have a skewed distribution, we added 1 to the
residuals as shown in equation (2) and considered the
natural log to estimate the firm-specific weekly returns
(Hutton, Marcus, & Tehranian, 2009; Kim, Li, & Zhang,
2011: Chae, Nakano, & Fujitani, 2020).
𝑊 , ln 1
e , 2 Based on the estimated firm-specific weekly returns,
this study measures the stock price crash risk in three ways, namely the stock price crash occurrence (CRASH), negative conditional return skewness (NSKEW), and down- to-up volatility (DUVOL).
First, the CRASH variable, the stock price crash occurrence, is the dummy variable that indicates whether the stock price crash occurred in an individual firm. If a firm’s weekly returns reflect in the bottom 0.1% of its distribution in t years, that firm is considered to have experienced a stock price crash. The mean value of the bottom 0.1% of the distribution of the firm-specific weekly return is set as the cut-off. This is because it is extremely unlikely that the value will be in the bottom 0.1% of the distribution of the mean weekly returns (Hutton, Marcus &
Tehranian, 2009; Kim, Li & Zhang, 2011). Specifically, if the firm-specific price-to-earnings ratio is smaller than the standard deviation of the t-years average price-to-earnings ratio multiplied by 3.09, the associated firm is considered to have experienced stock price crashes, and one is assigned to the CRASH variable.
Second, the NSKEW variable is a continuous variable that exhibits the degree of stock price crash risk. The higher the firm’s stock price crash risk, the more left-skewed the weekly returns are distributed. Hence, stock price crash risk can be high if its skewness is greater. Thus, the variable NSKEW is defined as the negative skewness of firm- specific weekly price-to-earnings ratio, and we follow the research method mentioned by Chen, Hong and Stein (2001) to estimate the returns using the equation (3),
𝑁𝑆𝐾𝐸𝑊 𝑛 𝑛 1 ∑ 𝑊
,/ 𝑛 1 𝑛 2 ∑ 𝑊
,(3) where, n is the number of observations of the t-year’s weekly returns, and W is the firm-specific weekly returns.
We take negative value for convenience, considering the interpretation that the risk of a stock price crash increases as the value of skewness increases.
The third measure of the stock price crash risk, DUVOL, is measured as the asymmetric volatility between positive and negative price-to-earnings ratios, as shown in equation (4). The DUVOL variable was estimated by dividing the sample into the “down” weeks, where individual firm’s stock and j’s firm-specific weekly returns are lower than the annual average price-to-earnings ratio, and the “up” weeks, where the returns are higher than the annual average price- to-earnings ratio. Additionally, we divide the standard deviation of the sample where firm-specific weekly returns
are lower than the annual average price-to-earnings ratio by the standard deviation of the sample where firm-specific weekly returns are higher than the annual average price-to- earnings ratio, and we take the log of the resulting values.
𝐷𝑈𝑉𝑂𝐿 log 𝑛 1 𝑊
,𝑛 1 𝑊
,4
3.2. Estimation of Managerial Ownership
The current Commercial Act divides directors into executive directors, outside directors, and other non- executive directors (Article 382 paragraph 3). Executive directors are those who are engaged in regular businesses.
They regularly commute to work and hold positions related to management practices, such as president and vice- president. Their business cards mainly use titles such as president, vice president, and executive director. For reference, the CEO must be an executive director, and if there is only one director, the individual must be an executive director as they represent the company. These individuals cannot be an outside director or non-executive director.
Directors who are not executive directors (i.e., board members) all become non-executive directors. Further, the Commercial Act classifies the non-executive directors as outside directors if they meet independence requirements from the major shareholders or board members. Otherwise, they are classified as non-executive directors.
This study collected the data on managerial ownership from TS2000, the database provided by the Korea Listed Companies Association. According to this data, the positions and titles of managers in the distribution and service sectors vary widely. Thus, this study estimates managerial ownership by collecting the titles associated with executive directors in each company and adding up the shares owned for each position.
3.3. Research Model
In this study, we validate the effect of managerial ownership on stock price crash risk by using logistic and linear regression models in which CRASH, NSKEW, and DUVOL—variables that measure stock price crash risk—
are included as the dependent variables, and managerial
ownership is included as an independent variable. In
addition, control variables, introduced in Chen, Hong and
Stein (2001) and Hutton, Marcus and Tehranian (2009), that
affect stock price crash risk is included in the model.
𝐶𝑅𝐴𝑆𝐻
,, 𝑁𝑆𝐾𝐸𝑊
,, 𝐷𝑈𝑉𝑂𝐿
,𝛾 𝛾 𝐶𝐸𝑂𝑆𝐻𝐴𝑅𝐸
,𝛾 𝑆𝐼𝑍𝐸
,𝛾 𝐿𝐸𝑉
,𝛾 𝑀𝐵
,𝛾 𝑅𝑂𝐴
,𝛾 𝑆𝐼𝐺𝑀𝐴
,𝛾 𝑅𝐸𝑇
,𝛾 𝐴𝐵𝑆𝐷𝐴
,𝑌𝐸𝐴𝑅 𝐼𝑁𝐷
𝜖
,5
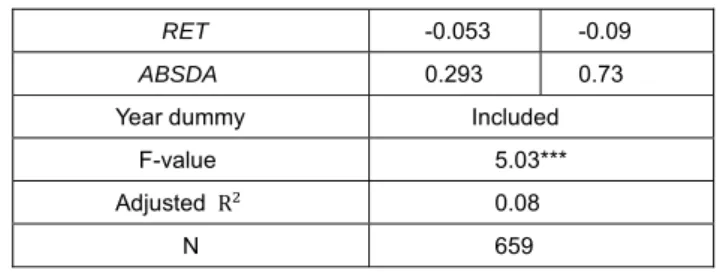
The variable of interest for testing the hypothesis of this study is CEOSHARE, which indicates managerial ownership. If the coefficient 𝛾 is significantly negative; it is noted that the stock price crash risk decreases as the level of managerial ownership increases. Hutton, Marcus and Tehranian (2009) report that the risk of stock price crash increases as the quality of financial reporting decreases.
Hence, this study includes the absolute value of discretionary accruals (ABSDA), estimated from the performance-adjusted model in Kothari, Leone and Wasley (2005). More specifically, ABSDA is estimated through equation (6). There are two types of earnings adjustment, an upward adjustment and a downward adjustment. Therefore, the absolute value was used to determine the size of the earnings adjustment.
TA
i,t/A
i,t-1= β
0+ β
1(1 / A
i,t-1) + β
2[(∆S
i,t- ∆AR
i,t) / A
i,t-1] + β
3PPE
i,t/ A
i,t-1+ β
4ROA
i,t+ ε
i,t(6)
TAi,t = Net income - cash flow from operating activities;
Ai,t-1 = Total assets;
ΔSi,t = Changes in sales;
ΔARi,t = Changes in accounts receivable;
PPEi,t = Tangible assets – land - construction in progress;
ROAi,t = Net income/total assets;
ε = Residuals; and
i,t