• 검색 결과가 없습니다.

Bank-Specific Determinants of Loan Growth in Vietnam: Evidence from the CAMELS Approach

N/A
N/A
Protected

Academic year: 2021

Share "Bank-Specific Determinants of Loan Growth in Vietnam: Evidence from the CAMELS Approach"

Copied!
11
0
0

로드 중.... (전체 텍스트 보기)

전체 글

(1)

Print ISSN: 2288-4637 / Online ISSN 2288-4645 doi:10.13106/jafeb.2020.vol7.no9.179

Bank-Specific Determinants of Loan Growth in Vietnam:

Evidence from the CAMELS Approach*

Hoang Dieu Hien NGUYEN

1

, Van Dan DANG

2

Received: July 03, 2020 Revised: July 19, 2020 Accepted: August 10, 2020

Abstract

The paper empirically examines the bank-specific determinants of loan growth in the Vietnamese banking system for the period from 2007 to 2019. We approach the CAMELS framework and employ the dynamic panel regression to determine the effects of each CAMELS factor on bank lending. To ensure the robustness of results, we also use alternative definitions of the variables and different specifications with and without full sets of CAMELS components. With these settings, we display multiple important results. (i) We find that a large capital buffer tends to boost bank lending expansion faster. (ii) High asset quality might positively contribute to high loan growth; in other words, banks subject to high credit risk are discouraged from making loans. (iii) Less efficiently managed banks are more likely to adopt an aggressive lending strategy, highlighting the moral hazard incentives of Vietnamese banks. (iv) More profitable banks with excellent competitive advantages could expand their lending activities to a larger extent. (v) Liquidity is positively related to the loan growth of banks. (vi) Perceived interest rate risk tends to suppress loan growth since interest-rate-sensitive banks might be concerned about the adverse effects of unpredictable adverse changes in interest rates in the future.

Keywords: CAMELS, Capital, Liquidity, Loan Growth, Management Efficiency JEL Classification Code: G20,G21, G28

2019). It is further essential to understand determinants of loan growth since it has been a critical driver of the economic growth in many emerging economies, where the capital market is somewhat immature and the burden is placed on the banking system (Vo, 2018).

Researchers have analyzed bank lending behavior theoretically and empirically. They frequently combine both internal and external factors to find the most comprehensive answer. However, potential determinants of bank lending remain unclear and appear to be complicated. Moreover, previous studies have generally not approached the problem in a systematic manner; instead, they mainly exploit each individual ingredient in different markets. Hence, to fill the literature gap on the current topic, we systematically focus on exploring multiple bank-specific characteristics that drive bank lending by using the CAMELS framework.

Accordingly, we employ the research data of Vietnamese commercial banks from 2007 to 2019. This research period features various fluctuations in the credit supply of the banking sector in Vietnam, which provides a very suitable context for the analysis.

“CAMELS” stands for capital, asset quality, management, earnings, liquidity, and sensitivity to market

1. Introduction

Studying potential determinants of bank lending has been a major research stream in the literature. This issue especially attracts increasing attention from academics and policymakers after numerous markets experienced considerable credit booms during the last decades (Dang,

*Acknowledgements:

The paper is part of the doctoral dissertation carried out by the first author Hoang Dieu Hien Nguyen at theBanking University of Ho Chi Minh City under the supervision of Associate Professor Van Dan Dang.

1

First Author. Lecturer, Department of Accounting and Auditing, University of Economicsand Law, Vietnam National University - Ho Chi Minh City, Vietnam. Email: [email protected]

2

Corresponding Author. Lecturer, Department of Finance, Banking University of Ho Chi Minh City, Vietnam[Postal Address: 36 Ton That Dam Street, Nguyen Thai Binh Ward, District 1, Ho Chi Minh City 700000, Vietnam] Email: [email protected]

© Copyright: The Author(s)

This is an Open Access article distributed under the terms of the Creative Commons Attribution Non-Commercial License (https://creativecommons.org/licenses/by-nc/4.0/) which permits unrestricted non-commercial use, distribution, and reproduction in any medium, provided the original work is properly cited.
(2)

risk. Since 2019, the State Bank of Vietnam (SBV) issued a bank rating framework based on CAMELS components.

This international approach is meaningful to banks in assessing and improving their performance and helps the regulators carry out their inspection and supervision functions. The CAMELS parameters are thought to be suitable indicators to evaluate the financial soundness of the banking sector. Theoretically, many studies also show that CAMELS components have substantial impacts on bank lending (see section 2 for a review). From the viewpoint of the SBV, CAMELS is a set of regulatory management tools. As for banks themselves, it displays the standards for them to focus on in order to improve the efficiency and capacity of the business, in which loan growth is a crucial priority.

The paper contributes to the existing literature in some directions. First, it systematically examines the determinants of bank lending using bank balance sheet indicators inspired by the CAMELS framework. As far as we know, this work is the first to make use of the CAMELS rating system’s spirit in this way. Second, this study enriches the literature strand on the impacts of rarely discussed factors, such as management efficiency and sensitivity to market risk, on bank lending. Though these are the critical drivers of loan growth theoretically, the empirical work done to verify their impacts has been very limited so far. Third, the study offers more insights into bank lending behavior in a small emerging market, where the economic development heavily depends on the funding sources from banks. Previous studies have mainly focused on developed markets with rich databases and leading positions that dominate the global financial market.

2. Literature Review

This section reviews the current debates, both theoretically and empirically proposed, in the literature on the determinants (individual CAMELS indicators) of bank lending.

2.1. Capital

There are two strands of theories on how capital influences bank lending. According to the “financial fragility-crowding out” hypothesis, Berger and Bouwman (2009) argue that shareholders are more reluctant to offer loans when they invest more money in their banks. They also become more cautious with their investment decisions. Thus, more-capitalized banks may supply fewer loans than less- capitalized banks. Conversely, the impacts of capital on bank

lending are positive according to the “risk absorption” theory.

In this vein, holding a larger capital buffer improves the risk- bearing capacity and protects banks against any potential loss (Coval & Thakor, 2005; Repullo, 2004). So, banks will gain more incentives to adopt a faster loan growth strategy.

A large body of empirical studies has explored the effects of capital on bank lending. In early studies, many authors reveal that an increase in bank capital could result in faster loan growth to various degrees (Bernanke, Lown, &

Friedman, 1991; Hancock & Wilcox, 1994). In more recent works, using the samples of the US, Europe, and even the globe, Carlson, Shan, and Warusawitharana (2013), Louhichi and Boujelbene (2017), and Košak, Li, Lončarski, and Marinč (2015) respectively observe the positive relationship between bank capital and lending behavior. However, some mixed conclusions also emerged. Kim and Sohn (2017) claim that the US banks with more capital only expand their lending aggressively after they store enough liquidity. Focusing on banks in the euro area, Roulet (2018) finds that capital ratios induce negative impacts on retail lending in the post-2008 financial crisis time.

2.2. Asset Quality

As suggested in the literature, asset quality is considered as the key factor driving bank lending. A bank suffering high credit risk tends to concentrate on reinforcing risk supervision rather than granting increased loans (Altunbas, Gambacorta, & Marques-Ibanez, 2010; Bernanke &

Blinder, 1988). Higher bad debt and loan loss provision ratios could cause greater caution among lenders, which possibly leads to tightened lending standards and thus diminishes lending activities (O’Brien & Browne, 1992).

In this regard, Heid and Krüger (2011) attribute the decline in lending segments to banks’ unwillingness to disburse loans due to the deterioration in loan quality. Moreover, this deterioration potentially puts numerous pressure on bank return, bank capital, and mitigate banks’ desire and resources to lend to the economy (Ben Naceur, Marton, &

Roulet, 2018).

A few empirical documents have directly determined

the impact of asset quality on loan creation thus far. Using

bank-level data, Delis, Kouretas, and Tsoumas (2014)

reveal that lending of US banks falls when customers are

anxious, especially when banks are subject to high credit

risk. Capturing bank loan quality by loan loss provisions,

Adesina (2019) suggests that the poor performance of asset

portfolios hampers banks’ capacity to make loans. In another

route, Tracey and Leon (2011) figure out that banks react

differently to the non-performing loan ratio depending on

(3)

a certain threshold, particularly risky banks with the non- performing loan ratio above the threshold considerably cut their lending. Contrary to these works highlighting the adverse effect of credit risk on lending, Aysan and Disli (2019) document that a rise in non-performing loans does not modify bank lending activities in Turkey. The authors explain that diversified funding could help banks survive the reduced returns from deteriorated investments.

2.3. Management Efficiency

As Berger and DeYoung (1997) hypothesize, low cost efficiency is the primary signal of poor management systems, in which managers with limited experiences and expertise in credit scoring could easily grant a high volume of loans. Furthermore, according to the “moral hazard” hypothesis, bank managers might gain incentives to pursue more risky investments, especially when banks are more inefficient (Jeitschko & Jeung, 2005). So, poorly managed banks with more moral hazard incentives are more likely to select an aggressive lending schedule. As an alternative hypothesis, Berger and DeYoung (1997) claim that fewer operating expenses are sufficient to sustain the same volume of loans for the case of well-managed banks.

Thus, banks may be motivated to improve revenues by raising the speed of loan growth thanks to the abundant resources.

Additionally, the present issue is closely related to the segment focusing on the pass-through mechanism of cost efficiency to interest rates on loans. Prior scholars have demonstrated that more efficient banks typically charge lower markups, thus mitigating lending rates for their customers (Gambacorta, 2008; Havranek, Irsova, &

Lesanovska, 2016). In this respect, decreased borrowing costs may encourage loan demand (Ben Naceur et al., 2018).

2.4. Earnings

Theoretically, the effect of bank profitability on lending is ambiguous. Some theoretical models indicate that banks could decrease the asymmetric information problem if they gain more profits (Holmstrom & Tirole, 1997; Mankiw, 1986). In this regard, these banks could take good use of competitive advantages in attracting funding from depositors and shareholders. As a result, this leads to a more substantial expansion in lending activities of high- profit banks, which are always ready with various loanable funds. Also, Dell’Ariccia and Marquez (2006) claim that banks might relax their lending standards or even lending

rates thanks to better comparative advantages in order to expand their lending segments. In sharp contrast, how well banks make earnings can lead to changes in risk appetite and business strategies. According to Rajan (2006), higher returns discourage banks from “searching for yield”, thus these banks become more reluctant to offer loans.

Moreover, if the banking sector exhibits high competition, lower interest margins could result in higher loan growth (Laidroo, 2010).

The empirical analysis of bank earnings and loan growth is limited and should be extended. Using a large sample of 600 listed banks worldwide, Nier and Zicchino (2006) find that bank return (captured by return on equity) positively drives loan growth. The subsequent work of Bustamante, Cuba, and Nivin (2019) confirms this result for the banking system in Peru. Employing return on assets as a proxy for bank profits, Adesina (2019) reveals a pattern that challenges those obtained previously. Concretely, the author shows the negative linkage between bank profits and loan growth and interprets it by the mechanism that banks may cut loan supply while seeking a higher rate of return. Nevertheless, it should be noted that bank earnings are not the primary concern of these prior works.

2.5. Liquidity

The precautionary motive could explain why highly liquid banks could stimulate their lending. Gennaioli, Martin, and Rossi (2014) propose a model showing that banks optimally opt to store liquidity by purchasing liquid assets to finance investments in the future. Furthermore, as it is difficult to disburse funds immediately after banks collect them from depositors, banks may temporarily invest in liquid asset sources that they could substitute by loans later (Broner, Erce, Martin, & Ventura, 2014).

However, Cornett, McNutt, Strahan, and Tehranian (2011) suggest that banks have increased their liquidity positions to protect them from liquidity risk during stressed times, thereby curtailing investments in new loans. Former empirical studies usually apply assets and liabilities ratios to explore the association between liquidity positions and bank loan growth (Berrospide & Edge, 2010; Roulet, 2018). The results emphasize that storing more liquidity is a great motivation for banks to expand lending subsequently.

2.6. Sensitivity to Market Risk

There exists little theoretical and empirical investigation

on how bank lending responses to the sensitivity to market

(4)

risk. Focusing on a smaller scope, several theoretical documents suggest that more exposures to interest rate risk make lending activities more sensitive to shocks in interest rates (Van den Heuvel, 2002). Banks are concerned that in the presence of unpredictable adverse changes in interest rates, a banking profile with high interest rate risk might cause potential losses and deplete bank equity capital.

Since this source of funding is costly, banks may choose to cut lending to comply with regulators’ safety obligations.

Conducting a rare empirical analysis on the topic, Beutler, Bichsel, Bruhin, and Danton (2020) find evidence in favor of this notion. Precisely, they conclude that interest rate risk explains the decline in the cumulative loan growth of Swiss banks from 2001Q2 to 2013Q3.

3. Data and Research Methods

3.1. Model, Variables, and Estimation Technique To investigate the determinants of bank lending for Vietnamese commercial banks, we approach the dynamic panel model that is widely employed in the banking literature, especially in the stream focusing on bank lending behavior (e.g., Dahir, Mahat, Razak, & Bany-Ariffin, 2019; Delis et al., 2014; Vo, 2018, among many others) CEOs (firms.

Hence, our estimation equation is specified as follows:

Loan growth

i,t

= α

0

+ α

1

× Loan growth

i, t – 1

+ α

2

× CAMELS

i, t – 1

+ α

3

× Macro

t

+ u

i,t

(1)

where the dependent variable Loan growth

i,t

is the annual percentage change of gross customer loans by bank i in year t. We do not consider loans to other entities such as the government or financial institutions due to the heterogeneity in lending regimes and incentives. CAMELS is a vector of bank-specific factors defined using the CAMELS components. Macro is a vector of macroeconomic variables to control the external environment, including the business cycle of the economy (the growth rate of GDP) and the inflation (the annual rate of inflation). u

i,t

is the error term.

The lagged dependent variable is inserted on the right side of the equation to capture the dynamic feature of bank lending. Following Adesina (2019), Ben Naceur et al.

(2018), and Roulet (2018), we take the one-period lags of all bank-specific variables since bank lending cannot respond immediately to changes in bank balance sheets.

Regarding our CAMELS explanatory variables of interest, we measure them in the following ways:

• Capital is captured by the ratio of equity to total assets (Dang, 2020). This ratio is the traditional measure for bank capital strength. Though other risk-weighted measures such as the capital adequacy ratio could

better represent bank capital safety, its data remain inaccessible in the situation of Vietnamese banks.

• Asset quality is approached from the aspect of credit portfolio quality. As a common practice, we apply the loan loss provisions and non-performing loans as shares of gross customer loans to gauge bank asset quality (Le & Diep, 2020). The higher these measures are, the poorer the asset quality is.

• Management is proxied in the dimension of cost management efficiency. We use two criteria, namely, operating expenses/total assets and non-interest expenses/total revenues (De Graeve, De Jonghe, &

Vennet, 2007; Fiorentino, Karmann, & Koetter, 2011).

These ratios reflect how efficient banks manage their costs corresponding to their assets and revenues. The higher the cost ratio is, the less efficient the bank management is.

• Earnings are displayed by the most common indicators, namely, return on assets (ROA), return on equity (ROE), and net interest margin (NIM)(Dao & Nguyen, 2020; Khanifah, Hardiningsih, Darmaryantiko, Iryantik, &Udin, 2020; Qayyum& Noreen 2019).

• Liquidity is calculated using two ratios, namely, liquid assets/total assets and loans/deposits (Dang, 2019). In some detail, liquid assets contain cash and deposits at the central bank and other financial institutions. We should also notice that the ratio of loan to deposits is the inverse measure of liquidity positions.

• Sensitivity to market risk is taken into account by the category of interest rate risk due to data scarcity (Gomez, Landier, Sraer, & Thesmar, 2020).

Empirically, we approximate this respect by the difference between rate-sensitive assets and rate- sensitive liabilities relative to total assets. The gap indicates the extent to which banks’ balance sheets are sensitive to changes in interest rates.

With the dynamic model specification proposed, we employ the two-step system GMM estimator to yield efficient results (Arellano & Bover, 1995; Blundell & Bond, 1998; Roodman, 2009). This estimator could well deal with the endogeneity problem via lagged variables in levels and differences as instruments, which are available inside the model. The consistency of the GMM estimator could be validated by two sets of conditions for the suitability of the instrument set and the second-order autocorrelation in the disturbance. Hence, we conduct the Hansen test for the former and the Arellano-Bond test for the latter.

3.2. Data

We manually collect the research data from Vietnamese

commercial banks’ financial reports as our analysis

(5)

requires almost all the information on balance sheets. We obtain macroeconomic data from the World Development Indicators database. For the sample of commercial banks, we exclude those that are subject to special control or acquired entirely by the central bank as these banks exhibit different operation strategies and face strict constraints on their activities. Banks that do not meet our information criteria required for the calculation of specific variables will also be deleted. As a result, our final unbalanced panel dataset consists of 31 commercial banks from 2007 to 2019, covering approximately the entire banking system in Vietnam. Depending on individual variables constructed, the number of observations varies between 340 and 384 bank-year observations. To mitigate the impacts of extreme outliers, we winsorize all bank-specific variables at the 2.5th to 97.5th percentiles.

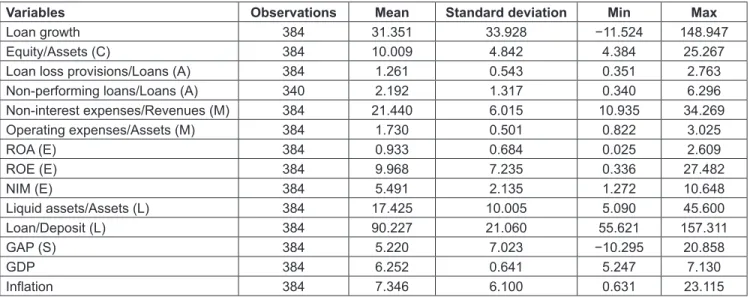
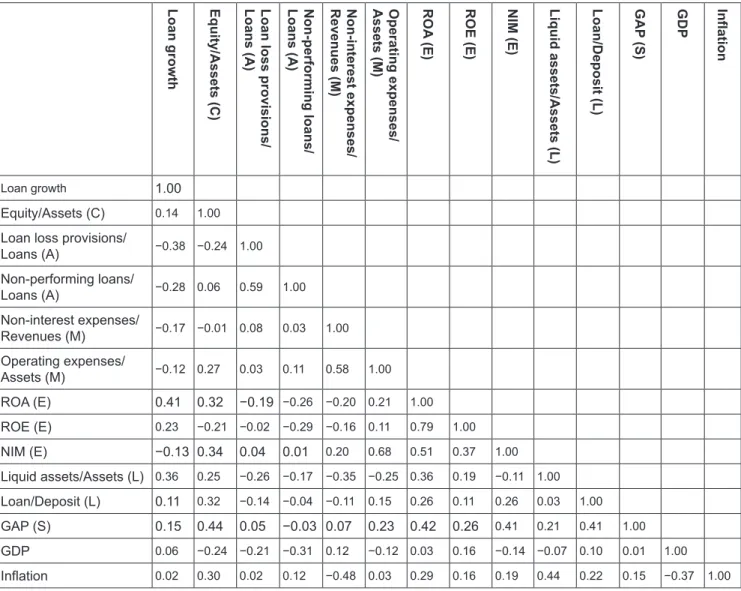
Table 1 presents the summary statistics, while Table 2 shows the correlation between each pair of variables.

Vietnamese banks experienced a significant lending expansion over the period 2007–2019, illustrated by the average growth rate of customer loans equaling to 31.351%

per year. The statistical distribution (large standard deviations and gaps between extreme values) of lending, along with other variables capturing CAMELS components, indicates that the bank sample is heterogeneous enough to produce efficient estimates for the decision-making purpose.

Moving on to the pairwise correlation matrix, we are confident that our selected model rules out the severe multicollinearity problem as there are only low correlations among explanatory variables of different CAMELS components. Besides, high correlations of variables proxying

the same aspect (e.g., asset quality or bank earnings) justify our setting when choosing them as alternative measures. As a note, we separate these variables in regressions.

4. Results

To check the estimates’ sensitivity, we first run regressions for each CAMELS component with macroeconomic control factors, and then we incorporate all CAMELS components into regressions. For brevity, the variables of interest capturing the same aspect with insignificant coefficients will not be used in the later stage.

As expected, we observe the persistence of loan growth, displayed by the consistently significant coefficient on the lagged dependent variable across all regressions. It is necessary to look into the results of diagnostic tests in the system GMM estimator. The Hansen test lends support to the overidentifying restriction, thus validating the choice of the instruments. The AR(2) test exhibits evidence in favor of the absence of the second-order autocorrelation in the disturbance. These results justify the application of the dynamic GMM estimator in this study.

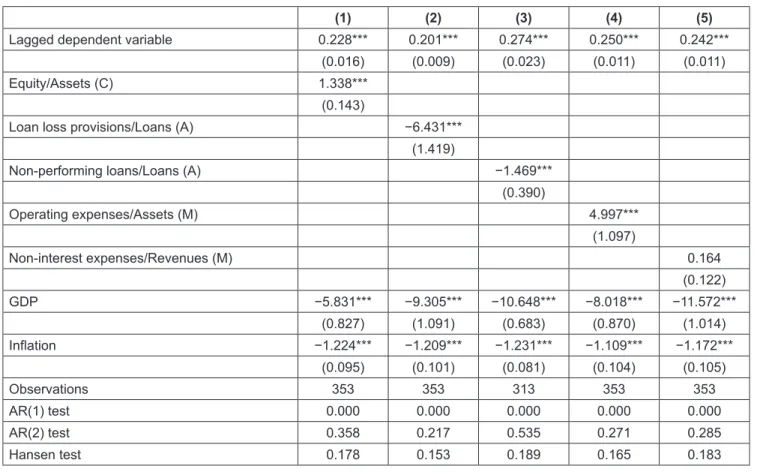
Table 3 presents the estimates for bank capital, asset quality, and management efficiency. Column 1 indicates the significant positive coefficient on the capital ratio, implying that banks having a large capital buffer tends to expand lending faster. In some detail, a one percentage point increase in the capital ratio causes bank lending to rise by 1.338 percentage points. This finding is in line with most previous studies, which highlight that a larger capital buffer might improve the risk-bearing capacity of banks and protect them against any potential loss.

Table 1: Summary statistics

Variables Observations Mean Standard deviation Min Max

Loan growth 384 31.351 33.928 −11.524 148.947

Equity/Assets (C) 384 10.009 4.842 4.384 25.267

Loan loss provisions/Loans (A) 384 1.261 0.543 0.351 2.763

Non-performing loans/Loans (A) 340 2.192 1.317 0.340 6.296

Non-interest expenses/Revenues (M) 384 21.440 6.015 10.935 34.269

Operating expenses/Assets (M) 384 1.730 0.501 0.822 3.025

ROA (E) 384 0.933 0.684 0.025 2.609

ROE (E) 384 9.968 7.235 0.336 27.482

NIM (E) 384 5.491 2.135 1.272 10.648

Liquid assets/Assets (L) 384 17.425 10.005 5.090 45.600

Loan/Deposit (L) 384 90.227 21.060 55.621 157.311

GAP (S) 384 5.220 7.023 −10.295 20.858

GDP 384 6.252 0.641 5.247 7.130

Inflation 384 7.346 6.100 0.631 23.115

Notes: The research sample covers the period of 2007–2019. All variables are expressed in percentages.

(6)

In columns 2–3 (Table 3), both loan loss provisions and non-performing loans enter the regressions significantly and negatively. Higher credit risk discourages banks from lending, or in other words, banks with lower asset quality grant loans less than banks with higher asset quality.

Regarding the economic significance, for example, a one percentage point increase in the non-performing loan ratio may mitigate bank lending by 1.469 percentage points.

Our result confirms the theoretical notion that a decline in asset quality causes greater caution among banks, leading to tightened lending standards and decreased loan growth (O’Brien & Browne, 1992).

Turning to columns 4–5 (Table 3), we realize that cost efficiency induces a significant and positive influence

on loan growth. This result reveals that banks with a higher cost ratio, alternatively speaking less efficiently managed banks, are more likely to experience a higher rate of loan growth. In terms of quantitative effect, if the ratio of operating expenses to total assets increases by one percentage point, then bank lending would rise by 4.997 percentage points on average. This pattern supports the

“moral hazard” hypothesis, stating that more inefficient banks with more moral hazard incentives are more likely to prefer an aggressive lending strategy (Jeitschko &

Jeung, 2005). However, our finding is only confirmed when we use the operating expenses indicator, whereas the coefficient is insignificant for the non-interest expenses ratio.

Table 2: Correlation coefficients matrix

Loan growth Equity/Assets (C) Loan loss provisions/ Loans (A) Non-performing loans/ Loans (A) Non-interest expenses/ Revenues (M) Operating expenses/ Assets (M) ROA (E) ROE (E) NIM (E) Liquid assets/Assets (L) Loan/Deposit (L) GAP (S) GDP Inflation

Loan growth 1.00

Equity/Assets (C) 0.14 1.00 Loan loss provisions/

Loans (A) −0.38 −0.24 1.00

Non-performing loans/

Loans (A) −0.28 0.06 0.59 1.00

Non-interest expenses/

Revenues (M) −0.17 −0.01 0.08 0.03 1.00 Operating expenses/

Assets (M) −0.12 0.27 0.03 0.11 0.58 1.00

ROA (E) 0.41 0.32 −0.19 −0.26 −0.20 0.21 1.00

ROE (E) 0.23 −0.21 −0.02 −0.29 −0.16 0.11 0.79 1.00

NIM (E) −0.13 0.34 0.04 0.01 0.20 0.68 0.51 0.37 1.00

Liquid assets/Assets (L) 0.36 0.25 −0.26 −0.17 −0.35 −0.25 0.36 0.19 −0.11 1.00 Loan/Deposit (L) 0.11 0.32 −0.14 −0.04 −0.11 0.15 0.26 0.11 0.26 0.03 1.00

GAP (S) 0.15 0.44 0.05 −0.03 0.07 0.23 0.42 0.26 0.41 0.21 0.41 1.00

GDP 0.06 −0.24 −0.21 −0.31 0.12 −0.12 0.03 0.16 −0.14 −0.07 0.10 0.01 1.00

Inflation 0.02 0.30 0.02 0.12 −0.48 0.03 0.29 0.16 0.19 0.44 0.22 0.15 −0.37 1.00

(7)

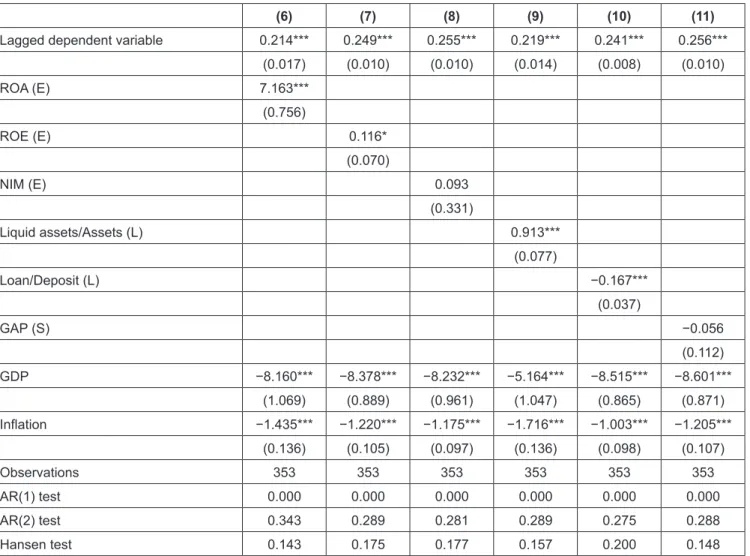
Table 4 reports regression results for remaining CAMELS factors, namely, bank earnings, liquidity, and sensitivity to the market risk captured by the dimension of interest rate risk. Focusing on bank earnings, we find that overall returns have significant and positive impacts on loan growth (columns 6–7). However, the regression coefficient of the net interest margin is insignificant (column 8). We gain enough evidence to show that banks might grant more loans when they are more profitable. Based on column 6, for instance, we predict that an increase of one percentage point in return on assets could lead to a rise of 7.163 percentage points in loan growth. One potential explanation is that excellent competitive advantages of high-profit banks, such as various loanable funds, relaxed lending standards, and reduced lending rates, could contribute to the lending expansion to a larger extent (Dell’Ariccia & Marquez, 2006).

Regarding the liquidity characteristic, both measures employed exert significant impacts on bank lending. In more detail, the results suggest that banks holding a larger buffer of liquid assets/banks previously using fewer deposits to make loans would expand their lending activities more

aggressively. Speaking of the economic plausibility, a one percentage point increase in the liquidity ratio (column 9 of Table 4) might make up a rise of 0.913 percentage points in lending. Consistent with the view of Gennaioli et al. (2014), our finding demonstrates that banks may optimally choose to store liquidity to finance customer loans afterward.

Looking at column 11 (Table 4), we find that the coefficient on the interest rate risk variable is statistically insignificant. Accordingly, we do not have evidence to support the notion that bank lending reacts to interest rate risk. Possibly, a too parsimonious model could alleviate the power of estimation. So, we need to move to the next stage which combines all CAMELS variables to verify the robustness of our findings so far.

We display the regressions obtained by mixing full sets of CAMELS components in Table 5. Though the statistical significance of several variables (such as credit risk and cost efficiency) slightly diminishes in some regressions, in general we still gain strong evidence to believe that our main findings remain unchanged as previously reported.

Interestingly, we observe the significant impacts of interest Table 3: Baseline estimation results for capital, asset quality, and management efficiency

(1) (2) (3) (4) (5)

Lagged dependent variable 0.228*** 0.201*** 0.274*** 0.250*** 0.242***

(0.016) (0.009) (0.023) (0.011) (0.011)

Equity/Assets (C) 1.338***

(0.143)

Loan loss provisions/Loans (A) −6.431***

(1.419)

Non-performing loans/Loans (A) −1.469***

(0.390)

Operating expenses/Assets (M) 4.997***

(1.097)

Non-interest expenses/Revenues (M) 0.164

(0.122)

GDP −5.831*** −9.305*** −10.648*** −8.018*** −11.572***

(0.827) (1.091) (0.683) (0.870) (1.014)

Inflation −1.224*** −1.209*** −1.231*** −1.109*** −1.172***

(0.095) (0.101) (0.081) (0.104) (0.105)

Observations 353 353 313 353 353

AR(1) test 0.000 0.000 0.000 0.000 0.000

AR(2) test 0.358 0.217 0.535 0.271 0.285

Hansen test 0.178 0.153 0.189 0.165 0.183

Notes: The dependent variable is the rate of loan growth. Standard errors are reported in parentheses. *, **, and *** indicate the significance

levels 10%, 5%, and 1%, respectively. The validity tests of the GMM estimator are shown with p-values.

(8)

rate risk on bank lending across all columns in Table 5. These results consistently affirm that exposures to interest rate risk weaken the expansion of lending activities. A possible reason is that banks might be concerned about the adverse effects of unpredictable adverse changes in interest rates, making banks with high interest rate risk suffer potential losses and depleted equity capital (Van den Heuvel, 2002).

5. Conclusions

The study empirically examines the determinants of bank lending in the Vietnamese banking system over the period 2007–2019. We select the critical determinants based on the CAMELS approach and employ the dynamic panel regression to determine the effects of each component factor

Table 4: Baseline estimation results for earnings, liquidity, and sensitivity to market risk

(6) (7) (8) (9) (10) (11)

Lagged dependent variable 0.214*** 0.249*** 0.255*** 0.219*** 0.241*** 0.256***

(0.017) (0.010) (0.010) (0.014) (0.008) (0.010)

ROA (E) 7.163***

(0.756)

ROE (E) 0.116*

(0.070)

NIM (E) 0.093

(0.331)

Liquid assets/Assets (L) 0.913***

(0.077)

Loan/Deposit (L) −0.167***

(0.037)

GAP (S) −0.056

(0.112)

GDP −8.160*** −8.378*** −8.232*** −5.164*** −8.515*** −8.601***

(1.069) (0.889) (0.961) (1.047) (0.865) (0.871)

Inflation −1.435*** −1.220*** −1.175*** −1.716*** −1.003*** −1.205***

(0.136) (0.105) (0.097) (0.136) (0.098) (0.107)

Observations 353 353 353 353 353 353

AR(1) test 0.000 0.000 0.000 0.000 0.000 0.000

AR(2) test 0.343 0.289 0.281 0.289 0.275 0.288

Hansen test 0.143 0.175 0.177 0.157 0.200 0.148

Notes: The dependent variable is the rate of loan growth. Standard errors are reported in parentheses. *, **, and *** indicate the significance levels 10%, 5%, and 1%, respectively. The validity tests of the GMM estimator are shown with p-values.

on loan growth. Though there are many studies exploring bank lending behavior in the existing literature, our work is the first attempt to focus on bank-specific characteristics using the CAMELS framework. Theoretically, each CAMELS component is thought to considerably shape bank behavior in general and bank lending in particular.

With these settings, we display multiple important empirical results to support the theoretical analysis reviewed. Among the CAMELS bank-specific determinants, we find that the essential factors, including bank capital, asset quality, liquidity, and market risk resilience, significantly contribute to the banks’ capacity to sustain lending activities.

Interestingly, our result indicates that banks with poorer

management efficiency tend to expand lending faster than

better managed banks.

(9)

Our findings draw several implications. From the banks’

commercial perspective, improving bank soundness is quite necessary, especially in the context that the nascent banking market of Vietnam is currently operating under the guidelines of the Basel II standards and the supervision by the CAMELS framework. For policymakers, they should pay close attention to poorly managed banks’ behavior to ensure the safety of the banking system, given the finding that these banks with more moral hazard incentives are more likely to expand lending aggressively.

References

Adesina, K. S. (2019). Basel III liquidity rules: The implications for bank lending growth in Africa. Economic Systems, 43(2), 100688. https://doi.org/10.1016/j.ecosys.2018.10.002

Altunbas, Y., Gambacorta, L., & Marques-Ibanez, D. (2010). Bank risk and monetary policy. Journal of Financial Stability, 6(3), 121–129. https://doi.org/10.1016/j.jfs.2009.07.001

Arellano, M., & Bover, O. (1995). Another look at the instrumental variable estimation of error-components models. Journal of Table 5: Estimation results with full sets of variables

(1) (2) (3) (4) (5) (6) (7) (8)

Lagged dependent variable 0.196*** 0.156*** 0.208*** 0.178*** 0.236*** 0.204*** 0.251*** 0.224***

(0.019) (0.017) (0.020) (0.019) (0.027) (0.022) (0.030) (0.026) Equity/Assets (C) 1.110*** 1.261*** 1.419*** 1.818*** 1.129*** 1.155*** 1.379*** 1.594***

(0.230) (0.238) (0.236) (0.250) (0.072) (0.236) (0.129) (0.288) Loan loss provisions/Loans (A) −0.847 −4.682*** −0.866 −4.920***

(1.325) (1.104) (1.109) (1.143)

Non-performing loans/Loans (A) −0.663* −1.314*** −0.540* −1.232***

(0.354) (0.346) (0.327) (0.320) Operating expenses/Assets (M) 6.528*** 2.562* 6.699*** 2.595* 4.864*** 2.200** 4.549*** 1.541

(1.253) (1.382) (1.455) (1.444) (1.277) (1.116) (1.281) (1.052)

ROA (E) 3.517*** 6.727*** 2.420** 4.042***

(0.931) (1.038) (1.098) (1.259)

ROE (E) 0.302*** 0.539*** 0.328*** 0.523***

(0.082) (0.067) (0.091) (0.088)

Liquid assets/Assets (L) 0.908*** 0.902*** 0.672*** 0.655***

(0.082) (0.078) (0.127) (0.132)

Loan/Deposit (L) −0.262*** −0.252*** −0.221*** −0.216***

(0.042) (0.038) (0.037) (0.033)

GAP (S) −0.631*** −0.286** −0.633*** −0.293** −0.736*** −0.459*** −0.789*** −0.553***

(0.142) (0.126) (0.126) (0.123) (0.106) (0.095) (0.089) (0.094) GDP −3.167*** −6.334*** −2.983*** −6.305*** −4.976*** −7.555*** −5.000*** −7.792***

(0.811) (0.719) (0.823) (0.694) (0.738) (0.729) (0.703) (0.716) Inflation −1.714*** −1.131*** −1.717*** −1.168*** −1.522*** −0.950*** −1.581*** −1.078***

(0.154) (0.133) (0.159) (0.135) (0.164) (0.131) (0.160) (0.124)

Observations 353 353 353 353 313 313 313 313

AR(1) test 0.000 0.000 0.000 0.000 0.001 0.001 0.000 0.001

AR(2) test 0.318 0.331 0.346 0.416 0.565 0.657 0.468 0.505

Hansen test 0.167 0.176 0.175 0.162 0.228 0.194 0.268 0.215

Notes: The dependent variable is the rate of loan growth. Standard errors are reported in parentheses. *, **, and *** indicate the significance

levels 10%, 5%, and 1%, respectively. The validity tests of the GMM estimator are shown with p-values.

(10)

Econometrics, 68(1), 29–51. https://doi.org/10.1016/0304- 4076(94)01642-D

Aysan, A. F., & Disli, M. (2019). Small business lending and credit risk: Granger causality evidence. Economic Modelling, 83, 245–255. https://doi.org/10.1016/j.econmod.2019.02.014 Ben Naceur, S., Marton, K., &Roulet, C. (2018). Basel III and bank-

lending: Evidence from the United States and Europe. Journal of Financial Stability, 39, 1–27. https://doi.org/10.1016/j.

jfs.2018.08.002

Berger, A. N., & Bouwman, C. H. S. (2009). Bank liquidity creation.

Review of Financial Studies, 22(9), 3779–3837. https://doi.

org/10.1093/rfs/hhn104

Berger, A. N., & DeYoung, R. (1997). Problem loans and cost efficiency in commercial banks. Journal of Banking and Finance, 21(6), 849–870. https://doi.org/10.1016/S0378-4266(97)00003-4 Bernanke, B. S., & Blinder, A. S. (1988). Credit, money, and

aggregate demand. American Economic Review, 78, 435–439.

https://doi.org/10.1016/S0197-2510(11)70055-9

Bernanke, B. S., Lown, C. S., & Friedman, B. M. (1991). The credit crunch. Brookings Papers on Economic Activity, 1991(2), 205.

https://doi.org/10.2307/2534592

Berrospide, J. M., & Edge, R. M. (2010). The effects of bank capital on lending: What do we know, and what does it mean?

International Journal of Central Banking, 6(4), 5–54. https://

doi.org/10.17016/feds.2010.44

Beutler, T., Bichsel, R., Bruhin, A., & Danton, J. (2020). The impact of interest rate risk on bank lending. Journal of Banking and Finance, 115, Article ID105797. https://doi.org/10.1016/j.

jbankfin.2020.105797

Blundell, R., & Bond, S. (1998). Initial conditions and moment restrictions in dynamic panel data models. Journal of Econometrics, 87(1), 115–143. https://doi.org/10.1016/S0304- 4076(98)00009-8

Broner, F., Erce, A., Martin, A., & Ventura, J. (2014). Sovereign debt markets in turbulent times: Creditor discrimination and crowding-out effects. Journal of Monetary Economics, 61(1), 114–142. https://doi.org/10.1016/j.jmoneco.2013.11.009 Bustamante, J., Cuba, W., &Nivin, R. (2019). Determinants of

credit growth and the bank-lending channel in Peru: A loan level analysis.BIS Working Papers No. 803.Basel, Switzerland:

The Bank for International Settlements.https://www.bis.org/

publ/work803.pdf

Carlson, M., Shan, H., & Warusawitharana, M. (2013). Capital ratios and bank lending: A matched bank approach. Journal of Financial Intermediation, 22(4), 663–687. https://doi.

org/10.1016/j.jfi.2013.06.003

Cornett, M. M., McNutt, J. J., Strahan, P. E., & Tehranian, H.

(2011). Liquidity risk management and credit supply in the financial crisis. Journal of Financial Economics, 101(2), 297–

312. https://doi.org/10.1016/j.jfineco.2011.03.001

Coval, J. D., &Thakor, A. V. (2005). Financial intermediation as a beliefs-bridge between optimists and pessimists. Journal

of Financial Economics, 75(3), 535–569. https://doi.

org/10.1016/j.jfineco.2004.02.005

Dahir, A. M., Mahat, F., Razak, N. H. A., & Bany-Ariffin, A. N. (2019).

Capital, funding liquidity, and bank lending in emerging economies:

An application of the LSDVC approach. Borsa Istanbul Review, 19(2), 139–148. https://doi.org/10.1016/j.bir.2018.08.002 Dang, V. D. (2019). The risk-return trade-off of liquidity positions:

Evidence from Vietnamese banking system. International Journal of Monetary Economics and Finance, 12(5), 390–406.

https://doi.org/10.1504/IJMEF.2019.102954

Dang, V. D. (2020). Do non-traditional banking activities reduce bank liquidity creation? Evidence from Vietnam. Research in International Business and Finance,54, Article ID 101257.

https://doi.org/10.1016/j.ribaf.2020.101257

Dao, B. T. T., & Nguyen, D. P. (2020). Determinants of profitability in commercial banks in Vietnam, Malaysia and Thailand.

Journal of Asian Finance, Economics, and Business, 7(4), 133–

143. https://doi.org/10.13106/jafeb.2020.vol7.no4.133

De Graeve, F., De Jonghe, O., & Vennet, R. Vander. (2007).

Competition, transmission and bank pricing policies: Evidence from Belgian loan and deposit markets. Journal of Banking and Finance, 31(1), 259–278. https://doi.org/10.1016/j.

jbankfin.2006.03.003

Delis, M. D., Kouretas, G. P., & Tsoumas, C. (2014). Anxious periods and bank lending. Journal of Banking and Finance, 38(1), 1–13. https://doi.org/10.1016/j.jbankfin.2013.09.009 Dell’Ariccia, G., & Marquez, R. (2006). Lending booms and

lending standards. The Journal of Finance, 61(5), 2511–2546.

https://doi.org/10.1111/j.1540-6261.2006.01065.x

Fiorentino, E., Karmann, A., & Koetter, M. (2011). The cost efficiency of German banks: A comparison of SFA and DEA.

SSRN Electronic Journal. https://doi.org/10.2139/ssrn.947340 Gambacorta, L. (2008). How do banks set interest rates? European

Economic Review, 52(5), 792–819. https://doi.org/10.1016/j.

euroecorev.2007.06.022

Gennaioli, N., Martin, A., & Rossi, S. (2014). Sovereign default, domestic banks, and financial institutions. Journal of Finance, 69(2), 819–866. https://doi.org/10.1111/jofi.12124

Gomez, M., Landier, A., Sraer, D., & Thesmar, D. (2020). Banks’

exposure to interest rate risk and the transmission of monetary policy. Journal of Monetary Economics. [In Press] https://doi.

org/10.1016/j.jmoneco.2020.03.011

Hancock, D., & Wilcox, J. A. (1994). Bank capital and the credit crunch: The roles of risk‐weighted and unweighted capital regulations. Real Estate Economics, 22(1), 59–94. https://doi.

org/10.1111/1540-6229.00626

Havranek, T., Irsova, Z., & Lesanovska, J. (2016). Bank efficiency and interest rate pass-through: Evidence from Czech loan products. Economic Modelling, 54, 153–169. https://doi.

org/10.1016/j.econmod.2016.01.004

Heid, F., & Krüger, U. (2011). Do capital buffers mitigate

volatility of bank lending? A simulation study. Discussion

(11)

Paper Series 2 Banking and Financial Studies N0 03/2011. Deutsche Bundesbank. https://www.econstor.eu/

bitstream/10419/44596/1/654088020.pdf

Holmstrom, B., & Tirole, J. (1997). Financial intermediation, loanable funds, and the real sector. Quarterly Journal of Economics, 112(3), 663–691. https://doi.org/10.1162/003355397555316 Jeitschko, T. D., & Jeung, S. D. (2005). Incentives for risk-

taking in banking – A unified approach. Journal of Banking

& Finance, 29(3), 759–777. https://doi.org/10.1016/j.

jbankfin.2004.05.028

Khanifah, K., Hardiningsih, P., Darmaryantiko, A., Iryantik, I., &

Udin, U. D. I. N. (2020). The effect of corporate governance disclosure on banking performance: Empirical evidence from Iran, Saudi Arabia and Malaysia. Journal of Asian Finance, Economics, and Business, 7(3), 41–51. https://doi.

org/10.13106/jafeb.2020.vol7.no3.41

Kim, D., & Sohn, W. (2017). The effect of bank capital on lending:

Does liquidity matter? Journal of Banking and Finance, 77, 95–107. https://doi.org/10.1016/j.jbankfin.2017.01.011 Košak, M., Li, S., Lončarski, I., & Marinč, M. (2015). Quality

of bank capital and bank lending behavior during the global financial crisis. International Review of Financial Analysis, 37, 168–183. https://doi.org/10.1016/j.irfa.2014.11.008

Laidroo, L. (2010). Lending growth determinants and cyclicality:

Evidence from CEE banks. RBI Staff Studies, 1–24.

Available at: https://old.taltech.ee/public/l/laivi_laidroo/

Paper_2012_04_20_final.pdf

Le, T. T. D, & Diep, T. T. (2020). The effect of lending structure concentration on credit risk: The evidence of Vietnamese commercial banks. Journal of Asian Finance, Economics, and Business, 7(7), 59–72. https://doi.org/10.13106/jafeb.2020.

vol7.no7.059

Louhichi, A., & Boujelbene, Y. (2017). Bank capital, lending and financing behaviour of dual banking systems. Journal of Multinational Financial Management, 41, 61–79. https://doi.

org/10.1016/j.mulfin.2017.05.009

Mankiw, N. G. (1986). The allocation of credit and financial collapse. The Quarterly Journal of Economics, 101(3), 455–

470. https://doi.org/10.2307/1885692

Nier, E., & Zicchino, L. (2006). Bank weakness, loan supply and monetary policy. London, UK: The Bank of England.

O’Brien, P. F., & Browne, F. (1992). A “credit crunch”?: The recent slowdown in bank lending and its implications for monetary policy. OECD Economics Department Working Papers No. 107.

Paris, France: OECD. https://doi.org/10.1787/657730454204 Qayyum, N., & Noreen, U. (2019). Impact of capital structure on

profitability: A comparative study of Islamic and conventional banks of Pakistan. Journal of Asian Finance, Economics and Business, 6(4), 65–74. https://doi.org/10.13106/jafeb.2019.

vol6.no4.65

Rajan, R. G. (2006). Has finance made the world riskier?

European Financial Management, 12(4), 499–533. https://doi.

org/10.1111/j.1468-036X.2006.00330.x

Repullo, R. (2004). Capital requirements, market power, and risk- taking in banking. Journal of Financial Intermediation, 13(2), 156–182. https://doi.org/10.1016/j.jfi.2003.08.005

Roodman, D. (2009). How to do xtabond2: An introduction to difference and system GMM in Stata. Stata Journal, 9(1), 86–

136. https://doi.org/10.1177/1536867x0900900106

Roulet, C. (2018). Basel III: Effects of capital and liquidity regulations on European bank lending. Journal of Economics and Business, 95, 26–46. https://doi.org/10.1016/j.

jeconbus.2017.10.001

Tracey, M., & Leon, H. (2011). The impact of non-performing loans on loan growth. IMF Working Papers. Washington, DC:

International Monetary Fund. Available at: http://www.boj.

org.jm/researchconf/papers/Tracey_The%20Impact%20of%20 NPLs%20on%20Loan%20%20Case%20Study%20of%20 Jamaica%20%20Trinidad%20and%20Tobago.pdf

Van den Heuvel, S. J. (2002). Does bank capital matter for monetary transmission? Economic Policy Review, 8(1), 259–265. https://

doi.org/10.2139/ssrn.831946

Vo, X. V. (2018). Bank lending behavior in emerging markets.

Finance Research Letters, 27, 129–134. https://doi.

org/10.1016/j.frl.2018.02.011

Vo, X. V., Pham, T. H. A., Doan, T. N., & Luu, H. N. (2020).

Managerial ability and bank lending behavior. Finance Research

Letters. [In Press] https://doi.org/10.1016/j.frl.2020.101585

수치

Table 1 presents the summary statistics, while Table  2 shows the correlation between each pair of variables
Table 2: Correlation coefficients matrix
Table 4 reports regression results for remaining  CAMELS factors, namely, bank earnings, liquidity, and  sensitivity to the market risk captured by the dimension of  interest rate risk
Table 4: Baseline estimation results for earnings, liquidity, and sensitivity to market risk

참조

관련 문서

The existence of such a relationship in Korean commercial banks with capital ratios in excess of regulatory minimum levels suggests that Korean bank

It also contains the statistical inference on the interaction among firm entry, industry specific factors, firm specific factors, and economic performance, and

and Sanghoon Ahn, Informational Quality of Financial Systems and Economic Development: An Indicator Approach for East Asia, 2001 Asia Development Bank

household indebtedness: Causes and consequences", Reserve Bank of Australia Conference 2007 - The structure and resilience of the financial system on August 20-21,

Source: Federal Reserve, Bank of Japan, European Central Bank, Central Bank of Brazil, Reserve Bank of India, and People's Bank of China.. Short-term financial conditions

In the current context, where the interconnectedness of the global economy has intensified greatly and the importance of a collective response to

Determinants of Consumption Demand Determinants of the Current Account How Real Exchange Rate Changes Affect.

Drawee Bank DRAWN ON WOORI BANK SEOUL FOR FULL