Korean Circulation Journal
Introduction
The benefits of statin in the primary and secondary prevention for coronary artery diseases are well established.
1-5)Clinical studies
Print ISSN 1738-5520 • On-line ISSN 1738-5555
Effect of High Dose Rosuvastatin Loading before Primary
Percutaneous Coronary Intervention on Infarct Size in Patients with ST-Segment Elevation Myocardial Infarction
Ji Won Kim, MD, Kyeong Ho Yun, MD, Eun Kyoung Kim, MD, Yong Cheol Kim, MD, Dai-Yeol Joe, MD, Jum Suk Ko, MD, Sang Jae Rhee, MD, Eun Mi Lee, MD, Nam Jin Yoo, MD, Nam-Ho Kim, MD, Seok Kyu Oh, MD, and Jin-Won Jeong, MD
Department of Cardiovascular Medicine, Regional Cardiocerebrovascular Center, Wonkwang University Hospital, Iksan, Korea
Background and Objectives: High dose rosuvastatin loading before percutaneous coronary interventions (PCI) reduces the myocardial damage and the incidence of adverse cardiac events in patients with stable angina and acute coronary syndrome. However, no studies are present yet about rosuvastatin loading in patients with ST-segment elevation myocardial infarction (STEMI) in a primary PCI setting.
Subjects and Methods: A total of 475 patients who underwent primary PCI for STEMI were studied. The study population was divided into two groups with 208 patients in the statin group=40 mg rosuvastatin loading before primary PCI and 267 patients in the control group=
no statin pretreatment. At median 3 days after PCI a single-photon emission computed tomography (SPECT) was performed with techne- tium 99m tetrofosmin For this study were compared infarct size, corrected Thrombolysis in Myocardial Infarction (TIMI) frame count and the myocardial blush grade (MBG) between the both groups.
Results: Baseline clinical and procedural characteristics were similar between the groups. Infarct size, as assessed by SPECT, was signifi- cantly smaller (19.0±15.9% vs. 22.9±16.5%, p=0.009) in the statin group than in the control group. Patients of the statin group showed a lower corrected TIMI frame count (28.2±19.3 vs. 32.6±21.4, p=0.020), and higher MBG (2.49±0.76 vs. 2.23±0.96, p=0.001) than the pa- tients of the control group. The multivariate analysis revealed that rosuvastatin loading {odds ratio (OR) 0.61}, pain to balloon time (OR 2.05), anterior myocardial infarction (OR 3.89) and final the MBG (OR 2.93) were independent predictors of a large infarct size.
Conclusion: A high dose rosuvastatin loading before the primary PCI reduced the infarct size by microvascular myocardial perfusion im- provement. (Korean Circ J 2014;44(2):76-81)
KEY WORDS: Angioplasty; Myocardial infarction; Stents; Hydroxymethylglutaryl-CoA Reductase inhibitors.
Received: November 12, 2013 Revision Received: December 13, 2013 Accepted: December 30, 2013
Correspondence: Kyeong Ho Yun, MD, Department of Cardiovascular Medicine, Regional Cardiocerebrovascular Center, Wonkwang University Hospital, 895 Muwang-ro, Iksan 570-711, Korea
Tel: 82-63-859-2524, Fax: 82-63-852-8480 E-mail: [email protected]
• The authors have no financial conflicts of interest.
This is an Open Access article distributed under the terms of the Creative Commons Attribution Non-Commercial License (http://creativecommons.
org/licenses/by-nc/3.0) which permits unrestricted non-commercial use, distribution, and reproduction in any medium, provided the original work is properly cited.
showed in the era of percutaneous coronary intervention (PCI) a high dose statin loading before a PCI may improve the clinical out- comes in patients with stable angina and acute coronary syndrome (ACS) with a reduction of periprocedural myocardial damage.
6-8)The positive effects of statin pretreatment on clinical outcomes may be dependent on the periprocedural inflammatory status.
8)9)According to the Novel Approaches for Preventing or Limiting Events (Naples) II and Atorvastatin for Reduction of Myocardial Damage During An- gioplasty (ARMYDA)-RECAPTURE trials, a high dose statin loading is more effective in patients with a high C-reactive protein level at baseline.
8)10)Therefore, a high dose statin loading therapy may be more efficacious in patients with ST-segment elevation myocardial infarction (STEMI) than in other clinical situations because STEMI is characterized by extremely high inflammation.
However, few data only are available to support the statin load-
ing therapy before a primary PCI in patients with STEMI. The Efficacy
of High-Dose AtorvaSTATIN Loading Before Primary PCI in ST-Ele- vation Myocardial Infarction (STATIN STEMI) trial demonstrated a 80 mg atorvastatin loading improved the coronary flow and perfu- sion after primary PCI.
11)However, the number of STATIN STEMI par- ticipants was too small to draw a definite conclusion and further large trials are required to confirm the effect of statin loading in a primary PCI setting. Therefore, a retrospective study was designed to investigate the effects of high dose rosuvastatin loading before primary PCI on infarct size in patients with STEMI.
Subjects and Methods
Study population
For this study a single center STEMI and a primary PCI cohort were analyzed from January 2008 to December 2012. During the study period, 516 consecutive patients underwent primary PCI for STEMI.
A total of 24 patients were excluded because of current treatment with statins, 8 patients were excluded because they died before they underwent the technetium 99m tetrafosmin single-photon emis- sion computed tomography (SPECT) study, 8 patients were excluded because of SPECT refusal and 1 patient was excluded because of an inadequate image. Therefore 475 patients were eligible patients; of these, 208 patients received 40 mg rosuvastatin loading before pri- mary PCI (statin group) and 267 patients didn’t receive any statin pretreatment (control group). Rosuvastatin loading was performed in the emergency room at the on-call physician’s discretion. All patients provided informed consent for processing their anonymous data according to a protocol approved by the Institutional Review Board of Wonkwang University Hospital (WKUHIRB-201310-HRE-021).
Percutaneous coronary intervention
Before the procedure aspirin (300 mg/day) and clopidogrel (300 mg/day) were loaded in all patients. An intravenous bolus of 5000 U of unfractionated heparin was given heparin boluses were given to maintain activated clotting time >300 seconds during the procedure additionally. The coronary angiography and the stent implantation were performed using standard interventional techniques. Platelet glycoprotein IIb/IIIa inhibitors were administered according to the operator’s preference. After the procedure aspirin (100 mg/day), clopidogrel (75 mg/day) and statins were prescribed to all patients.
Data collection and analyses
Pre- and post-PCI angiograms were reviewed. The Thrombolysis in Myocardial Infarction (TIMI) flow grade before and after PCI, the cor- rected TIMI frame count (cTFC) and the myocardial blush grade (MBG) were analyzed by 2 experienced blinded observers as described pre- viously.
12)13)Creatine kinease myocardial band isoenzyme (CK-MB)
isoenzyme and troponin T were measured before primary PCI and 8, 24 and 48 hours after. Peak concentrations were identified and the area under time-concentration curve was estimated from cardiac biomarker levels measured at individual time-points. Troponin T was measured quantitatively (Elecsys Troponin T assay, Roche Diagnos- tics, Indianapolis, IN, USA) with a detection threshold of 0.003 ng/mL.
To evaluate major adverse cardiac events (MACE) such as death, new myocardial infarction and target vessel revascularization a clin- ical follow-up was performed on day 30 with all patients.
Single-photon emission computed tomography and left ventricular function assessment
Single-photon emission computed tomography imaging with technetium 99m tetrofosmin was performed by a standardized tech- nique. After injection of adenosine, 370 MBq of technetium 99m tetrofosmin was injected intravenously and stress myocardial im- ages were obtained. After 4 hours, another 1110 MBq of technetium 99m tetrofosmin was administered intravenously and the resting myocardial images were obtained. The SPECT images were acquired on a dual-headed gamma camera (Vertex 60, Philips ADAC, Milpi- tas, CA, USA) equipped with high-resolution collimators. Myocardial perfusion defects (infarct size) were quantified and expressed as a percentage involvement of the left ventricle. The patients underwent SPECT imaging in a median of 3 days (interquartile range, 2–4 days) after PCI.
Study end points
The primary end point was the myocardial infarct size as assessed by SPECT. The secondary end points included 1) TIMI flow grade, cTFC, MBG after PCI, 2) infarct size assessed by serial cardiac bio- marker measurement, and 3) 30-day MACE.
Statistical analysis
Based upon preliminary data of the Wonkwang Medical Center, the infarct size of the control group was expected to be 20% (stan- dard deviation 15%). The sample size was selected to demonstrate a reduction in the infarct size from 20% in the control group to 15%
in the statin group. A minimal sample size of 178 patients in each group would provide 80% power with two-sided alpha of 0.05.
All measurements were represented as mean±standard deviation
or absolute number (percentage). Inter-group analysis was per-
formed using independent t-test and χ
2test, which were conducted
using Statistical Package for the Social Sciences (SPSS) 19.0 for Win-
dows (SPSS Inc., Chicago, IL, USA). To compare the change of cardiac
biomarkers before and after PCI, the paired t-test was used. A multi-
variable logistic regression model was constructed to predict large
infarct size (greater than median value, >18%). According to the
Table 1. Baseline clinical characteristics
Control group (n=267) Statin group (n=213) p
Age (years) 60.8±13.2 62.2±12.9 0.249
Male (%) 77.5 (207) 73.2 (156) 0.286
Hypertension (%) 50.9 (136) 41.8 (89) 0.053
Diabetes (%) 25.5 (68) 20.2 (43) 0.192
Current smoker (%) 46.8 (125) 50.2 (107) 0.464
Anterior infarction (%) 41.6 (111) 47.9 (102) 0.195
Killip class ≥2 (%) 12.4 (33) 8.9 (19) 0.241
Door-to-balloon time (minutes) 92.0±113.0 87.0±132.0 0.599
Pain-to-balloon time (minutes) 340.0±325.0 318.0±298.0 0.437
Baseline laboratory findings
WBC (/μL) 11338.4±2920.5 10896.2±3310.8 0.121
Serum creatinine (mg/dL) 1.01±0.30 0.97±0.33 0.175
CK-MB (IU/L) 56.1±85.7 64.4±77.8 0.201
Troponin T (mg/mL) 0.65±1.54 0.50±1.17 0.248
Total cholesterol (mg/dL) 196.8±48.8 194.8±37.9 0.601
Triglyceride (mg/dL) 159.3±136.3 160.2±132.2 0.941
HDL-C (mg/dL) 41.6±10.5 42.1±11.0 0.620
LDL-C (mg/dL) 118.7±36.8 117.0±34.4 0.606
WBC: white blood cell, CK-MB: creatine kinease myocardial band isoenzyme, HDL-C: high density lipoprotein-cholesterol, LDL-C: low density lipoprotein- cholesterol
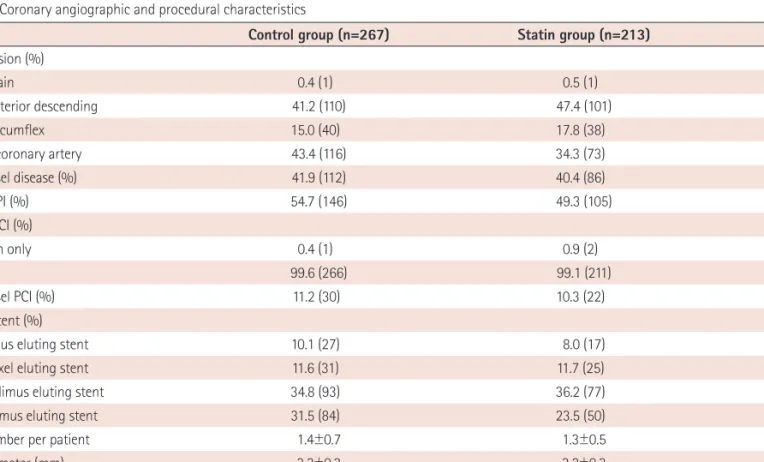
Table 2. Coronary angiographic and procedural characteristics
Control group (n=267) Statin group (n=213) p
Culprit lesion (%) 0.241
Left main 0.4 (1) 0.5 (1)
Left anterior descending 41.2 (110) 47.4 (101)
Left circumflex 15.0 (40) 17.8 (38)
Right coronary artery 43.4 (116) 34.3 (73)
Multivessel disease (%) 41.9 (112) 40.4 (86) 0.780
Use of GPI (%) 54.7 (146) 49.3 (105) 0.270
Type of PCI (%) 0.436
Balloon only 0.4 (1) 0.9 (2)
Stent 99.6 (266) 99.1 (211)
Multivessel PCI (%) 11.2 (30) 10.3 (22) 0.770
Type of stent (%)
Sirolimus eluting stent 10.1 (27) 8.0 (17) 0.525
Paclitaxel eluting stent 11.6 (31) 11.7 (25) 1.000
Zotarolimus eluting stent 34.8 (93) 36.2 (77) 0.774
Everolimus eluting stent 31.5 (84) 23.5 (50) 0.065
Stent number per patient 1.4±0.7 1.3±0.5 0.028
Stent diameter (mm) 3.2±0.3 3.2±0.3 0.727
Total stent length (mm) 37.5±19.7 35.0±16.3 0.144
Maximal pressure (atm) 15.3±3.3 15.9±3.3 0.063
Procedural complications (%)* 14.6 (39) 15.0 (32) 0.898
*Procedural complications included abrupt vessel closure, slow/no reflow, distal embolization, side branch occlusion, and major dissection during primary
percutaneous coronary intervention. GPI: glycoprotein IIb/IIIa inhibitor, PCI: percutaneous coronary intervention
significant univariate analysis following variables were selected and inserted into the logistic regression analysis: rosuvastatin loading, pain to balloon time, anterior infarction, angiographic slow flow and final MBG. Statistical significance was set at p<0.05.
Results
Baseline characteristics
The baseline clinical characteristics of the patients in the control and statin groups are shown in Table 1. The risk factors, door-to- balloon time and the baseline cardiac biomarker levels were similar between the groups. Most of all patients received drug-eluting stents and over 70% of the patients received second generation drug-elut- ing stents (Table 2). Angiographic and procedural characteristics were similar between the groups, but in the control group a greater number of stents was used than in the statin group (1.4±0.7 vs. 1.3±
0.5, p=0.028).
Angiographic and biochemical outcomes
Angiographic no reflow and final TIMI flow grade <3 occurred at a similar rate in both groups (Table 3). The final cTFC was lower (28.2±19.3 vs. 32.6±21.4, p=0.020) and the final MBG was higher in the statin group (2.49±0.76 vs. 2.23±0.96, p=0.001).
All single time-points after PCI (8, 24, and 48 hours) and peak level of CK-MB and troponin T were lower in the statin group (Fig. 1). The statin group showed significantly lower cumulative CK-MB levels
(367.9±297.3 IU/L vs. 483.5±340.4 IU/L, p<0.001) and cumulative troponin T levels (13.03±11.29 ng/mL vs. 16.53±13.04 ng/mL, p=
0.005) than the control group.
Infarct size measured by single-photon emission computed tomography
The median infarct size was 18.0% (interquartile range, 7.0–32.8%).
There was no difference in the time from PCI to SPECT between the groups (Table 3). The statin group revealed a significant smaller in- farct size than the control group (19.0±15.9% vs. 22.9±16.5%, p=
0.009). However, the left ventricular ejection fraction was similar be- tween both groups.
Multivariate analysis revealed that rosuvastatin loading {odds ra- tio (OR)=0.61; 95% confidence interval (CI)=0.41–0.91; p=0.015},
Table 3. Radionuclide imaging, angiographic, and clinical outcomes
Control group (n=267) Statin group (n=213) p
SPECT results
Follow-up time (days) 3.8±3.1 3.8±3.6 0.886
Infarct size (%) 22.9±16.5 19.0±15.9 0.009
Ejection fraction (%) 51.1±11.5 52.4±12.3 0.228
Angiographic outcomes
Angiographic no reflow (%) 6.7 (18) 8.0 (17) 0.602
Baseline TIMI flow grade 0/1 (%) 80.1 (214) 77.9 (166) 0.573
Final TIMI flow grade <3 (%) 18.4 (49) 16.9 (36) 0.719
Baseline corrected TIMI frame count 166.1±65.2 162.2±68.6 0.553
Final corrected TIMI frame count 32.6±21.4 28.2±19.3 0.020
Baseline TIMI blush grade 0.58±1.14 0.60±1.10 0.904
Final TIMI blush grade 2.23±0.96 2.49±0.76 0.001
30-day clinical outcomes (%)
All cause death 1.1 (3) 0.0 (0) 0.121
New myocardial infarction 0.4 (1) 0.0 (0) 0.371
Target lesion revascularization 0.4 (1) 0.0 (0) 0.371
Total events 1.5 (4) 0.0 (0) 0.073
SPECT: single-photon emission computed tomography, TIMI: Thrombolysis in Myocardial Infarction
Fig. 1. Time-concentration curve of creatine kinease myocardial band isoen- zyme (CK-MB).
350 300 250 200 150 100 50
0 Baseline 8 hours 24 hours 48 hours 27.4 43.0 88.8
122.6 230.6
266.7
54.1 46.4 p=0.201
p=0.061 (IU/L)
p<0.001
Cumulative CK-MB release Control: 483.5±340.4 IU/L Statin: 367.9±297.3 IU/L p<0.001
p<0.001