전자동 생화학 분석기 Rx Imola의 평가
신소연․권계철․구선회․박종우․고지선
충남대학교 의과대학 진단검사의학교실
The Performance of the Newly Released Automated Chemistry Analyzer Rx Imola
So Youn Shin, Kye Chul Kwon, Sun Hoe Koo, Jong Woo Park, and Chi Seon Ko
Department of Laboratory Medicine, College of Medicine, Chungnam National University, Daejeon, Korea
Background: The Rx Imola (Randox, UK) is newly released bench top - fully automated analyzer based on Window XP software with high-throughput (640 tests per hour with ISE) and continuous random access. We evaluated the performance of Rx Imola for the routine chemistry.
Methods: Repeatability (within-day precision), between-day precision, within-device precision, linearity, recovery rates and correlation were evaluated for 19 items including AST, ALT, ALP, GGT, total bilirubin, calcium, phosphorus, albumin, total protein, BUN, creatinine, glucose, amylase, total cholesterol, triglyceride, HDL, LDH, CK and uric acid. Commercialized quality control materials and patient’s sera were used. For correlation study, 747-100 (HITACHI, Japan) and VITROS 950 (Ortho-Clinical Diagnostics, USA) were used as comparative analyzers.
Results: Coefficients of variation (CVs) of all items in repeatability and between-day precision study were below 5%. The linearities were statistically acceptable (R2>0.99) for all items. The recovery rates ranged from 95.7 to 105.3%. The comparison study showed high correlation between Rx Imola and 747-100 or VITROS 950. Correlation coefficients of all items were above 0.99 except HDL and albumin.
Conclusions: This study showed satisfactory results in precision, linearity, recovery rates and comparison studies of Rx Imola. It was expected to be useful for routine chemistry analysis and back up, because of high performance, easy handling and small size.
Key Words:Rx Imola, Chemistry analyzer
교신저자:권계철
우) 301-721 대전광역시 중구 대사동 640 충남대학교병원 진단검사의학과
전화:042)280-7799, FAX:042)257-5365 E-mail:[email protected]
INTRODUCTION
Since the introduction of the first automated analyzer by Technicon in 1957, automated instru- ments have proliferated from many manufactures.
The manufacturers have adopted the more devel- oped features and technologies of other instru- ments to make their product more competitive, so that the differences of operating principles and their technologies are less distinct now than
beginning years of laboratory automation[1]. In this aspect, other characters including cost effectiveness, easy access, and less space occu- pation required in each condition of laboratories would be more considered.
Recently released an automated chemistry
analyzer, Rx Imola (Randox, Antrim, UK) is small
bench-top style one which is more beneficial for
limited space of small to medium sized
laboratories. At the request of a small laboratory
center, we evaluated the performance of Rx Imola,
based on the Clinical and Laboratory Standards
Institute (CLSI) guideline. And the correlation
study was performed comparing with 747-100
(HITACHI, Japan) and VITROS 950 (Ortho-
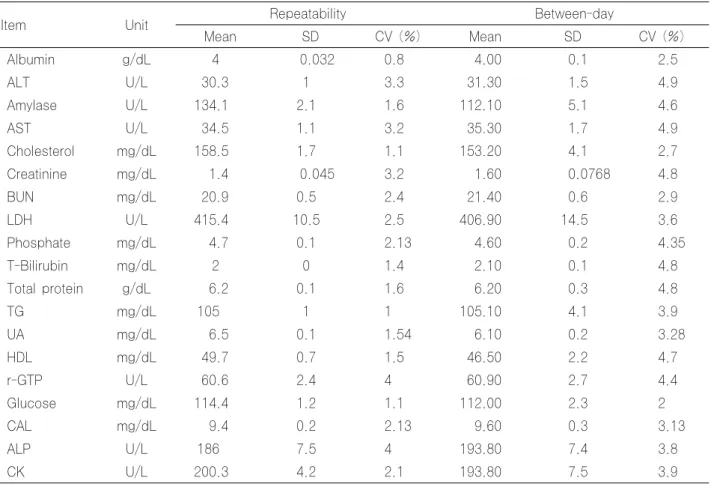
Table 1. The precision results with level 2 material of the Rx Imola
Item Unit Repeatability Between-day
Mean SD CV (%) Mean SD CV (%)
Albumin g/dL 4 0.032 0.8 4.00 0.1 2.5
ALT U/L 30.3 1 3.3 31.30 1.5 4.9
Amylase U/L 134.1 2.1 1.6 112.10 5.1 4.6
AST U/L 34.5 1.1 3.2 35.30 1.7 4.9
Cholesterol mg/dL 158.5 1.7 1.1 153.20 4.1 2.7
Creatinine mg/dL 1.4 0.045 3.2 1.60 0.0768 4.8
BUN mg/dL 20.9 0.5 2.4 21.40 0.6 2.9
LDH U/L 415.4 10.5 2.5 406.90 14.5 3.6
Phosphate mg/dL 4.7 0.1 2.13 4.60 0.2 4.35
T-Bilirubin mg/dL 2 0 1.4 2.10 0.1 4.8
Total protein g/dL 6.2 0.1 1.6 6.20 0.3 4.8
TG mg/dL 105 1 1 105.10 4.1 3.9
UA mg/dL 6.5 0.1 1.54 6.10 0.2 3.28
HDL mg/dL 49.7 0.7 1.5 46.50 2.2 4.7
r-GTP U/L 60.6 2.4 4 60.90 2.7 4.4
Glucose mg/dL 114.4 1.2 1.1 112.00 2.3 2
CAL mg/dL 9.4 0.2 2.13 9.60 0.3 3.13
ALP U/L 186 7.5 4 193.80 7.4 3.8
CK U/L 200.3 4.2 2.1 193.80 7.5 3.9
Abbreviatioins: SD, standard deviation; CV, coefficient of variation.
Clinical Diagnostics, NY, USA)
MATERIALS AND METHODS
1. Materials
Total 19 items were evaluated including AST, ALT, ALP, GGT, total bilirubin, calcium, phos- phorus, albumin, total protein, BUN, creatinine, glucose, amylase, total cholesterol, triglyceride, HDL, LDH, CK and uric acid.
Commercialized quality control materials;
Human assayed multi-sera Level 2 and Level 3 (Randox, Antrim, UK) were used for the precision study.
Patient’s sera and commercial control materials of highest and lowest concentration in each item were selected for linearity and recovery rate study.
VITROS 950 for amylase and 747-100 for other items were used as a comparative analyzer.
2. Methods
1) Evaluation of precision
For intermediate precision evaluation, repeat- ability, formerly termed within-day precision was preliminarily evaluated and followed by between- day precision evaluation. Twenty aliquots at each concentration levels were serially assayed in a day for evaluation of repeatability. For between-day precision evaluations, tests for each two samples of high and low concentrations were done twice separately during a day and for serial 20days which were above the minimum acceptable operating days recommended in CLSI guideline.
With standard deviation (SD) values of
repeatability and between-day precision study, SDs
for within- device precision were calculated using
the formula recommended by the CLSI guideline,
EP5-A2[2].
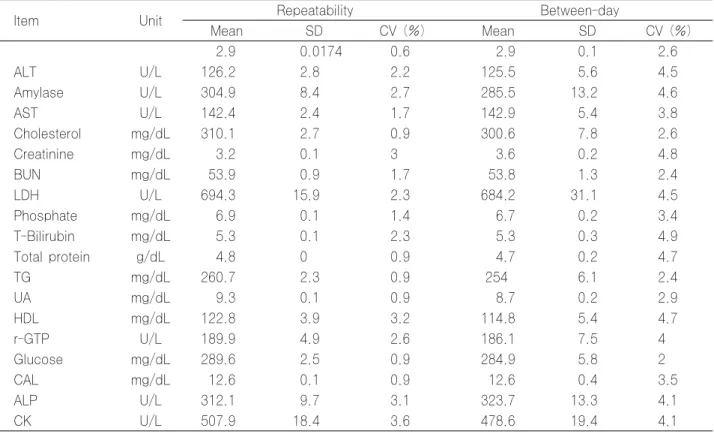
Table 2. The precision results with level 3 material of the Rx Imola
Item Unit Repeatability Between-day
Mean SD CV (%) Mean SD CV (%)
2.9 0.0174 0.6 2.9 0.1 2.6
ALT U/L 126.2 2.8 2.2 125.5 5.6 4.5
Amylase U/L 304.9 8.4 2.7 285.5 13.2 4.6
AST U/L 142.4 2.4 1.7 142.9 5.4 3.8
Cholesterol mg/dL 310.1 2.7 0.9 300.6 7.8 2.6
Creatinine mg/dL 3.2 0.1 3 3.6 0.2 4.8
BUN mg/dL 53.9 0.9 1.7 53.8 1.3 2.4
LDH U/L 694.3 15.9 2.3 684.2 31.1 4.5
Phosphate mg/dL 6.9 0.1 1.4 6.7 0.2 3.4
T-Bilirubin mg/dL 5.3 0.1 2.3 5.3 0.3 4.9
Total protein g/dL 4.8 0 0.9 4.7 0.2 4.7
TG mg/dL 260.7 2.3 0.9 254 6.1 2.4
UA mg/dL 9.3 0.1 0.9 8.7 0.2 2.9
HDL mg/dL 122.8 3.9 3.2 114.8 5.4 4.7
r-GTP U/L 189.9 4.9 2.6 186.1 7.5 4
Glucose mg/dL 289.6 2.5 0.9 284.9 5.8 2
CAL mg/dL 12.6 0.1 0.9 12.6 0.4 3.5
ALP U/L 312.1 9.7 3.1 323.7 13.3 4.1
CK U/L 507.9 18.4 3.6 478.6 19.4 4.1
Abbreviatioins: See Table 1.
Table 3. Within-Device Precision of the Rx Imola
Level 2 Level 3
Daily SD SD Daily SD SD
Albumin 0.06 0.07 0.06 0.08
ALT 1.39 1.51 3.11 3.79
Amylase 4.63 4.88 12.01 12.57
AST 1.48 1.75 2.95 4.15
Cholesterol 3.86 4.2 5.12 6.19
Creatinine 0.07 0.1 0.18 0.2
BUN 0.41 0.6 0.92 1.29
LDH 12.74 13.3 29.82 31.18
Phosphate 0.14 0.14 0.2 0.23
T-Bilirubin 0.17 0.24 0.27 0.28
Total protein 0.27 0.26 0.3 0.52
TG 3.73 3.99 5.08 5.49
UA 0.21 0.22 0.99 1.39
HDL 2.21 2.26 4.35 5.35
r-GTP 2.69 2.98 3.59 4.27
Glucose 2.16 2.33 3.55 4.14
CAL 0.29 0.32 2.35 3.38
ALP 7.21 7.61 12.94 13.64
CK 6.69 7.32 13.46 15.12
Abbreviatioins: See Table 1.
Table 4. Linearity result of the evaluation of Rx Imola
Items Units Linearity range Slope y-intercept R
2Low High
Albumin g/dL 2.63 6.20 0.9968 -0.0778 0.9956
ALT U/L 31.67 123.00 0.9909 -2.0161 0.9981
Amylase U/L 110.67 274.33 1.0034 0.6216 0.9999
AST U/L 35.00 139.67 0.9936 -1.5788 0.9991
CHOL mg/dL 41.25 364.75 1.0014 0.3457 1.0000
Cr mg/dL 0.64 13.53 0.9944 -0.0432 0.9999
HDL mg/dL 19.50 74.00 0.9967 -0.4168 0.9997
r-GTP U/L 56.60 181.50 0.9971 -1.2616 0.9997
Glu mg/dL 44.75 521.50 1.0089 0.3980 0.9995
LDH U/L 420.00 684.50 1.0013 -4.2188 0.9996
Phos. mg/dL 4.35 12.58 1.0117 0.0356 0.9985
T-BIL mg/dL 0.33 25.00 1.0117 -0.0375 0.9989
T.Pro g/dL 4.80 6.17 1.0021 -0.1772 0.9944
TG mg/dL 36.00 1067.67 1.0002 -1.7194 1.0000
UA mg/dL 1.30 21.50 0.9948 0.1380 0.9967
BUN mg/dL 23.37 57.07 1.0070 0.1070 0.9993
CAL mg/dL 9.50 12.53 1.0002 0.1728 0.9986
ALP U/L 22.00 540.00 0.9958 -2.3368 0.9998
CK U/L 31.00 1230.50 0.9999 -4.1370 0.9995
Table 5. Recovery rate (%) result of the evaluation of Rx Imola
Items Units 4L:0H 3L:1H 2L:2H 1L:3H 0L:4H
Albumin g/dL 100.00 99.29 96.23 101.73 100.00
ALT U/L 100.00 94.19 97.84 99.83 100.00
Amylase U/L 100.00 100.93 100.26 100.68 100.00
AST U/L 100.00 95.91 98.47 99.85 100.00
CHOL mg/dL 100.00 100.31 100.49 100.16 100.00
Cr mg/dL 100.00 98.64 98.38 99.10 100.00
HDL mg/dL 100.00 100.21 98.40 98.62 100.00
r-GTP U/L 100.00 98.01 99.16 100.17 100.00
Glu mg/dL 100.00 98.88 98.81 95.24 100.00
LDH U/L 100.00 99.63 100.14 100.64 100.00
Phos. mg/dL 100.00 102.24 100.74 102.91 100.00
T-BIL mg/dL 100.00 98.86 99.86 104.11 100.00
T-Pro g/dL 100.00 99.19 100.30 101.29 100.00
TG mg/dL 100.00 98.33 100.30 100.15 100.00
UA mg/dL 100.00 100.00 105.26 95.74 100.00
BUN mg/dL 100.00 101.39 100.46 101.70 100.00
CAL mg/dL 100.00 100.73 99.85 99.65 100.00
ALP U/L 100.00 96.04 100.18 99.07 100.00
CK U/L 100.00 99.74 97.11 101.33 100.00
2) Evaluation of linearity and recovery rate
Patient’s serums and commercial control materials of highest and lowest concentration in each item were selected. Five grade concentration subjects were prepared as 4:0, 3:1, 2:2, 1:3, 0:4.
Each subject was tested 2 times within 30 minutes[3].
Recovery rates were calculated as the percentage
of the measured to the expected for confirming the
linearity result[4, 5].
Fig. 1. Correlation study results with 747-100 (HITACHI, Japan) and VITROS 950 (Ortho-Clinical Diagnostics, USA).
3) Evaluation of correlation with well evaluated other machines.
More than 50 patients’ sera with variable concentrations measured by VITROS 950 for amylase and HITACHI 747-100 for other items were selected[6].
RESULTS
1) Evaluation of the precision
The results of repeatability and between-day precision were described respectively in table 1, 2.
Within-device precision SD results were described
in table 3.
2) Evaluation of linearity and recovery rate
The R
2values of different concentrations were above 0.99 in for all items and the intercept values were between -4.2188 and 0.6216 (Table 4). The recovery rates were in the range of 94.19 to 105.26% (Table 5).
3) Evaluation of correlation
Correlation coefficiencies were above 0.99 in 17 items except HDL and albumin which showed lower results as 0.9752 and 0.9449, respectively (Fig. 1).
DISCUSSION
Periodic and comprehensive medical examination for the whole nation has been recently issued and practiced as an important national health policy.
The chemical assays as liver function tests are basic items in the medical examination and also frequently ordered items even in primary care unit in Korea. So the requirement of chemical analyzers would be increased, and each laboratory would get to face to decide which instrument they will or would use.
This study of Rx Imola showed satisfactory results of precision, linearity, recovery rates and comparison studies. The limits of the allowable error which have been issued in evaluation of precision were very variety of range from 6 to 25%[7-10]. A document report presented that it can be acceptable when the coefficient of variation (CV) of albumin is less than 1% and of other items is less than 5%[4]. CVs of all items were below 5% ranging from 0.6~4.0% in repeatability evaluations. The CVs in level 2 materials of lower concentration were higher than in level 3 of higher concentration except 4 items including amylase, total bilirubin, HDL, and CK. The level 2 material of albumin had higher concentration and the level 3 had lower one, and the CV of level 2 was higher than that of level 3. Standard deviation (SD)s of lower concentration materials were lower than that of higher concentration materials in most items. In previous studies, CVs of low concentration materials have been reported as higher than those
of high concentration materials and the reason was suggested as the higher standard deviation of higher concentration materials might more affect higher CV[11,12].
As comparison with other reports, the evaluation for linearity, recovery rates showed excellent results. In the linearity study, the R
2values of different concentrations were above 0.99 in for all items and the intercept values were from -4.2188 to 0.6216, which were similar to or superior to those of previous studies[11-15]. With the results of the linearity study, recovery rates of high and low concentration samples were calculated in all items to evaluate the precision.
The range of the recovery rates was ranged from 94.19% of ALT to 105.26% of uric acid. Especially the subtracted value of recovery rates of commonly used item: creatinine, glucose, urea, uric acid, were zero to 5.26, which were the low and high values of the uric acid. The difference of the uric acid value was higher than those of other items, but it was acceptable compared to that of previous report from 0.9 to 3.6. Correlation coefficiencies were 0.9752 in albumin and 0.99 in other 17 items, which are above 0.975 recommened by NCCLS[16]. Only in HDL, it was 0.9449, which was lower than NCCLS guideline. In the previous correlation study of Dimension with Hitach 747, correlation coefficiency was 0.99, which was higher than our results between Rx Imola and Hitach 747[15]. The difference between two data with same referent machine could be explained as the difference between two evaluated machines, Dimension and Rx Imola, so further evaluation between the two might solve it.
Rx Imola is closed-system analyzers, of which
bar-code system remembers expire date and
calculating available tests of each reagent. In the
aspect of quality control for reagents, it seems to
be much beneficial because longer stability has
characterized many closed systems. There is also a
advantage in closed systems because no
technologist’s hand on time is required to
reconstitute or prepare the reagents for use. But
in the other hand, that closed system requires
reagents in a unique container or format provided
by the manufacturer can be also a limitation upon
flexible reagent using. In general, liquid reagents for open systems are cheaper than the proprietary components required for closed analyzers[17].
Bench-top small sized design looks more beneficial to relatively limited space of laboratories. The fact that the sample tray cannot access more than 72 samples at once would be a limitation in routine laboratories conducting large tests but this instrument would be serviceable in small to medium sized laboratories like primary care unit or general medical examination centers or in 3rd medical center for back up.
SUMMARY
제 목: 전자동 생화학 분석기 Rx Imola의 평가 저 자: 신소연, 권계철, 구선회, 박종우, 고지선 소 속: 충남대학교 의과대학 진단검사의학교실
배 경: 최근에 개발된 전자동 생화학 분석기 Rx Imola 의 유용성을 평가하고자 하였다.
방 법: AST, ALT, ALP, GGT, total bilirubin, calcium, phosphorus, albumin, total protein, BUN, creatinine, glucose, amylase, total cholesterol, Triglyceride, HDL, LDH, CK, uric acid 등의 19 항 목에 대하여 반복성(일중 정밀도), 일간 정밀도, 기기간 정 밀도, 직선성, 회수율 및 상관성을 분석하였다. 환자 검체 및 정도관리 물질인 Human assayed multi-sera Level2, Level3 (Randox, UK)를 사용하였고, 기기간 비 교검사를 위해 HITACHI 747-100 (HITACHI, Japan) 과 VITROS 950 (Ortho-Clinical Diagnostics, USA) 가 사용되었다.
결 과: 반복성, 일간 정밀도의 CV값이 모든 항목에서 5% 미만을 보였고, 직선성 분석에서는 모든 항목에서 R
2>0.99를 보였다. 회수율의 범위는 95.7%에서 105.3%
였다. 기존 장비와의 비교검사에서는 HDL과 albumin을 제외한 모든 항목에서 상관계수가 0.99를 보였다.
결 론: Rx Imola 는 정밀도, 직선성, 회수율, 기존 장 비와의 비교분석에서 만족할 만한 결과를 보여주었다. 윈도 우 XP에 기반을 둔 소프트웨어 관리는 기기 작동을 보다 손쉽게 할 수 있게 하였다. Bench-top 형태의 비교적 작 은 규모의 기기로 협소한 검사실의 공간에서 유용하게 쓰여 질 수 있을 것으로 생각된다.
REFERENCES