측정은 1960년대에 방사선면역측정법이 시작된 이래로 항체의 민 감도 향상, 표지자에 대한 연구와 더불어 다양한 면역분석법이 개 발되었다[2]. 이러한 종양표지자 검사의 결과는 환자 진료나 임상 적 판단에 중요한 기초 자료가 되므로, 정확한 검사 결과와 질 관 리가 요구된다. 최근 화학발광효소면역측정법(chemiluminescent enzyme immunoassay)를 원리로 하여 종양표지자, 호르몬, 바이 러스 항원과 항체 등의 다양한 항목을 검사할 수 있는 Lumipulse G1200 (Fujirebio, Tokyo, Japan)이 국내에 도입되었다. 저자들은 종양표지자인 carcinoembryonic antigen (CEA), α-fetoprotein (AFP), cancer antigen 125 (CA125), cancer antigen 15-3 (CA15-3), cancer antigen 19-9 (CA19-9), prostate specific antigen (PSA), pro- tein induced by vitamin K absence or antagonist-II (PIVKA-II), pepsinogen I과 pepsinogen II의 9가지 검사 항목에 대한 Lumi- pulse G1200의 수행능 평가 및 기존 면역검사 장비와의 상관성 평 가 등을 통하여 임상검사실에서의 유용성을 평가하고자 하였다.
서 론
종양표지자(tumor marker)는 종양세포 혹은 종양이 있는 숙주 에서 과도하게 생성되는 물질로서, 각종 암의 선별검사, 진단, 예후 추정, 치료효과 및 재발 판정 등에 널리 이용된다[1]. 종양표지자의
Lumipulse G1200의 종양표지자 분석능 평가
Evaluation of the Performance of Lumipulse G1200 for Tumor Marker Assays
조진희1·이철문1·박철민1·문희원1·허미나1·윤여민1·이우창2·전사일2·민원기2
Jin-Hee Cho, M.D.1, Chul-Moon Lee, M.T.1, Chul Min Park, M.D.1, Hee-Won Moon, M.D.1, Mina Hur, M.D.1, Yeo-Min Yun, M.D.1, Woochang Lee, M.D.2, Sail Chun, M.D.2, Won-Ki Min, M.D.2
건국대학교 의학전문대학원 진단검사의학교실1, 울산의대 서울아산병원 진단검사의학과2
Department of Laboratory Medicine1, Konkuk University School of Medicine, Seoul; Department of Laboratory Medicine2, University of Ulsan College of Medicine, Asan Medical Center, Seoul, Korea
http://dx.doi.org/10.3343/lmo.2012.2.3.131
Corresponding author: Yeo-Min Yun, M.D.
Department of Laboratory Medicine, Konkuk University Hospital, Konkuk University School of Medicine, 4-12 Hwayang-dong, Gwangjin-gu, Seoul 143-729, Korea
Tel: +82-2-2030-5582, Fax: +82-2-2030-5587, E-mail: [email protected]
Received: November 9, 2011 Revision received: April 3, 2012 Accepted: April 4, 2012
This article is available from http://www.labmedonline.org 2012, Laboratory Medicine Online
This is an Open Access article distributed under the terms of the Creative Commons Attribution Non-Commercial License (http://creativecommons.org/licenses/by-nc/3.0/) which permits unrestricted non-commercial use, distribution, and reproduction in any medium, provided the original work is properly cited.
Background: Tumor markers are used for diagnosing cancers and monitoring responses to cancer therapy. In this study, we evaluated the per- formance of Lumipulse G1200 (Fujirebio, Japan), a fully automated serum analyzer, for immunoassays of tumor markers.
Methods: We determined the precision and linearity of assays performed using Lumipulse G1200 and the correlation between the results of this and other analyzers used for tumor markers according to the guidelines of the Clinical and Laboratory Standards Institute (CLSI). We used 9 tumor markers, namely, carcinoembryonic antigen, α-fetoprotein, cancer antigen 125, cancer antigen 15-3 (CA 15-3), cancer antigen 19-9, prostate spe- cific antigen, protein induced by vitamin K absence or antagonist-II, and pepsinogens I and II. Further, we validated reference intervals using 20 serum samples of healthy individuals.
Results: Lumipulse G1200 yielded acceptable precision with total CV≤5% and within-run CV≤3% for all markers. Total CV for all markers was 2.4-3.7%, with the exception of CA 15-3 and pepsinogens I and II (CV, 4.0-5.0%). Linearity was observed for all markers over the entire analytical range. Results of Lumipulse G1200 were in good agreement with those of currently used analyzers with correlation coefficients>0.975 for all markers, except pepsinogen I (0.9569). The reference intervals provided by the manufacturer met the criteria mentioned in the CLSI guideline.
Conclusions: Assays using Lumipulse G1200 had high precision, clinically acceptable linearity, and good correlation with the established assays.
This indicates that Lumipulse G1200 can be potentially used in routine laboratories.
Key Words: Tumor maker, Lumipulse G1200, Precision, Linearity, Method comparison
대상 및 방법
1. 검사 대상 기기의 특성
Lumipulse G1200은 화학발광효소면역측정법(chemiluminescent enzyme immunoassay)을 측정 원리로 하여 한 검체당 최대 24종 류의 검사가 가능한 전자동 면역화학분석기이다. 모든 검사는 화 학발광법을 원리로 하며 2단계의 샌드위치 면역측정법(sandwich immunoassay)에 의해 이루어진다. 1단계에서 ferrite 입자가 결합 된 고정형 항체가 검체내 항원과 반응한다. 2단계에서 alkaline phosphatase가 접합된 항체를 첨가하면 분석물질과 경쟁적으로 결합한다. 여기에 화학발광기질을 첨가하면 고정상에 결합한 al- kaline phosphatase에 비례하여 발광신호가 방출되고 이를 발광 측정기가 감지하여 물질의 정량적인 측정이 가능하다. 검체 채취 시에는 일회용팁을 사용하므로 검체간의 잔효(carry over)가 없다.
검체 수납은 최대 100검체와 응급검체 추가가 가능하며, 시약 장착 대에는 36항목의 시약을 냉장 보관할 수 있고, 시약은 장착 후 30 일간 안정하다. 검사 소요시간은 시간당 최대 120개의 검체를 분 석할 수 있다.
2. 정밀도(Precision)
정밀도는 CLSI EP 5-A2: Evaluation of precision performance of quantitative measurement methods 지침에 준하여 평가하였다[3].
CEA, AFP, CA125, CA15-3, CA19-9, PSA, PIVKA-II의 7가지 항목은 Lyphochek Immunoassay TMJ control (Bio-Rad Laboratories, Hercules, CA, USA)을 사용하였고, Pepsinogen I 및 II는 HiSens Pepsinogen I, II control (HBI Co., Anyang, Korea)을 사용하였다.
TMJ control과 HiSens control은 모두 사람 혈청 성분을 기질로 한 정도관리 물질이다. 각 검사 항목마다 저농도 및 고농도의 정도관 리 물질을 20일간 연속해서 하루에 2회씩, 1회에 2번 반복 측정하 였다. 하루 2회 검사는 2시간 이상의 간격을 두고 오전과 오후로 나누어 실시하였다. 검사내 변이계수(within-run CV), 검사간 변이 계수(between-run CV), 검사일 간 변이계수(between-day CV)와 총 변이계수(total CV)를 구하였다. 정밀도 평가를 위한 변이계수 들은 CLSI EP5-A2에서 제시한 공식을 이용하여 산출하였다[3].
3. 직선성(Linearity)
직선성은 CLSI EP6-A: Evaluation of the linearity of quantitative measurement procedures 지침에 준하여 평가하였다[4]. 환자 검체 는 CEA, AFP, CA125, CA19-9, CA15-3, PSA는 Modular analytics E170 (Roche Diagnostics, IN, USA), PIVKA-II는 EP-one (Sanko Ju- nyaku Co., Tokyo, Japan), Pepsinogen I 및 II는 TBA-200FR Neo (Toshiba Medical Systems, Tokyo, Japan)의 값을 기준으로 수집하
였다. 고농도와 저농도의 환자 검체를 선별하여 4:0, 3:1, 2:2, 1:3, 0:4의 비율로 혼합하여 5가지 농도를 제조한 후, 각각의 농도에 대 해 2회씩 반복 측정하였다. 농도별 측정값의 평균을 기대값과 비교 하였다. 직선성을 나타내는 범위는 CLSI의 권고에 따라 1차, 2차, 3 차 방정식에 대한 다항회귀분석을 실시하고 deviation from linear- ity (DL)을 계산하였다. DL의 기준은 5%로 설정하였다. 다항회귀 분석에서 비선형방정식이 유의확률 5% 이하로 나타나면, DL의 기 준치를 벗어나는 최저농도 혹은 최고농도의 결과값을 순차적으로 제외하고 남은 농도에 대해 다시 다항회귀분석을 실시하였다. 선형 방정식이 유의하게 나올 때의 농도 범위를 직선성을 만족하는 범 위로 설정하고, 회귀방정식과 결정계수(R2)를 구하였다[4].
4. 상관성(Method comparison)
다른 장비와의 상관성은 CLSI EP9-A2: Method comparison and bias estimation using patient sample 지침에 준하여 평가하였다[5].
각 검사 항목별로 참고 구간에 포함된 농도와 참고 구간을 벗어난 농도가 모두 포함되도록 40검체를 수집하여 분석하였으며, 각 검 체는 2번씩 반복 측정하였다. CEA, AFP, CA 125의 3가지 항목은 Modular analytics E170 (Roche Diagnostics) 및 Architect i2000 SR (Abbott Diagnostics, IL, USA) 결과와 비교하고, CA19-9는 Modu- lar analytics E170 및 Cobas 6000 (Roche Diagnostics)과 비교하였 다. PSA와 CA15-3은 Modular analytics E170의 결과와 비교하였다, CEA, AFP, CA1 125, CA 19-9, CA 15-3의 결과값은 각각 비교 장비 의 제조사에서 제공하는 전용 시약과 보정물질을 사용하여 측정 하였다. PIVKA-II는 Eitest ELISA kit (Eisai Co., Tokyo, Japan)을 사 용하여 EP-one 장비에서 측정한 결과와, Pepsinogen I과 II는 Hi- Sens Pepsinogen kit (HBI Co.)을 사용하여 TBA-200FR Neo 장비 에서 측정한 결과와 비교하였다. Lumipulse G1200의 결과값은 Fujirebio사의 전용 시약과 보정물질을 사용하여 측정하였다. 상관 성 검증은 일반선형모델을 이용하여 회귀분석을 실시하고 상관방 정식과 Pearson 상관계수 R을 구하였으며, 오차도표를 그렸다.
5. 참고 구간 검증
참고 구간 검증은 CLSI C28-A3: How to define and determine reference intervals in the clinical laboratory 지침에 따라 실시하였 다[6]. 검사 항목별로 건강검진 센터에서 수집된 과거력과 약물 복 용력, 혈액검사에서 이상소견이 없는 28-47세 사이의 남녀 각 10검 체를 분석하여 제조사에서 제시하는 참고 구간과 비교하였다. 총 20검체의 결과 중 2개 이하가 제조사의 참고 구간을 벗어나면 제 조사의 참고구간을 사용할 수 있는 것으로 판단하였다[6].
6. 통계처리
모든 통계처리는 Analyse-it (Analyse-it Software Ltd., Leeds, UK) 프로그램을 이용하였다.
결 과
1. 정밀도
검사 중 정밀도는 변이계수가 1.0-3.0%의 범위를 나타내었다. 총 정밀도는 AFP, CEA, CA 19-9, CA125, PSA, PIVKA-II의 항목의 경
우 변이계수가 2.3-3.7%, CA 15-3, Pepsinogen I 및 II 항목의 경우 3.7-5.0%였다(Table 1).
2. 직선성
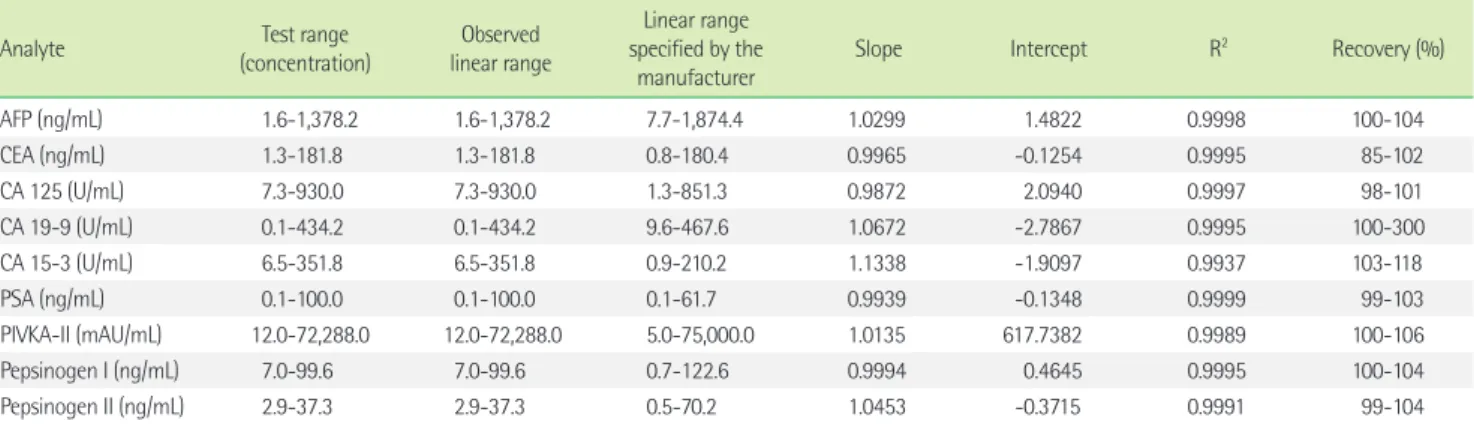
모든 검사 항목에서 결정계수가 0.99 이상으로 참고 구간을 포 함한 충분히 넓은 임상적 농도 범위에서 직선성을 나타내었다. 9항 목 중 7항목에서 기대값 대비 회수율은 98-118% 범위로 확인되었 다(Table 2, Fig. 1).
Table 1. Precision profiles for the 9 tumor markers
Analyte Specimen
(control material) Mean concentration
CV (%)
CVw* [8] Desirable precision criteria (%)* [11]
Within-run Between-run Between-day Total
AFP (ng/mL) Low 18.61 1.6 1.2 1.7 2.5 12.0 6.0
High 198.70 1.3 0.0 1.9 2.3
CEA (ng/mL) Low 5.62 2.4 0.0 2.2 3.3 12.7 6.4
High 60.30 1.3 0.5 2.9 3.2
CA 15-3 (U/mL) Low 16.07 3.0 1.4 2.5 4.1 6.1 3.1
High 96.65 2.5 3.3 2.8 5.0
CA 19-9 (U/mL) Low 25.63 1.9 1.4 2.2 3.2 16.0 8.0
High 84.73 1.0 1.1 2.7 3.1
CA 125 (U/mL) Low 23.73 2.2 0.6 2.0 3.0 24.7 12.4
High 82.80 1.3 1.1 1.6 2.4
PSA (ng/mL) Low 0.89 1.4 0.6 2.7 3.2 18.1 9.1
High 20.83 0.9 1.0 2.7 3.1
PIVKA-II (mAU/mL) Low 40.30 3.0 2.1 0.2 3.7 NA NA
High 166.10 2.0 1.5 1.7 3.0
Pepsinogen I (ng/mL) Low 23.36 2.0 0.0 3.9 4.4 NA NA
High 55.89 1.3 1.5 3.5 4.0
Pepsinogen II (ng/mL) Low 8.67 1.5 1.7 2.9 3.7 NA NA
High 34.09 1.4 1.0 4.6 5.0
*Within-subject biological variation and desirable analytical precision criteria are referred from Rico et al. [8] and the biological variation database specification in Westgard’s web site (http://www.westgard.com/biodatabase1.htm) [11].
Abbreviations: CVw, within-subject biologic variation; AFP, α-fetoprotein; CEA, carcinoembryonic antigen; CA 15-3, cancer antigen 15-3; CA 19-9, cancer antigen 19-9; CA 125, cancer antigen 125; PSA, prostate specific antigen; PIVKA-II, protein induced by vitamin K absence or antagonist-II; NA, not applicable.
Table 2. Linearity of the results obtained using Lumipulse G1200
Analyte Test range
(concentration)
Observed linear range
Linear range specified by the
manufacturer Slope Intercept R2 Recovery (%)
AFP (ng/mL) 1.6-1,378.2 1.6-1,378.2 7.7-1,874.4 1.0299 1.4822 0.9998 100-104
CEA (ng/mL) 1.3-181.8 1.3-181.8 0.8-180.4 0.9965 -0.1254 0.9995 85-102
CA 125 (U/mL) 7.3-930.0 7.3-930.0 1.3-851.3 0.9872 2.0940 0.9997 98-101
CA 19-9 (U/mL) 0.1-434.2 0.1-434.2 9.6-467.6 1.0672 -2.7867 0.9995 100-300
CA 15-3 (U/mL) 6.5-351.8 6.5-351.8 0.9-210.2 1.1338 -1.9097 0.9937 103-118
PSA (ng/mL) 0.1-100.0 0.1-100.0 0.1-61.7 0.9939 -0.1348 0.9999 99-103
PIVKA-II (mAU/mL) 12.0-72,288.0 12.0-72,288.0 5.0-75,000.0 1.0135 617.7382 0.9989 100-106
Pepsinogen I (ng/mL) 7.0-99.6 7.0-99.6 0.7-122.6 0.9994 0.4645 0.9995 100-104
Pepsinogen II (ng/mL) 2.9-37.3 2.9-37.3 0.5-70.2 1.0453 -0.3715 0.9991 99-104
Abbreviations: AFP, α-fetoprotein; CEA, carcinoembryonic antigen; CA 15-3, cancer antigen 15-3; CA 19-9, cancer antigen 19-9; CA 125, cancer antigen 125; PSA, prostate specific antigen; PIVKA-II, protein induced by vitamin K absence or antagonist-II.
3. 상관성
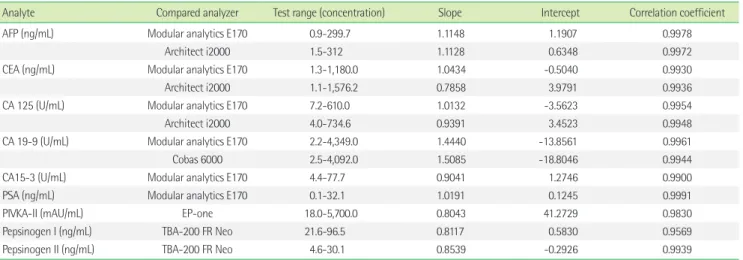
상관방정식의 기울기는 0.7858-1.5085 범위에 있었다. Pepsinogen I을 제외한 모든 항목에서 상관계수는 0.975 이상으로 밀접한 상관 관계를 갖는 것으로 나타났다. Pepsinogen I은 Lumipulse G1200 결과와 TBA-200 FR Neo로 측정한 결과간의 상관계수가 0.9569였 다(Table 3, Fig. 2, 3).
4. 참고 구간 검증
CEA, CA19-9, PSA, Pepsinogen I과 II는 20검체 모두 제조사에 서 제시한 참고 구간 내에 분포하였다. CA125, CA 15-3과 PIVKA-II 는 20검체 중 1검체가, AFP은 20검체 중 2검체가 제조사의 참고 구 간을 벗어났다. 제조사에서 제시한 참고 구간은 CEA는 5.2 ng/mL 이하, AFP은 8.5 ng/mL 이하, CA125는 28.0 U/mL 이하, CA15-3은 19.1 U/mL 이하, CA19-9는 36.8 U/mL 이하, PSA는 2.392 ng/mL 이 하이며, PIVKA-II는 9.1-27.8 mAU/mL, Pepsinogen I은 21.5-104.9 ng/mL, Pepsinogen II는 3.3-28.8 ng/mL이다. 따라서 9종의 검사항 목 모두 제조사의 참고구간을 사용할 수 있었다.
고 찰
본 연구에서는 Lumipulse G1200의 수행능에 대해 검사의 정밀 도, 직선성, 기존 면역장비와의 상관성을 비교 평가하고, 제조사에 서 제공하는 참고 구간을 검증하였다.
검사 장비의 정밀도 평가에는 여러 가지 다양한 판단기준의 적 용이 가능한데, 일반적으로 개인 내 생물학적 변이(intra-individ- ual biological variation)에 따라 설정된 검사 정밀도 허용기준(de- sirable analytical precision criteria)이 사용된다[7]. 통상적으로 검 사 정밀도가 해당 항목에 대한 개인의 생물학적 변이의 50% 이내 인 경우 임상 검사로서 적합한 것으로 여겨지는데[8], 이는 동일 환 자에서 검사결과를 주기적으로 모니터링할 때 정상적으로 관찰되 는 전체 변이 중 검사에 의한 오차 가능성이 차지하는 비율이 12%
이내로, 동일 환자에서 검사 결과 모니터링 시 임상적으로 의미 있 는 병적 변화(pathologic change)와 정상적인 생물적 변이(biologi- cal variation)를 무리 없이 구별할 수 있는 분석 오차의 수준이다 [9, 10].
종양표지자 검사의 정밀도 평가기준을 개인 내 생물학적 변이의 50%로 설정할 경우, AFP은 6.0%, CEA는 6.4%, CA15-3은 3.1%, Fig. 1. Linearity of concentrations estimated by the Lumipulse G1200 assay for 9 tumor markers. Concentra- tion of each tumor marker is shown on a separate graph (A-I).
Abbreviations: AFP, α-fetoprotein; CEA, carcinoembryonic antigen; CA 125, cancer antigen 125; CA 15-3, cancer antigen 15-3; CA 19-9, cancer antigen 19-9; PSA, prostate specific antigen; PIVKA-II, protein induced by vitamin K absence or antagonist-II.
1,600 1,400 1,200 1,000 800 600 400 200 0
Observed AFP (ng/mL)
0 200 400 600 800 1,000 1,200 1,400 1,600 Expected AFP (ng/mL)
y=1.0299x+1.4822 R2=0.9998
AFP
A
500 450 400 350 300 250 200 150 100 50 0
Observed CA 19-9 (U/mL)
Expected CA 19-9 (U/mL) y=1.0672x-2.7867 R2=0.9995
CA 19-9
E
40 35 30 25 20 15 10 5 0
Observed Pepsinogen II (ng/mL)
0 5 10 15 20 25 30 35 40 Expected Pepsinogen II (ng/mL)
y=1.0453x-0.3715 R2=0.9991 Pepsinogen II
I
200 180 160 140 120 100 80 60 40 20 0
Observed CEA (ng/mL)
0 20 40 60 80 100 120 140 160 180 200 Expected CEA (ng/mL)
y=0.9965x-0.1254 R2=0.9995
CEA
B
100 90 80 70 60 50 40 30 20 10 0
Observed PSA (ng/mL)
0 10 20 30 40 50 60 70 80 90 100 Expected PSA (ng/mL)
y=0.9939x-0.1348 R2=0.9999
PSA
F
1,000 900 800 700 600 500 400 300 200 100 0
Observed CA 125 (U/mL)
0 200 400 600 800 1,000 Expected CA 125 (U/mL)
y=0.9872x+2.0940 R2=0.9997
CA 125
C
80,000 70,000 60,000 50,000 40,000 30,000 20,000 10,000 0
Observed PIVKA-II (mAU/ML)
0 10,000 20,000 30,000 40,000 50,000 60,000 70,000 80,000
Expected PIVKA-II (mAU/mL) y=1.0135x+617.7382 R2=0.9989
PIVKA-II
G
400 350 300 250 200 150 100 50 0
Observed CA 15-3 (U/mL)
0 50 100 150 200 250 300 350 400 Expected CA 15-3 (U/mL)
y=1.1338x-1.9097 R2=0.9937 CA 15-3
D
110 100 90 80 70 60 50 40 30 20 10 0
Observed Pepsinogen I (ng/mL)
0 10 20 30 40 50 60 70 80 90 100 110 Expected Pepsinogen I (ng/mL)
y=0.9994x+0.4645 R2=0.9995 Pepsinogen I
H
0 50 100 150 200 250 300 350 400 450 500
Table 3. Comparison of results obtained using Lumipulse G1200 and other analyzers
Analyte Compared analyzer Test range (concentration) Slope Intercept Correlation coefficient
AFP (ng/mL) Modular analytics E170 0.9-299.7 1.1148 1.1907 0.9978
Architect i2000 1.5-312 1.1128 0.6348 0.9972
CEA (ng/mL) Modular analytics E170 1.3-1,180.0 1.0434 -0.5040 0.9930
Architect i2000 1.1-1,576.2 0.7858 3.9791 0.9936
CA 125 (U/mL) Modular analytics E170 7.2-610.0 1.0132 -3.5623 0.9954
Architect i2000 4.0-734.6 0.9391 3.4523 0.9948
CA 19-9 (U/mL) Modular analytics E170 2.2-4,349.0 1.4440 -13.8561 0.9961
Cobas 6000 2.5-4,092.0 1.5085 -18.8046 0.9944
CA15-3 (U/mL) Modular analytics E170 4.4-77.7 0.9041 1.2746 0.9900
PSA (ng/mL) Modular analytics E170 0.1-32.1 1.0191 0.1245 0.9991
PIVKA-II (mAU/mL) EP-one 18.0-5,700.0 0.8043 41.2729 0.9830
Pepsinogen I (ng/mL) TBA-200 FR Neo 21.6-96.5 0.8117 0.5830 0.9569
Pepsinogen II (ng/mL) TBA-200 FR Neo 4.6-30.1 0.8539 -0.2926 0.9939
Abbreviations: AFP, α-fetoprotein; CEA, carcinoembryonic antigen; CA 15-3, cancer antigen 15-3; CA 19-9, cancer antigen 19-9; CA 125, cancer antigen 125; PSA, prostate specific antigen; PIVKA-II, protein induced by vitamin K absence or antagonist-II.
Fig. 2. Regression plots of concentrations of 9 tumor markers measured using Lumipulse G1200 and other analyzers. (A) AFP: Modular analytics E170 vs. Lumipulse G1200, (B) AFP: Architect i2000 vs. Lumipulse G1200, (C) CEA: Modular analytics E170 vs. Lumipulse G1200, (D) CEA: Architect i2000 vs. Lumipulse G1200, (E) CA 125: Modular analytics E170 vs. Lumipulse G1200, (F) CA 125: Architect i2000 vs. Lumipulse G1200, (G) CA 19- 9: Modular analytics E170 vs. Lumipulse G1200, (H) CA 19-9: Cobas 6000 vs. Lumipulse G1200, (I) CA 15-3: Modular analytics E170 vs. Lumipulse G1200, (J) PSA: Modular analytics E170 vs. Lumipulse G1200, (K) PIVKA-II: EP-one vs. Lumipulse G1200, (L) Pepsinogen I: TBA-200 FR Neo vs. Lu- mipulse G1200, (M) Pepsinogen II: TBA-200 FR Neo vs. Lumipulse G1200. The blue line represents the linear regression, and the gray line is a theo- retical line with a slope of 1.0 and a Y intercept of 0.
Abbreviations: AFP, α-fetoprotein; CEA, carcinoembryonic antigen; CA 125, cancer antigen 125; CA 15-3, cancer antigen 15-3; CA 19-9, cancer antigen 19-9; PSA, prostate specific antigen; PIVKA-II, protein induced by vitamin K absence or antagonist-II.
350 300 250 200 150 100 50 0
Lumipulse G1200 (ng/mL)
0 50 100 150 200 250 300 350 Modular analytics E170 (ng/mL)
y=1.1148x+1.1907 R=0.9975
AFP
A
350 300 250 200 150 100 50 0
Lumipulse G1200 (ng/mL)
0 50 100 150 200 250 300 350 Architect i2000 (ng/mL)
y=1.1128x+0.6348 R=0.9972
AFP
B
1,600 1,400 1,200 1,000 800 600 400 200 0
Lumipulse G1200 (ng/mL)
0 200 400 600 800 1,000 1,200 1,400 1,600
Modular analytics E170 (ng/mL) y=1.0434x-0.5040 R=0.9930
CEA
C
6,000 5,000 4,000 3,000 2,000 1,000 0
Lumipulse G1200 (mAU/mL)
0 1,000 2,000 3,000 4,000 5,000 6,000
EP-one (mAU/mL) y=0.8043x+41.2729 R=0.9830 PIVKA-II
K
100 90 80 70 60 50 40 30 20 10
Lumipulse G1200 (ng/mL)
10 20 30 40 50 60 70 80 90 100 TBA-200 FR Neo (ng/mL)
y=0.8117x+0.5830 R=0.9569 Pepsinogen I
L
30 25 20 15 10 5 0
Lumipulse G1200 (ng/mL)
0 5 10 15 20 25 30 TBA-200 FR Neo (ng/mL)
y=0.8539x-0.2926 R=0.9939
M
1,600 1,400 1,200 1,000 800 600 400 200 0
Lumipulse G1200 (ng/mL)
0 200 400 600 800 1,000 1,200 1,400 1,600
Architect i2000 (ng/mL) y=0.7858x+3.9791 R=0.9936
CEA
D
800 700 600 500 400 300 200 100 0
Lumipulse G1200 (U/mL)
0 100 200 300 400 500 600 700 800 Modular analytics E170 (U/mL)
y=1.0132x-3.5623 R=0.9954
CA 125
E
800 700 600 500 400 300 200 100 0
Lumipulse G1200 (U/mL)
0 100 200 300 400 500 600 700 800 Architect i2000 (U/mL)
y=0.9391x+3.4523 R=0.9948
CA 125
F
7,000 6,000 5,000 4,000 3,000 2,000 1,000 0
Lumipulse G1200 (U/mL)
0 1,000 2,000 3,000 4,000 5,000 6,000 7,000
Modular analytics E170 (U/mL) y=1.4440x-13.856 R=0.9961
CA 19-9
G Cobas 6000 (U/mL)
H
80 70 60 50 40 30 20 10
Lumipulse G1200 (U/mL)
0 10 20 30 40 50 60 70 80 Modular analytics E170 (U/mL)
y=0.9041x+1.2746 R=0.9900
CA 15-3
I
35 30 25 20 15 10 5 0
Lumipulse G1200 (ng/mL)
0 5 10 15 20 25 30 35 Modular analytics E170 (ng/mL)
y=1.0191x+0.1245 R=0.9991
PSA
J
7,000 6,000 5,000 4,000 3,000 2,000 1,000 0
Lumipulse G1200 (U/mL)
y=1.5085x-18.8046 R=0.9944
CA 19-9
0 1,000 2,000 3,000 4,000 5,000 6,000 7,000
Pepsinogen II
CA19-9는 8.0%, PSA는 9.1%, CA 125는 12.4%의 기준을 적용할 수 있다[11-13]. 또한 National academy of clinical biochemistry (NACB) 에서는 종양표지자 검사의 정밀도 허용기준으로 검사 중 변이계수 는 5% 미만, 검사간 변이계수는 10% 미만, 총 변이계수는 20% 미 만을 권장하고 있다[14]. 본 연구의 Lumipulse G1200 종양표지자 검사에 대한 정밀도 평가에서 AFP, CEA, CA 15-3, CA 19-9, CA 125, PSA 검사항목의 경우 NACB의 총 정밀도 권고 기준을 모두 만족 하였고, AFP, CEA, CA 19-9, CA 125, PSA 검사항목의 경우 생물학 적 변이에 근거한 총 정밀도 허용기준을 만족하여, 상기 검사항목 을 임상에서 환자 질환 상태 변화 모니터링의 목적으로 사용하는 데 무리가 없을 것으로 판단되었다.
Lumipulse G1200의 직선성 평가에서 모든 항목이 제조사에서 제시하는 직선성의 범위를 만족하였다. 또한 CA 125, CA 15-3, PSA 항목은 제조사의 직선성 범위보다 더 높은 범위까지 직선성을 만
족하였다. 그러나, CEA, CA125, CA 15-3, PIVKA-II, Pepsinogen 항 목의 저농도 검체와 CA19-9, PIVKA-II, Pepsinogen 항목의 고농도 검체는 검체 수집에 한계가 있어 제한된 범위에서만 직선성을 확 인하였다. 기대치 대비 회수율은 CEA의 저농도 검체에서 85%, CA 19-9의 저농도 검체에서 300%로 기대치를 벗어나는 결과를 보였 다. 하지만, 이는 모두 저농도 검체에서 확인된 결과로 측정값이 너 무 작아 절대적인 수치의 차이는 적으나, 백분율로 환산 시 회수율 이 차이가 크게 계산된 것이다.
Lumipulse G1200 종양표지자 검사 항목의 상관성 평가에서 검 사 결과의 절대값 차이를 개인 생물학적 변이(individual biological variation)에 근거한 검사 바이어스 허용기준(desirable analytical bias criteria)으로 평가하였을 때, CA125와 CA15-3, PSA는 허용기 준 이내로 확인되었다. CEA의 경우 Lumipulse G1200과 E170의 검 사 결과 절대값 간 평균 백분율(percent mean) 차이는 1.7%로 허 Fig. 3. Bland-Altman plots showing the means of the paired difference in the concentrations of tumor markers measured using Lumipulse G1200 and different analyzers. (A) AFP: Modular analytics E170 vs. Lumipulse G1200, (B) AFP: Architect i2000 vs. Lumipulse G1200, (C) CEA: Modular an- alytics E170 vs. Lumipulse G1200, (D) CEA: Architect i2000 vs. Lumipulse G1200, (E) CA 125: Modular analytics E170 vs. Lumipulse G1200, (F) CA 125, Architect i2000 vs. Lumipulse G1200, (G) CA 19-9: Modular analytics E170 vs. Lumipulse G1200, (H) CA 19-9: Cobas 6000 vs. Lumipulse G1200, (I) CA 15-3: Modular analytics E170 vs. Lumipulse G1200, (J) PSA: Modular analytics E170 vs. Lumipulse G1200, (K) PIVKA-II: EP-one vs. Lumipulse G1200, (L) Pepsinogen I: TBA-200 FR Neo vs. Lumipulse G1200, (M) Pepsinogen II: TBA-200 FR Neo vs. Lumipulse G1200. Thick solid lines show the means of the paired differences, and thin solid lines represent lines of identity. Dashed lines show 95% limits of agreement (means of paired dif- ferences±1.96 SD).
Abbreviations: AFP, α-fetoprotein; CEA, carcinoembryonic antigen; CA 125, cancer antigen 125; CA 15-3, cancer antigen 15-3; CA 19-9, cancer antigen 19-9; PSA, prostate specific antigen; PIVKA-II, protein induced by vitamin K absence or antagonist-II.
40 30 20 10 0 -10 -20 -30 -40 Difference (ng/mL) [Lumipulse G1200 - E170]
0 50 100 150 200 250 300 350 Mean of AFP (ng/mL)
Mean=5.001 (+21.2%) -1.96 SD -12.791 +1.96 SD 22.793 AFP
A
40 30 20 10 0 -10 -20 -30 -40 Difference (ng/mL) [Lumipulse G1200 - Architect i2000]
0 50 100 150 200 250 300 350 Mean of AFP (ng/mL)
Mean=4.442 (+12.7%) -1.96 SD -13.635 +1.96 SD 22.520 AFP
B
300 200 100 0 -100 -200 -300 Difference (ng/mL) [Lumipulse G1200 - E170]
0 200 400 600 800 1,000 1,200 1,400
Mean of CEA (ng/mL) Mean=4.624
(+1.7%) -1.96 SD -54.171
+1.96 SD 63.420 CEA
C Mean of AFP (ng/mL)
Mean= -28.428 (-8.3%) -1.96 SD -166.021 +1.96 SD 109.164 CEA
D
100 60 20 -20 -60 -100 Difference (U/mL) [Lumipulse G1200 - E170]
0 100 200 300 400 500 600 700 Mean of CA 125 (U/mL)
Mean=-1.642 (-9.1%) -1.96 SD -32.328 +1.96 SD 29.043 CA 125
E
100 60 20 -20 -60 -100 Difference (U/mL) [Lumipulse G1200 - Architect i2000]
0 100 200 300 400 500 600 700 Mean of CA 125 (U/mL)
Mean= -5.675 (-2.2%) -1.96 SD -44.692 +1.96 SD 33.348 CA 125
F
2,000 1,500 1,000 500 0 -500 -1,000 -1,500 -2,000 Difference (U/mL) [Lumipulse G1200 - E170]
0 1,000 2,000 3,000 4,000 Mean of CA 19-9 (U/mL)
Mean=163.725 (+14.1%) -1.96 SD -764.394 +1.96 SD 1,091.844 CA 19-9
G
2,000 1,500 1,000 500 0 -500 -1,000 -1,500 -2,000 Difference (U/mL) [Lumipulse G1200 - Cobas 6000]
Mean=177.547 (+5.9%)
-1.96 SD -844.971 +1.96 SD 1,200.066 CA 19-9
H
10 8 6 4 2 0 -2 -4 -6 -8 -10 Difference (U/mL) [Lumipulse G1200 - E170]
0 10 20 30 40 50 60 70 80 Mean of CA 15-3 (U/mL)
Mean=-0.246 (+2.8%) -1.96 SD -0.246
+1.96 SD 4.608 CA 15-3
I
2 1.5 1 0.5 0 -0.5 -1 -1.5 -2 Difference (ng/mL) [Lumipulse G1200 - E170]
0 5 10 15 20 25 30 35 Mean of PSA (ng/mL)
Mean=0.231 (4.5%) -1.96 SD -0.452 +1.96 SD 0.914 PSA
J
2,000 1,500 1,000 500 0 -500 -1,000 -1,500 -2,000 Difference (mAU/mL) [Lumipulse G1200 - EP-one]
0 1,000 2,000 3,000 4,000 5,000 6,000
Mean of PIVKA-II (mAU/mL) Mean=-68.145
(-12.8%) -1.96 SD -690.681 +1.96 SD 554.392 PIVKA-II
K
30 20 10 0 -10 -20 -30 Difference (ng/mL) [Lumipulse G1200 - TBA-200 FR NEO]
10 20 30 40 50 60 70 80 90 100 Mean of Pepsinogen I (ng/mL)
Mean=-9.218 (-19.9%) -1.96 SD -19.957
+1.96 SD 1.521
L
8 6 4 2 0 -2 -4 -6 -8 Difference (ng/mL) [Lumipulse G1200 - TBA-200 FR NEO]
0 5 10 15 20 25 30 Mean of Pepsinogen II (ng/mL)
Mean=-1.953 (-19.4%) -1.96 SD -4.199
+1.96 SD 0.294 Pepsinogen II Pepsinogen I
M
Difference (ng/mL) [Lumipulse G1200 - Architect i2000]300 200 100 0 -100 -200
-3000 200 400 600 800 1,000 1,200 1,400
0 1,000 2,000 3,000 4,000 Mean of CA 19-9 (U/mL)
용기준 이내였으나, Architect i2000과의 차이는 8.3%로 허용기준 인 6.4%를 초과하였다. Architect i2000 (Abbott Diagnostics)은 Lu- mipulse나 E170 (Roche Diagnostics)에 비해 CEA 값을 더 높게 측 정하는 경향을 보였는데, 이는 검사 장비는 다르지만 제조사가 동 일한 AxSYM (Abbott Diagnostics)과 Elecsys 2010 (Roche diag- nostics)의 비교 연구에서도 확인된 바 있다[2]. AFP은 Lumipulse G1200과 E170 또는 Architect i2000과의 결과값 차이가 모두 허용 기준인 6.0%를 초과하였다. 측정장비에 따른 종양표지자 결과의 차이는 기존 연구에서도 보고되었는데[15, 16], 결과값의 차이를 보 이는 원인으로는 분석 방법에 따라 사용되는 시약의 항체 특이성 차이, 제조사에서 제공하는 보정물질에 대한 측정소급성 확보 방 식의 차이[17], 연구에서 사용된 비교평가 장비에 계통오차가 존재 할 가능성 등을 생각할 수 있다.
CA19-9의 경우에는 Lumipulse와 Cobas 6000의 결과값은 5.9%
의 차이를 보인 반면, E170과는 14.1%의 차이를 보여 허용기준인 8.0%를 초과하는 결과를 보였다. 추가적으로 E170과 Cobas 6000 의 CA19-9 결과값을 비교했을 때, 상관방정식의 기울기는 1.0456, 상관계수는 0.9992로 상관성은 우수했으나 7.5%의 차이를 나타내 었다. E170과 Cobas 6000의 경우 동일 제조사의 시약을 사용하여 서로 다른 기관에서 측정하였다. 따라서 E170과 Cobas 6000 결과 값의 차이는 측정 장비 또는 시약의 영향보다는 검사실 간 차이로 추측되며, Lumipulse와의 허용기준 차이는 E170과 Cobas 6000간 의 차이가 반영된 결과로 생각된다. PIVKA-II와 Pepsinogen I/II 검 사 항목의 경우 상기 항목에 대한 개인 생물학적 변이가 보고된 바 없어 이에 근거한 판단이 어려우나, 비교 장비간 평균 결과값의 차 이가 각각 -12.9%, -19.9%, -19.4%로 다른 평가 대상 종양표지자 검 사항목의 장비 간 차이에 비하여 높은 수치를 나타내었다.
동일 검체를 이용한 검사법 간 검사 결과의 상관성 비교에서 확 인된 결과의 절대값 차이가 개인의 생물학적 변이에 근거한 검사 바이어스 허용기준 이내인 경우 기존 검사법의 정상 참고 구간을 서로 공유할 수 있다. 하지만 상관성 비교 장비 결과값 간에 바이 어스 허용기준을 넘는 차이가 존재하는 경우, 새로운 검사법을 이 용하여 정상인 120명의 검체를 대상으로 정상 참고 구간을 설정한 후 새로운 검사법의 결과값을 환자의 진단 목적으로 사용할 수 있 으나, 기존 검사법의 결과값과 직접적인 비교가 어렵다[18]. 실제로 모든 항목에서 제조사에서 제시하는 참고 구간과 기존 면역장비 의 참고 구간에 차이가 있었다. 특히 Lumipulse G1200에서 높게 측정되는 경향을 보인 CA 19-9의 참고 구간 상한 값인 36.8 U/mL 은 비교 장비의 상한 값인 27 U/mL보다 높았으며, Lumipulse G1200 에서 낮게 측정되는 경향을 보인 Pepsinogen I 및 II의 참고 구간 상한 값인 104.9 ng/mL 및 28.8 ng/mL은 HiSens Pepsinogen kit의 160 ng/mL 및 70 ng/mL보다 낮았다.
결론적으로, Lumipulse G1200에 대한 평가 결과, 정밀도가 매우 우수하였고, 임상적으로 유용한 범위 내에서 직선성을 나타내었 다. 다만, 기존의 면역학적 측정법과 비교에서 비교 장비 간 상관성 은 매우 우수하나, 일부 항목의 경우 결과값의 차이가 관찰되어 다 른 검사장비 또는 검사법을 사용하는 종양표지자 검사 결과값의 직접적인 비교 시에는 주의가 필요할 것으로 판단된다.
요 약
배경: 종양표지자(tumor marker)는 각종 암의 진단과 치료효과 판 정에 널리 이용된다. 최근 Lumipulse G1200 (Fujirebio, Japan) 면역 장비가 국내에 도입되어 종양표지자 측정에 있어 임상검사실에서 의 유용성을 평가하고자 하였다.
방법: CLSI 지침에 따라, 9가지 항목의 종양표지자(CEA, AFP, CA 125, CA 15-3, CA 19-9, PSA, PIVKA-II, Pepsinogen I과 II)에 대해 정밀도, 직선성, 기존 장비와의 상관성을 평가하였다. 또한, 건강검 진 환자에서 수집한 20검체를 대상으로 참고 구간을 검증하였다.
기존 장비와의 비교 평가 시, Modular analytics E170 (Roche Diag- nostics, IN, USA)과는 AFP, CEA, CA 125, CA19-9, CA 15-3, PSA, Ar- chitect i2000 (Abbott Diagnostics, IL, USA)과는 AFP, CEA, CA125, Cobas 600 (Roche Diagnostics)과는 CA 19-9, EP-one (Sanko Jun- yaku Co., Japan)과는 PIVKA-II, TBA-200 FR Neo와는 Pepsinogen I과 II 항목을 비교하였다.
결과: 9가지 항목의 총 정밀도는 5% 이내였고, 검사내 정밀도는 3% 이내였다. CA15-3, Pepsinogen I과 II를 제외한 모든 항목의 총 정밀도는 2.4-3.7%였다. 모든 검사 항목은 분석 범위에서 직선성이 우수하였다. 기존 검사와의 상관성 평가에서 Pepsinogen I을 제외 한 모든 항목에서 상관성이 0.975 이상으로 밀접한 상관관계를 보 였다. 제조사에서 제시한 참고 구간은 CLSI 기준에 적합하였다.
결론: Lumipulse 2000은 종양표지자 측정에 있어 정밀도, 직선성 및 기존 장비와의 상관성이 우수하여 임상 검사실에서 유용하게 사용될 수 있을 것으로 판단된다.
참고문헌
1. Bates SE. Clinical applications of serum tumor markers. Ann Intern Med 1991;115:623-38.
2. Forest JC, Massé J, Lane A. Evaluation of the analytical performance of the Boehringer Mannheim Elecsys 2010 immunoanalyzer. Clin Bio- chem 1998;31:81-8.
3. Clinical and Laboratory Standards Institute. Evaluation of precision performance of quantitative measurement methods; approved guide-
line. 2nd ed. CLSI document EP5-A2. Wayne, PA: Clinical and Labora- tory Standards Institute, 2004.
4. Clinical and Laboratory Standards Institute. Evaluation of the Linearity of Quantitative Measurement Procedures: A Statistical Approach; Ap- proved Guideline. CLSI document EP6-A. Wayne, PA: Clinical and Laboratory Standards Institute, 2003.
5. Clinical and Laboratory Standards Institute. Method Comparison and Bias Estimation Using Patient Samples; Approved Guideline. 2nd ed.
CLSI document EP9-A2. Wayne, PA: Clinical and Laboratory Standards Institute, 2002.
6. Clinical and Laboratory Standards Institute. How to Define and Deter- mine Reference Intervals in the Clinical Laboratory; Approved Guide- line. 2nd ed. CLSI document C28-A2. Wayne, PA: Clinical and Labora- tory Standards Institute, 2000.
7. Fraser CG and Harris EK. Generation and application of data on bio- logical variation in clinical chemistry. Crit Rev Clin Lab Sci 1989;27:
409-37.
8. Ricós C, Alvarez V, Cava F, Carcía-Lario JV, Hernández A, Jiménez CV, et al. Current databases on biological variation: pros, cons and progress.
Scand J Clin Lab Invest 1999;59:491-500.
9. Cotlove E, Harris EK, Williams GZ. Biological and analytic compo- nents of variation in long-term studies of serum constituents in normal subjects. 3. Physiological and medical implications. Clin Chem 1970;16:
1028-32.
10. Harris EK. Statistical principles underlying analytic goal-setting in clin- ical chemistry. Am J Clin Pathol 1979;72(S2):S374-82.
11. Ricos C, Alvarez V, Cava F, Garcia-Lario JV, Hernandez A, Jimenez CV, et al. Desirable Specifications for Total Error, Imprecision, and Bias,
derived from intra- and inter-individual biologic variation. http://www.
westgard.com/biodatabase1.htm (Updated on Apr 2012)
12. Fraser CG and Petersen PH. Analytical performance characteristics should be judged against objective quality specifications. Clin Chem 1999;45:321-3.
13. Dolci A, Scapellato L, Mozzi R, Panteghini M. Imprecision of tumour biomarker measurements on Roche Modular E170 platform fulfills de- sirable goals derived from biological variation. Ann Clin Biochem 2010;
47:171-3.
14. Sturgeon CM, Hoffman BR, Chan DW, Ch’ng SL, Hammond E, Hayes DF, et al. National Academy of Clinical Biochemistry Laboratory Medi- cine Practice Guidelines for use of tumor markers in clinical practice:
quality requirements. Clin Chem 2008;54:e1-10.
15. van Gammeren AJ, van Gool N, de Groot MJ, Cobbaert CM. Analytical performance evaluation of the Cobas 6000 analyzer - special empha- sis on trueness verification. Clin Chem Lab Med 2008;46:863-71.
16. Hubl W, Zogbaum M, Boyd JC, Savory J, Schubert M, Meyer D, et al.
Evaluation of analytical methods and workflow performance of the Architect ci8200 integrated serum/plasma analyzer system. Clin Chim Acta 2005;357:43-54.
17. Stephan C, Köpke T, Semionow A, Lein M, Deger S, Schrader M, et al.
Discordant total and free prostate-specific antigen (PSA) assay: dose calibration with WHO reference materials diminish the problem? Clin Chem Lab Med 2009;47:1325-31.
18. Fraser CG, Hyltoft Petersen P, Libeer JC, Ricos C. Proposal for setting generally applicable quality goals solely based on biology. Ann Clin Biochem 1997;34:8-12.