서론
요화학검사는 소변 중으로 배출된 질병특이 대사산물의 검 출을 통하여 다양한 질환을 발견할 목적으로 이용한다[1]. 따 라서 요 검체 내에서 화학성분들을 신속, 정확하게 검사하여 질병의 진단 및 치료에 필요한 정보를 제공하는 것은 매우 중 요하다[2-4].
자동화학분석기를 이용한 요화학검사의 전반적인 분석능력 및 유용성에 대한 평가는 국내에 아직 보고된 바 없다. 일반적 으로 요화학검사는 자동화 전처리시스템에 연결되어있지 않
은 장비에 구축되기 때문에 검체 전처리과정이 수동으로 진행 되어 검사 소요시간이 지연되는 단점이 있다. 따라서 높은 인 적, 시간적 효율로 신속하고 정확한 결과를 임상에 보고할 수 있도록 자동화 전처리시스템에 연결된 자동화학분석기의 요 화학검사에 대한 성능 및 유용성을 Clinical and Laboratory Standards Institute (CLSI)에서 제시한 지침에 따라 평가 분 석해 보고자 하였다.
Performance Evaluation of Automated Chemistry Analyser for Urine Chemistry Test
Soo In Choi, Byung Ryul Jeon, Hee Bong Shin, You Kyoung Lee, and Yong-Wha Lee
Department of Laboratory Medicine and Genetics, Soonchunhyang University Bucheon Hospital,
Soonchunhyang University College of Medicine, Bucheon, Korea
Background: Prompt and accurate urine chemistry analysis is important to provide information for diagnosis and therapy. In this study, we evaluated the overall performance and utility of an automated chemistry analyser for urine chemistry testing in accordance with Clinical and Laboratory Standards Institute guidelines.
Methods: From January 2015 to March 2015, we evaluated the precision, linearity, limits of detection, carryover, and turnaround times after automation of nine items: total protein, albumin, glucose, blood urea nitrogen, total calcium, magnesium, inorganic phosphate, creatinine, and uric acid. A Hitachi 7600-110 instrument (Hitachi Ltd., Japan) and Hitachi ID Privileged Access Manager (Hitachi Ltd.) were used for automated chemistry analysis and sample preparation, respectively.
Results: Regarding precision, the coefficient of variation was 3.9% to 1.6% for high levels and 3.3% to 24.1% for low levels. The linearity and coefficients of determination of all the test items were acceptable. Performance comparison revealed that the two systems were comparable, as evidenced by correlation coefficients >0.975 for most items; moreover, carryover of all items was <1%. The mean turnaround time was 59 minutes.
Conclusions: Urine chemistry testing can be performed with acceptable precision, linearity, and performance by using the Hitachi 7600-110 automated chemistry analyser. The sample preparation system reduces turnaround time, which enhances the clinical utility of urine chemistry testing.
(J Lab Med Qual Assur 2016;38:87-94)
Key Words: Urine clinical chemistry test, Automation, Precision, Correlation, Turnaround time
Corresponding author:
Yong-Wha Lee
Department of Laboratory Medicine and Genetics, Soonchunhyang University Bucheon Hospital, Soonchunhyang University College of Medicine, 170 Jomaru- ro, Wonmi-gu, Bucheon 14584, Korea
Tel: +82-32-621-5943 Fax: +82-32-621-5944 E-mail: [email protected] pISSN: 2384-2458
eISSN: 2288-7261 Received January 26, 2016, Revision received March 10, 2016, Accepted March 29, 2016
재료 및 방법
1. 재료
1) 장비
자동화학분석기인 Hitachi 7600-110 (Hitachi Ltd., Tokyo, Japan)와 자동화 전처리 장비인 Hitachi ID Privileged Access Manager, PAM (Hitachi Ltd.)가 평가에 이용되었 다. 비교분석 장비로 Cobas Integra 800 (Roche diagnostics, Mannheim, Germany)가 사용되었다.
2) 시약
Total protein, albumin, glucose, blood urea nitrogen (BUN), total calcium 5종의 검사는 Wako Pure Chemical Industries (Osaka, Japan)의 시약을, magnesium, inorganic phosphate, creatinine, uric acid 4종의 검사는 Sekisui Chemical Co. (Tokyo, Japan)의 시약을 사용하였다.
제조사의 설명서에 따르면 total protein과 albumin 시약은 요 검체 전용이며, 그 외의 시약은 혈청, 체액 및 요 검체에 공통 으로 사용 가능하다.
3) 검체
평가용 검체로 진단검사의학과로 의뢰된 요 검체를 이용하 였다. 이는 요화학검사를 의뢰한 환자들의 요 검체로 기존에 요화학검사에 사용하던 Cobas Integra 800을 통하여 적절한 농도로 확인된 검체를 선별하여 사용하였다. 선별된 검체는 즉시 각각 분주하여 -70
oC로 냉동시킨 후 검사 시마다 해동하 여 사용하였다. 정도관리물질로는 Lyphochek Quantitative Urine Control (Bio-Rad Laboratories, Hercules, CA, USA)이, 영점 대조한계의 측정에서는 제조사의 지침에 따라 증류수가 영점대조 검체로 사용되었다.
2. 평가방법
1) 정밀도
CLSI EP05-A2 지침에 따라 적절한 농도의 검체를 분주하 여 표준물질을 제작하였다[5]. 각 검사 항목마다 두 가지 농도 물질에 대해 20일 동안 연속해서 하루 4회씩 측정하였다. 하루 4회 검사는 오전 2회, 오후 2회 실시했으며, 오전과 오후 사이 검사 간격은 2시간 이상으로 하였다. 결과 값에 대해서는 검 사 내 변이계수(within run CV), 검사 간 변이계수(between run CV), 검사일 간 변이계수(between day CV), 총 변이계 수(total CV) 등을 계산하였다. 총 변이계수의 CV (%)값은 Westgard QC에 제시된 바람직한 정밀도 수준과 비교하여 평
가하였고[6], Westgard QC에 바람직한 정밀도 수준이 제시 되지 않은 glucose 항목에 한하여 고농도 검체 5%, 저농도 검 체 10%로 임의로 설정하여 비교하였다.
2) 직선성
CLSI EP06-A에 준하여 평가하였다[7]. 고농도의 환자 검 체를 저농도의 환자 검체와 6:0, 5:1, 4:2, 3:3, 2:4, 1:5, 0:6 의 비율로 단계적으로 혼합하여 7가지 농도를 만든 후, 각각의 검체를 4회 반복 측정하여 구한 평균치로부터 회귀 직선식을 구하고, 직선이 가능한 구간을 구하였다. 측정값이 직선식보다 는 2차 혹은 3차 다항회귀곡선에 가장 합당한 경우에는 최적 의 다항회귀곡선을 구하였다.
3) 상관성
CLSI EP09-A2에 준하여 평가하였는데[8], 각 검사항목에 대하여 기존 장비로 측정한 결과를 기준으로 장비의 최대 유 효분석범위 내에 정상영역, 높은 값, 낮은 값을 갖는 농도가 모 두 포함되도록 고른 농도로 분포하는 40-50개의 환자 요 검 체를 대상으로 하였다. 각 장비 간 검사는 2시간 이내로 하여 Hitachi 7600-110로 각각의 검사항목들을 2회씩 측정하고 동 시에 비교장비인 Cobas Integra 800으로 측정하여 상관분석 을 시행하였다.
4) 영점대조 한계 및 검출 한계
CLSI EP17-A에 준하여 아래 공식에 따라 영점대조 한계 및 검출한계를 설정하였다[9].
Limit of blank=mean
blank+2SD
blankLimit of detection=mean
blank+2SD
blank+2SD
spike sample공백 검체로 증류수를 이용하여 항목당 20회 반복 측정하여 평균과 표준편차를 산출하였다. 환자 검체 중 낮은 농도의 검 체를 사용하여 25회 반복 측정한 값의 평균과 표준편차를 산 출하였다.
5) 교차오염률
검체 간 교차오염률(carryover) 평가를 위하여 기존에 측정 한 저농도(L1, L2, L3, L4)와 고농도(H1, H2, H3, H4) 검체 를 각각 4회 연속 검사한 후 교차오염률을 확인하였다. 검체 간 % carryover를 산출하는 데 사용된 공식은 다음과 같으며, 1.0%를 기준치로 삼았다[10].
%Carryover= L1-(L3+L4)/2
(H2+H3)/2-(L3+L4)/2 ×100
6) 검사소요시간
요화학검사를 자동화학분석기에 구축하고 3개월의 업무숙 련기간을 두고 2015년 3월의 1개월 동안 검사된 평균 검사소 요시간(turnaround time)을 평가하였다. Hitachi ID PAM을 이용한 검체 전처리과정은 기존 혈청검사에 있어 일반적인 경 우 180초, 긴급 검체의 경우 60초의 대기시간을 가지도록 설 정하였으나 본 연구에서 요화학검사의 대기시간은 긴급 검체 모드를 사용하지 않고 모두 180초로 설정하였다. 대기시간이 끝나면 1,500 g로 5분간 원심분리가 진행되며, 마개열기 및 분 주장치를 지나 자검체상태로 분석기로 이동되어 검사를 진행 하였다. 검사소요시간은 검체가 검사실에 접수된 시점부터 시 작하여 임상에 최종보고가 이루어진 시점까지로 계산하였다.
3. 통계
각각의 평가에 대한 통계는 Analyse-it (Analyse-it Software Ltd., Leeds, UK)와 Microsoft Office Excel 2007 (Microsoft Co., Redmond, WA, USA) 프로그램을 이용하여 산출하였다.
결과
1. 정밀도
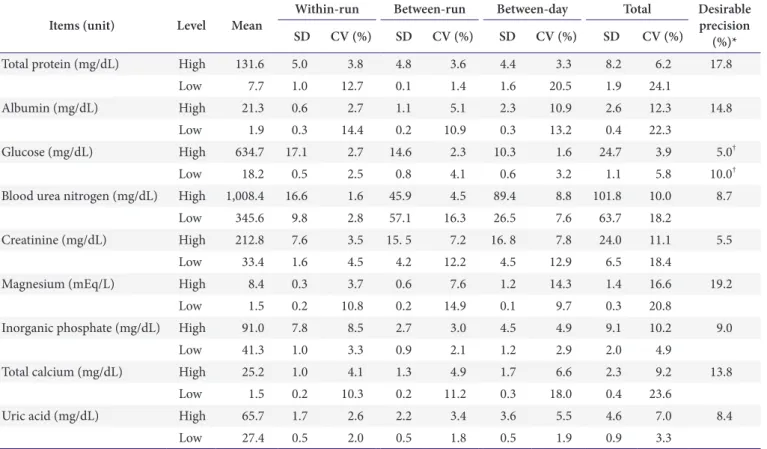
모든 검사항목에서 고농도물질의 검사 내 정밀도의 변이계 수는 2.3%-7.6%, 저농도물질은 1.4%-16.3%였으며, 검사일 간 정밀도의 전체 변이계수는 고농도물질이 1.6%-14.3%, 저 농도물질은 1.9%-20.5%였다. 총정밀도의 변이계수는 고농도 물질이 3.9%-16.6%, 저농도물질은 3.3%-24.1%로 9개 검사 항목의 정밀도는 Table 1에 기술하였다.
2. 직선성
전체 검사항목에 대한 직선성 평가에서 9가지 검사항목 모 두 결정계수가 0.997 이상이며, BUN과 total calcium에서 는 직선식보다는 각각 2차와 3차 다항회귀곡선이 가장 합당한 것으로 나타났다. 각각의 항목에 대한 직선이 가능한 구간은 Table 2에 기술하였다.
3. 상관성
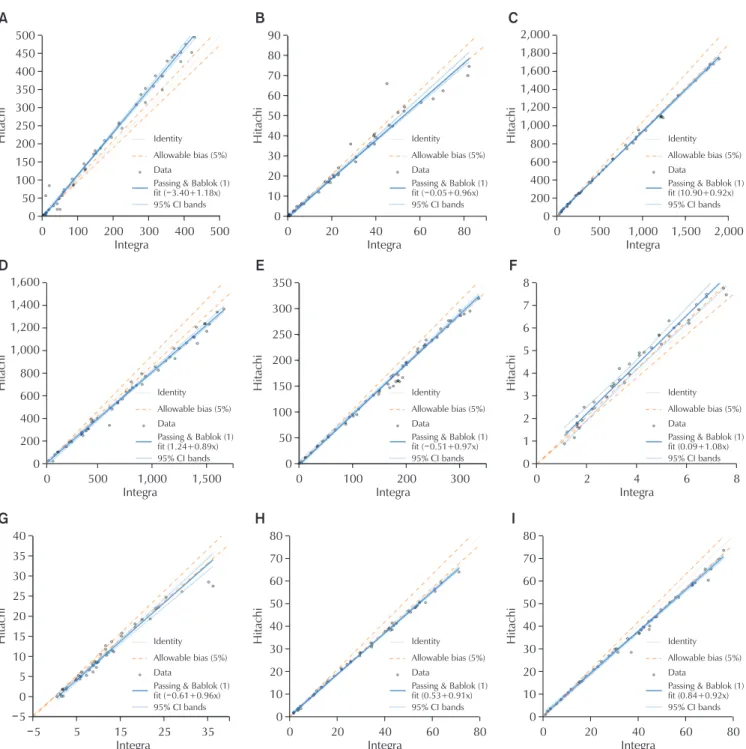
Albumin과 total calcium의 상관계수는 각각 0.966과 0.972
Table 1. Precision of Hitachi 7600-110 as determined by using pooled urine samples
Items (unit) Level Mean Within-run Between-run Between-day Total Desirable
precision SD CV (%) SD CV (%) SD CV (%) SD CV (%) (%)*
Total protein (mg/dL) High 131.6 5.0 3.8 4.8 3.6 4.4 3.3 8.2 6.2 17.8
Low 7.7 1.0 12.7 0.1 1.4 1.6 20.5 1.9 24.1
Albumin (mg/dL) High 21.3 0.6 2.7 1.1 5.1 2.3 10.9 2.6 12.3 14.8
Low 1.9 0.3 14.4 0.2 10.9 0.3 13.2 0.4 22.3
Glucose (mg/dL) High 634.7 17.1 2.7 14.6 2.3 10.3 1.6 24.7 3.9 5.0
†Low 18.2 0.5 2.5 0.8 4.1 0.6 3.2 1.1 5.8 10.0
†Blood urea nitrogen (mg/dL) High 1,008.4 16.6 1.6 45.9 4.5 89.4 8.8 101.8 10.0 8.7
Low 345.6 9.8 2.8 57.1 16.3 26.5 7.6 63.7 18.2
Creatinine (mg/dL) High 212.8 7.6 3.5 15. 5 7.2 16. 8 7.8 24.0 11.1 5.5
Low 33.4 1.6 4.5 4.2 12.2 4.5 12.9 6.5 18.4
Magnesium (mEq/L) High 8.4 0.3 3.7 0.6 7.6 1.2 14.3 1.4 16.6 19.2
Low 1.5 0.2 10.8 0.2 14.9 0.1 9.7 0.3 20.8
Inorganic phosphate (mg/dL) High 91.0 7.8 8.5 2.7 3.0 4.5 4.9 9.1 10.2 9.0
Low 41.3 1.0 3.3 0.9 2.1 1.2 2.9 2.0 4.9
Total calcium (mg/dL) High 25.2 1.0 4.1 1.3 4.9 1.7 6.6 2.3 9.2 13.8
Low 1.5 0.2 10.3 0.2 11.2 0.3 18.0 0.4 23.6
Uric acid (mg/dL) High 65.7 1.7 2.6 2.2 3.4 3.6 5.5 4.6 7.0 8.4
Low 27.4 0.5 2.0 0.5 1.8 0.5 1.9 0.9 3.3
*Based on the Westgard QC, http://www.westgard.com/biodatabase1.htm [6].
†Desirable precision of glucose was empirically selected.
였고 나머지 항목은 모두 CLSI 권고치인 0.975 이상으로 나타 났다(Figs. 1, 2).
4. 영점대조 한계 및 검출 한계
영점대조 한계는 magnesium이 0.16 mEq/L, 나머지 8개 항목에서 각각 0.65-2.5151 mg/dL로 측정되었으며, 검출한계 는 magnesium이 1.65 mEq/L, 나머지 항목에서는 각각 0.65- 2.51 mg/dL로 측정되었다.
5. 교차오염률
9개의 검사항목에서 측정한 % carryover 값은 모두 기준인 1%보다 낮았다.
6. 검사소요시간
총 9항목에 대한 요화학검사의 1개월 동안의 평균 검사소요 시간은 59분으로 나타났다.
고찰
본 연구에서는 국내에서 최초로 요화학검사에 대한 자동화 학분석기의 성능을 평가하였다. 비록 6개 항목의 저농도 검체 의 정밀도 평가에서는 바람직한 정밀도보다 큰 CV값을 나타 내었으나, 그 외 정밀도, 직선성, 상관성, 영점대조 한계, 검출 한계 및 교차오염도에서 만족할 만한 결과를 얻었을 뿐만 아니 라 자동화 전처리시스템 연계를 통해 우수한 검사소요시간을 보였다. 검사실에서 사용되는 분석 장비는 최대한 사용자의 업 무를 자동화, 효율화하여 검사시간 단축과 정확한 검사결과로 환자서비스에 집중할 수 있도록 도움이 되어야 하기에 지속적 인 검사를 통한 평가가 필요하다[1].
Hitachi 7600-110은 대용량, 다항목의 선택적 자동화학분 석기로 1999년 국내에 출시되었다. 이 기기는 다량의 검사항 목에 있어서는 관분배 형태(D-module)로, 소량의 검사항목에 서는 피펫분배 형태(P-module)로 선택할 수 있도록 고안되어 있다. 또한 개방형 장비로서 검사단가를 감소시킬 수 있는 장 점이 있으며, 본원의 경우 자동화 전처리시스템에 연결되어 있 기에 효율적 기기 운용을 가능하게 할 것으로 생각되었다[11- 15].
정밀도 평가는 CLSI EP05-A2 지침에 따라 두 가지 수준의 농도를 가지는 검체와 상용화된 정도관리물질인 Lyphochek Quantitative Urine Control을 매 수행마다 분석하였으나, 6 개 항목의 저농도물질은 바람직한 정밀도 수준보다 큰 CV값 을 나타내었다. 요검사는 정확한 결과를 위해 채취한 지 2시간 이내 혹은 마개를 막고 냉장고에 보관된 지 수시간 이내의 요 검체를 이용하여 검사를 시행하도록 되어있는데, 시약 제조사 의 지침에 따르면 즉시 분석이 불가능한 경우 검체는 -20
oC에 서 최대 3개월간 냉동 보관할 수 있으나 미생물 오염으로 인해 검체가 변질될 수 있음을 명시하고 있다. 본 연구에서는 환자 의 결과에 가장 근접한 결과를 얻기 위하여 적절한 농도의 검 체를 지침에 따라 분주 즉시 -20
oC로 냉동하여 보관하고 3개 월 이내에 실험을 완료하였으나, 긴 평가기간 발생한 검체의 미세한 변질이 저농도 검체의 결과에 영향을 미친 것으로 판단 되었다. 또한 BUN과 creatinine 항목의 경우 장비 내에서 10 배 희석되어 측정되는 과정에서 정밀도에 영향을 받아 고농도 및 저농도 검체 모두에서 큰 CV값을 보인 것으로 생각되었다.
직선성 평가에서는 전체 항목 모두에서 모두 결정계수가 0.997 이상이며 기울기 0.991-1.023로 우수한 직선성을 보여 주었다. BUN과 total calcium 항목은 직선식보다는 각각 2 차와 3차 다항회귀곡선이 가장 적합한 것으로 계산되었다. 하
Table 2. Linearity of Hitachi 7600-110 as determined by using seven levels of pooled urine samples
Items (unit) Linearity range R
2Best fit
Total protein (mg/dL) 3.63–416.50 0.9989 Linear fit
Albumin (mg/dL) 0.13–446.13 0.9960 Linear fit
Glucose (mg/dL) 0.95–1040.98 0.9971 Linear fit
Blood urea nitrogen (mg/dL) 19.43–205.60 0.9979 2nd order polynomial
Creatinine (mg/dL) 2.70–58.75 0.9988 Linear fit
Magnesium (mEq/L) 0.35–8.44 0.9972 Linear fit
Inorganic phosphate (mg/dL) 0.58–41.25 0.9986 Linear fit
Total calcium (mg/dL) 0.63–21.23 0.9985 3rd order polynomial
Uric acid (mg/dL) 1.53–75.00 0.9987 Linear fit
R
2indicates coefficient of determinations.
지만 BUN의 경우 분석장비 내에서 10배 희석하여 측정되며 calcium의 경우 바람직한 정밀도가 13.8%로 제시되어 있다는 점을 고려하면, 해당 항목의 비직선성 %는 최저농도 검체에서
각각 -10.8%, -11.1%로 나타났으나 그 외 모든 농도에서는 비직선성 기준으로 설정한 10% 미만이었기에 직선식을 적용 할 수 있을 것으로 생각되었다.
0
0 100 200 300 400 500
A
Integra 500
450
350
250
150
Hitachi
400
300
200
100 50
0
0 20 40 60 80
B
Integra 90
80
60
40
20
Hitachi
70
50
30
10
0
0 500 1,000 1,500 2,000
C
Integra 2,000
1,800
1,400
1, 00 0
600
Hitachi
1,600
1,200
800
400 200
0
0 500 1,000 1,500
D
Integra 1,600
1,400
1, 00 0
Hitachi 600
1,200
800
400 200
0
0 100 200 300
E
Integra 350
250
Hitachi 150
300
200
100 50
0
0 2 4 6 8
F
Integra 8
6
4
2
Hitachi
7
5
3
1
0
5 5 15 25 35
G
Integra 40
35 30 25 20 15 10 5
Hitachi
0
0 20 40 60 80
H
Integra 80
70 60 50 40 30 20 10
Hitachi
0
0 20 40 60 80
I
Integra 80
70 60 50 40 30 20 10
Hitachi
Identity Allowable bias (5%) Data
Passing & Bablok (1) fit ( 3.40+1.18x) 95% CI bands
Identity Allowable bias (5%) Data
Passing & Bablok (1) fit ( 0.05+0.96x) 95% I bandsC
Identity Allowable bias (5%) Data
Passing & Bablok (1) fit (10.90+0.92x) 95% I bandsC
Identity Allowable bias (5%) Data
Passing & Bablok (1) fit (1.24+0.89x) 95% I bandsC
Identity Allowable bias (5%) Data
Passing & Bablok (1) fit ( 0.51+0.97x) 95% I bandsC
Identity Allowable bias (5%) Data
Passing & Bablok (1) fit (0.09+1.08x) 95% I bandsC
Identity Allowable bias (5%) Data
Passing & Bablok (1) fit ( 0.61+0.96x) 95% I bandsC
Identity Allowable bias (5%) Data
Passing & Bablok (1) fit (0.53+0.91x) 95% I bandsC
Identity Allowable bias (5%) Data
Passing & Bablok (1) fit (0.84+0.92x) 95% I bandsC
5
Fig. 1. Correlation between the Hitachi 7600-110 and Cobas Integra 800 instrument. Scatter plot with Passing and Bablok plot.
The linear regression line is shown in blue, and the grey line depicts a theoretical line with a slope of 1.0 and a y-intercept of 0.0. (A) Total protein (mg/dL). (B) Albumin (mg/dL). (C) Glucose (mg/dL). (D) Blood urea nitrogen (mg/dL). (E) Creatinine (mg/dL).
(F) Magnesium (mEq/L). (G) Calcium (mg/dL). (H) Phosphate (mg/dL). (I) Uric acid (mg/dL). Abbreviation: CI, confidence
interval.
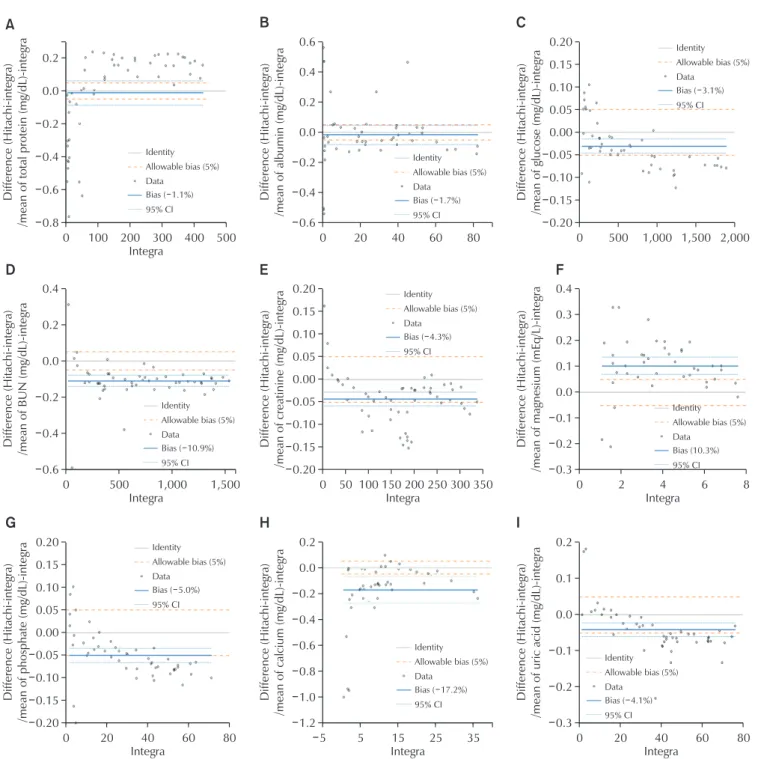
상관성 평가에서 Hitachi 7600-110은 Cobas Integra 800과 비교하여 total protein, albumin, creatinine, total calcium 항목에서는 낮은 결과치가, glucose, BUN, magnesium, phosphorus, uric acid 항목에서는 높은 결과치를 나타내는
경향을 보였다. 하지만 대부분의 항목에서 CLSI 권고 기준 인 0.975 이상의 상관계수를 만족하여 임상적으로 의의가 있 는 농도범위에서 높은 상관성을 보이는 것으로 평가되었다.
Total calcium은 r=0.972로 0.975와 근소한 차이를 보였고,
0.8
0 100 200 300 400 500
A
Integra 0.0
0.4
Difference (Hitachi-integra) /mean of total protein (mg/dL)-integra 0.2
0.6
0.20
0 500 1,000 1,500 2,000 0.20
0.15 0.10
0.00
Difference (Hitachi-integra) /mean of glucose (mg/dL)-integra 0.05 0.05 0.10 0.15
0.6
0 500 1,000 1,500
Integra 0.4
0.2
0.2
Difference (Hitachi-integra) /mean of BUN (mg/dL)-integra 0.0
0.4
0.6
0 20 40 60 80
0.6 0.4
0.0
Difference (Hitachi-integra) /mean of albumin (mg/dL)-integra 0.2
0.2 0.4
0.20
0 50 100 150 200 250 300 350 0.20
0.15 0.10
0.00
Difference (Hitachi-integra) /mean of creatinine (mg/dL)-integra 0.05 0.05 0.10 0.15
0.3
0 2 4 6 8
0.4 0.3
0.1 Difference (Hitachi-integra) /mean of magnesium ( )-integra mEq/L
0.2
0.2 0.1 0.0
0.20
0 20 40 60 80
0.20 0.15 0.10
0.00
Difference (Hitachi-integra) /mean of phosphate (mg/dL)-integra 0.05 0.05 0.10 0.15
1.2
5 5 15 25 35
0.2 0.0
0.8 Difference (Hitachi-integra) /mean of calcium (mg/dL)-integra
0.2
1.0 0.4 0.6
Integra Integra
Integra Integra
0.3
0 20 40 60 80
0.2
0.1
Difference (Hitachi-integra) /mean of uric acid (mg/dL)-integra 0.0 0.1
0.2
Integra
B C
D E F
G H I
Identity Allowable bias (5%) Data
Bias ( 1.1%) 95% CI
0.2
Identity Allowable bias (5%) Data
Bias ( 1.7%) 95% CI
Identity Allowable bias (5%) Data
Bias ( 3.1%) 95% CI
Identity Allowable bias (5%) Data
Bias ( 10.9%) 95% CI
Identity Allowable bias (5%) Data
Bias ( 4.3%) 95% CI
Identity Allowable bias (5%) Data
Bias (10.3%) 95% CI
Identity Allowable bias (5%) Data
Bias ( 5.0%) 95% CI
Identity Allowable bias (5%) Data
Bias ( 17.2%) 95% CI
Identity Allowable bias (5%) Data
Bias ( 4.1%) 95% CI
Fig. 2. Difference plot. The blue line represents the bias (average difference) and the grey line depicts a theoretical line with a bias between methods of zero. (A) Total protein (mg/dL). (B) Albumin (mg/dL). (C) Glucose (mg/dL). (D) Blood urea nitrogen (mg/
dL). (E) Creatinine (mg/dL). (F) Magnesium (mEq/L). (G) Phosphate (mg/dL). (H) Calcium (mg/dL). (I) Uric acid (mg/dL).
Abbreviation: CI, confidence interval.
albumin은 0.966로 상관성은 0.975보다 낮으나 일치도의 기 준으로 삼은 바이어스 5% 보다 낮은 1.7%의 음의 오차를 보 였으므로 참고방법과의 일치도는 수용 가능한 수준인 것으로 판단되었다.
Hitachi 7600-110에서는 일회용 큐벳이나 일회용 피펫을 사용하지 않으므로 검체 사이에 교차오염의 가능성이 있다. 이 연구에서 교차오염률은 모든 항목에서 -0.9%에서 +0.5%의 수치를 보여 검체 간의 교차오염도는 매우 낮다고 판정할 수 있었다.
검사소요시간은 검체가 검사실에 접수된 시점부터 임상에 보고되는 시점까지로 하였다. 보편적인 검사소요시간 평가방 법에 따르면 Hitachi ID PAM과 Hitachi 7600-110에서 시행 한 경우와 검사실 직원이 원심분리기를 이용하여 검체 전처리 과정을 시행한 후 1시간당 검사 시행건수로 산출하여야 한다.
하지만 실제 적용될 상황과 동일한 조건에서 평가하고자 연구 용 검체를 따로 검사하지 않고 실제로 검사가 의뢰된 검체의 1 개월 평균 검사소요시간을 산출하였다. 모든 평가항목에 대한 평균적인 검사소요시간은 59분이었다.
결론적으로, 자동화학분석기 Hitachi 7600-110로 시행한 요 화학검사는 만족할 만한 성능을 보였으며 자동화 전처리시스 템과의 연결을 통하여 검사 효율성이 향상될 것으로 생각된다.
감사의 글
본 연구에 도움을 주신 제이더블유 중외메디칼에 감사를 표 한다.
REFERENCES
1. McPherson RA, Pincus MR. Henry’s clinical diagnosis and management by laboratory methods. 22nd ed.
Philadelphia (PA): Elsevier Health Sciences, 2011.
2. Hemmelgarn BR, Manns BJ, Lloyd A, James MT, Kla- renbach S, Quinn RR, et al. Relation between kidney function, proteinuria, and adverse outcomes. JAMA 2010;
303:423-9.
3. Lamb EJ, MacKenzie F, Stevens PE. How should pro- teinuria be detected and measured? Ann Clin Biochem 2009;46(Pt 3):205-17.
4. Perkovic V, Verdon C, Ninomiya T, Barzi F, Cass A, Patel A, et al. The relationship between proteinuria and co-
ronary risk: a systematic review and meta-analysis. PLoS Med 2008;5:e207.
5. Tholen DW, Kallner A, Kennedy JW, Krouwer JS, Meier K. Evaluation of precision performance of quantitative measurement methods: approved guideline. 2nd ed.
Wayne (PA): National Committee for Clinical Laboratory Standards, 2004.
6. James WF. Westgard QC. http://www.westgard.com/
biodatabase1.htm (Accessed March 16, 2015).
7. Tholen DW, Kroll M, Astles JR, Caffo AL, Happe T, Krouwer J, et al. Evaluation of the linearity of quantitative measurement procedures: a statistical approach: approved Guideline. Wayne (PA): Clinical and Laboratory Stan- dards Institute, 2003.
8. Krouwer JS, Tholen D, Garber C, Goldschmidt H, Kroll M, Linnet K, et al. Method comparison and bias estimation using patient samples: approved guidelines.
Wayne (PA): Clinical and Laboratory Standards Institute, 2002.
9. Tholen DW, Linnet K, Kondratovich M, Armbruster DA, Garrett PE, Jones RL, et al. Protocols for determination of limits of detection and limits of quantitation: approved guidelines. Wayne (PA): Clinical and Laboratory Standards Institute, 2004.
10. Broughton PM. Carry-over in automatic analysers. J Au- tomat Chem 1984;6:94-5.
11. Kim YS, Lee HK, Kim SY, Seo EJ, Min KO, Kwon HJ.
Evaluation of BD lab reagents for chemistry analyzers. J Lab Med Qual Assur 2007;29:239-45.
12. Lee DH, Yoon KJ. Evaluation of the dimension Vista 1500 chemical autoanalyzer. J Lab Med Qual Assur 2012;34:77- 86.
13. Woo HY, Kim YJ, Park HS. Evaluation of HiSense Reagents for chemistry autoanalyzer. J Lab Med Qual Assur 2006;28:189-98.
14. Yoon KJ, Kim JK, Jang JY. Evaluation of VITROS 5,1 FS automated chemistry analyzer. J Lab Med Qual Assur 2005;27:211-8.
15. Hong KS, Cho SE, Nam JW. Performance evaluation of
the Hitachi 7600-110 chemistry autoanalyzer. Korean J
Clin Pathol 2001:331-7.
자동화학분석기를 이용한 요화학검사의 성능 평가