449
서 론
유방암의 여러 가지 위험인자에 대한 역학적 연구는 다 양하게 시행되었는데, 이 중 비만은 각종 성인병의 중대한
체질량지수와 유방암의 위험도 및 예후와의 상관성
연세대학교 의과대학 1외과학교실, 2Brain Korea 21 Project, 3한림대학교 의과대학 외과학교실, 4포천중문 의과대학 외과학교실
고승상1․김승기1․김승일3․박병우1,2․이경식4
Body Mass Index as a Risk and Prognostic Factor of Breast Cancer
Seung Sang Ko, M.D1., Seung Ki Kim, M.D.1, Seung Il Kim, M.D.3, Byeong Woo Park, M.D.1,2 and Kyong Sik Lee, M.D.4
Purpose: In order to study the effect of body mass index (BMI) on the risk and the prognosis of breast cancers, we analyzed the BMI and clinico-pathological data of the breast cancer patients. We compared the BMIs of breast cancer patients to those of normal women and investigated the association of the BMI with the clinico-pathological data.
Then the overall and disease-free survial probabilities were analyzed according to the BMI groups.
Methods: 1,201 breast cancer patients were available for the analysis of BMI and the BMI of the normal control women was adopted from the report of the National Health, Nutrition Survey of 1998. We classified the BMI groups by he World Health Organization classification as follows; BMI under 18.5 as under-weight group, 18.5∼24.9 as the normal weight group, 25∼30 as the overweight group, and over 30 as the obesity group. BMI was compared between the patient group and the control group by age, while the correlation between BMI and the clinico-pathological characteristics and the recurrence and survival rates for each BMI group were comparatively analyzed. The statistical analysis were per- formed using x2 test, one-way ANOVA, independent T-test, and one sample T test, and the survival probabilities were generated by Kaplan-Meier methods.
Results: The means of BMI increased by aging in both the patients and the control group. The means of BMI of the
책임저자:박병우, 서울시 서대문구 신촌동 134번지 ꂕ 120-752, 연세대학교 의과대학 외과학교실 Tel: 02-361-5564, Fax: 02-313-8289
E-mail: [email protected]
접수일:2002년 10월 29일, 게재승인일:2002년 11월 20일 본 논문의 요지는 2002년 추계외과학회에서 발표하였음.
This work was supported by the BK21 Project for Medical Science, Yonsei University, and in part by a grant-in-aid from Dong-A Pharmaceutical Co., Ltd., Bristol-Myers Squibb Co., Ltd, Korea
30s and 50s were significantly lower in breast cancer patients than those of normal women (P=0.001, 0.002).
However, those of 60s and 70s were higher in breast cancer patients with marginal significance (P=0.159). In the pre- menopausal patient group, BMI was associated with the tumor size (P=0.012) and the tumor stage (P=0.018). In the post-menopausal patients, on the other hand, BMI had pos- itive relationship with well-differentiation of the tumor (P=0.025), and also showed a marginal association with estrogen receptor positivity (P=0.074). BMI did not influence on the outcome of premenopausal breast cancer patients but lower BMI (underweight group) showed poorer outcome in postmenopausal patients in terms of overall survival (P=
0.278), locoregional relapse-free survival (P=0.581), and distant relapse-free survival (P=0.040).
Conclusions: As a breast cancer risk factor, BMI seems to have a different association by the age. Higher BMI for the 60s and 70s but lower BMI for the younger age group seems to be a risk factor for the breast cancer development. In terms of the relationship with the clinico-pathological char- acteristics, BMI has different association by the menopausal status. BMI did not influence on the outcome of premen- opausal breast cancer patients but lower BMI (underweight group) showed significantly poorer outcome in postmeno- pausal patients. (J Korean Surg Soc 2002;63:449-457) Key Words: Body mass index (BMI), Risk factor, Prognostic
factor, Breast cancer
중심 단어: 체질량지수, 위험인자, 예후인자, 유방암 ꠏꠏꠏꠏꠏꠏꠏꠏꠏꠏꠏꠏꠏꠏꠏꠏꠏꠏꠏꠏꠏꠏꠏꠏꠏꠏꠏꠏꠏꠏꠏꠏꠏꠏꠏꠏꠏꠏꠏꠏꠏꠏꠏꠏꠏꠏꠏꠏꠏꠏ
1Department of Surgery, 2Brain Korea 21 Project, Yonsei University College of Medicine, Seoul, 3Department of Surgery, College of Medicine, Hallym University, Pyungchon,
4Department of Surgery, College of Medicine, Pochon Cha University, Pochon, Korea
ꠏꠏꠏꠏꠏꠏꠏꠏꠏꠏꠏꠏꠏꠏꠏꠏꠏꠏꠏꠏꠏꠏꠏꠏꠏꠏꠏꠏꠏꠏꠏꠏꠏꠏꠏꠏꠏꠏꠏꠏꠏꠏꠏꠏꠏꠏꠏꠏꠏꠏꠏꠏꠏꠏꠏꠏꠏꠏꠏꠏꠏꠏꠏꠏꠏꠏꠏꠏꠏꠏꠏꠏꠏꠏꠏꠏꠏꠏꠏꠏꠏꠏꠏꠏꠏꠏꠏꠏꠏꠏꠏꠏꠏꠏꠏꠏꠏꠏꠏꠏꠏꠏꠏꠏꠏꠏꠏꠏꠏꠏꠏꠏꠏꠏꠏ 요인일 뿐 아니라 수명을 단축시키는 중대한 건강문제로
유전적, 환경적 요인들과도 관련되어 있다.(1) 비만과 유방 암과의 관련성에 대한 연구 보고들을 보면 일반적으로 체 격이 크거나 과체중, 그리고 비만한 여성에서 유방암 발생 률이 더 높으며,(2,3) 폐경여부에 따라 이러한 연관성이 다 르게 나타난다고 보고되고 있다.(4-6) 비만을 포함하는 과 체중은 심혈관질환과 암 그리고 기타 다른 질병들을 포함 하는 거의 모든 사망원인에 의한 사망률을 증가시킬 뿐 아 니라(7) 유방암의 예후에도 좋지 않은 영향을 주는 것으로 알려져 있는데,(8,9) 젊은 여성에서 비만한 유방암 환자의 경우 마른 유방암 환자보다 사망률이 높다고 보고되고 있 으며,(10) 이밖에도 비만한 유방암 환자가 여러 원인으로 인하여 예후가 좋지 않다고 보고되고 있다.(11-13) 우리나 라의 한 연구에서도 폐경 전 여성과 폐경 후 여성 모두에서 체중과 비만도가 유방암 발생의 위험인자로 작용하고 있다 고 하였다.(14)
비만도의 측정에는 흔히 체질량지수(Body mass index, Quetelet's index, BMI)가 사용되는데,(15,16) 미국, 일본 등에 서도 비만을 정의하는 BMI의 기준치를 각각 자국의 실태에 맞게 설정하여 비만감소를 위한 노력을 기울이고 있다. 저 자들은 우리나라 유방암 환자들의 BMI의 분포를 조사하여 문헌상에 언급되어 있는 우리나라 정상 성인 여성의 BMI 분포와 비교함과 동시에 폐경여부에 따른 BMI와 유방암과 의 관계를 알아보고자 하였다. 특히 잘 알려진 다른 유방암 의 예후인자들과의 상관관계를 분석하여 BMI가 유방암의 예후에 미치는 영향을 분석하고자 하였다.
방 법
1) 대상
1980년 1월 1일부터 1997년 12월 31일까지 17년 동안 세 브란스병원에서 유방암으로 수술을 받은 2117명의 환자 중 관련정보가 비교적 정확하여 BMI를 구할 수 있었던 1,201 명을 대상으로 하였다. 대조군으로 파악한 정상 성인 여성 의 BMI분포는 1998년 보건복지부에서 조사하여 1999년 출 간한 국민건강․영양조사에 나타난 20세 이상의 정상 성인 여성의 연령대별 BMI를 근거로 하였다.(17) 정확한 비교를 위해서 대상기간 내에(1994년과 1995년) 조사된 국민영양 조사 결과보고서의 자료를 이용하고자 하였으나 BMI의 분 류방법이 달라서 이용하지 못하였다.
2) 방법
BMI는 수술을 위해 입원했을 당시의 체중과 신장으로 {체중(Kg)/신장(m)2} 산출하였으며, 계산된 BMI는 세계보 건기구(World Health Organization; WHO)와 보건복지부 국 민건강․영양조사(17)의 비만도 기준에 따라 4개의 군으로 나누었다. 즉 BMI 18.5 미만은 저체중(underweight)군, 18.5
에서 24.9까지는 정상체중(normal weight)군, 25부터 30까지 는 과체중(overweight)군, 그리고 30 이상은 비만(obesity)군 으로 나누었다. 그리고 연령별에 따른 BMI의 분포를 조사 하였으며, 환자의 폐경여부, 종양의 크기, 액와림프절 전이 여부, 원격전이 여부, 조직학적 등급, 에스트로젠 수용체와 프로제스테론 수용체 발현 여부 등의 임상병리학적 인자들 과 수술 후 화학요법, 호르몬 치료, 방사선 치료 등의 부가 적 치료 여부를 파악하였다. 종양의 크기, 액와림프절 전이 여부, 원격전이 여부는 2002년의 American Joint Committee on Cancer (AJCC) 제 6판의 결정 기준에 따라 분류하였으 나, 액와림프절 전이를 나타내는 N stage는 음성과 양성 두 군으로만 분류하였다. 조직학적 분화도는 해부병리 조직검 사 결과 보고에 따라 G1 (well-differentiated, 고분화)과 G2/
G3 (moderately differentiated, 중등도 분화/poorly differenti- ated, 저분화)의 2군으로 분류하였다. 호르몬 수용체는 면역 조직화학염색법 측정 결과가 10% 이상일 경우 양성으로 분 류하였고 화학요법, 방사선 치료, 호르몬 치료는 시행 여부 만으로 두 그룹으로 분류하였다. 재발여부는 국소재발과 전신전이의 여부로 파악하였으며, 국소재발과 전신전이가 둘 다 있었던 경우는 분석 시 양쪽에 모두 포함시켰다. 위의 자료에 기초하여 폐경여부에 따른 BMI와 유방암의 임상병 리학적 인자의 상관관계를 분석하였다. 이외에도 BMI와 폐 경여부에 따라 재발률, 수술과 수술 후 보조요법의 실패율, 전체생존율, 무병생존율을 분석하였다. 무병기간과 추적관 찰기간은 수술날짜를 기준으로 하여 마지막으로 재발 또는 생사여부가 파악되었던 날짜로 계산하였으며, 평균 추적관 찰 기간은 111개월(중간값 104개월, 최소 1개월, 최고 256개 월)이었다. 전체생존율과 무병생존율은 Loco-regional re- lapse free survival (LRRFS)과 Distant relapse free survival (DRFS)로 나누어 각각 분석하였다. 또한 BMI가 유방암의 예후에 미치는 영향을 검증하기 위해, 잘 알려진 다른 유방 암의 예후인자인 종괴의 크기, 액와림프절 전이 여부 등의 병리학적 예후인자들과 다변량분석을 시행하였다.
3) 통계
통계처리는 SPSS for windows 10.07 k를 사용하였다. 본 연구의 대상인 유방암 환자군과 정상 성인 여성의 BMI 평 균값 비교는 일표본 T 검정(One sample T test)를 사용하였 고, 임상병리학적 인자들 각 그룹 간의 BMI 평균값 비교는 독립표본 T 검정(independent T test)과 일원배치분산분석 (One-way ANOVA)을 사용하였다. BMI와 폐경여부의 상관 관계 분석, BMI와 종양의 임상병리학적 특성인자들과의 상 관성 비교는 교차분석(Cross tabulation, χ2 test)를 이용하였 고, 생존율분석에는 Kaplan-Meier 생존분석을 이용하였다.
위험도 분석은 다변량 분석으로 Cox 회귀모형(regression model)을 사용하였다. 유의성 검증은 95% 유의수준으로 P 값이 0.05 미만인 경우를 유의한 것으로 하였다.
ꠏꠏꠏꠏꠏꠏꠏꠏꠏꠏꠏꠏꠏꠏꠏꠏꠏꠏꠏꠏꠏꠏꠏꠏꠏꠏꠏꠏꠏꠏꠏꠏꠏꠏꠏꠏꠏꠏꠏꠏꠏꠏꠏꠏꠏꠏꠏꠏꠏꠏꠏꠏꠏꠏꠏꠏꠏꠏꠏꠏꠏꠏꠏꠏꠏꠏꠏꠏꠏꠏꠏꠏꠏꠏꠏꠏꠏꠏꠏꠏꠏꠏꠏꠏꠏꠏꠏꠏꠏꠏꠏꠏꠏꠏꠏꠏꠏꠏꠏꠏꠏꠏꠏꠏꠏꠏꠏꠏꠏꠏꠏꠏꠏꠏꠏ
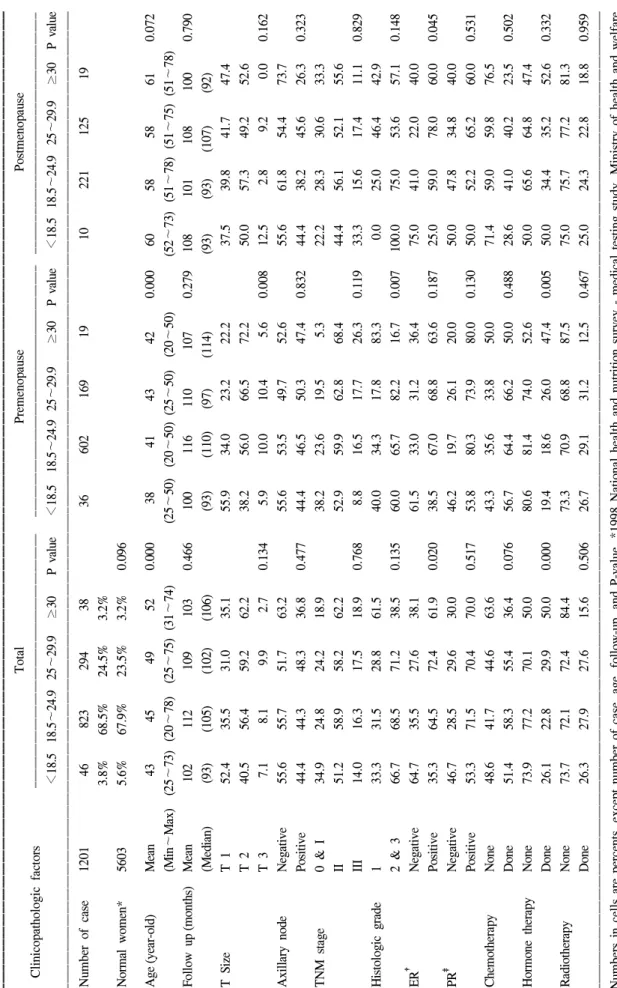
Table 1. General characteristics of patients according to BMI group ꠚꠚꠚꠚꠚꠚꠚꠚꠚꠚꠚꠚꠚꠚꠚꠚꠚꠚꠚꠚꠚꠚꠚꠚꠚꠚꠚꠚꠚꠚꠚꠚꠚꠚꠚꠚꠚꠚꠚꠚꠚꠚꠚꠚꠚꠚꠚꠚꠚꠚꠚꠚꠚꠚꠚꠚꠚꠚꠚꠚꠚꠚꠚꠚꠚꠚꠚꠚꠚꠚꠚꠚꠚꠚꠚꠚꠚꠚꠚꠚꠚꠚꠚꠚꠚꠚꠚꠚꠚꠚꠚꠚꠚꠚꠚꠚꠚꠚꠚꠚꠚꠚꠚꠚꠚꠚꠚꠚꠚꠚꠚꠚꠚꠚꠚꠚꠚꠚꠚꠚꠚꠚꠚꠚꠚꠚꠚꠚꠚꠚꠚꠚꠚꠚꠚꠚꠚꠚꠚꠚꠚꠚꠚꠚꠚꠚꠚꠚꠚꠚꠚꠚꠚꠚ TotalPremenopausePostmenopause Clinicopathologic factorsꠏꠏꠏꠏꠏꠏꠏꠏꠏꠏꠏꠏꠏꠏꠏꠏꠏꠏꠏꠏꠏꠏꠏꠏꠏꠏꠏꠏꠏꠏꠏꠏꠏꠏꠏꠏꠏꠏꠏꠏꠏꠏꠏꠏꠏꠏꠏꠏꠏꠏꠏꠏꠏꠏꠏꠏꠏꠏꠏꠏꠏꠏꠏꠏꠏꠏꠏꠏꠏꠏꠏꠏꠏꠏꠏꠏꠏꠏꠏꠏꠏꠏꠏꠏꠏꠏꠏꠏꠏꠏꠏꠏꠏꠏꠏꠏꠏꠏꠏꠏꠏꠏꠏꠏꠏꠏꠏꠏꠏꠏꠏꠏꠏꠏꠏꠏꠏ <18.518.5∼24.925∼29.9≥30P value<18.518.5∼24.925∼29.9≥30P value<18.518.5∼24.925∼29.9≥30P value ꠏꠏꠏꠏꠏꠏꠏꠏꠏꠏꠏꠏꠏꠏꠏꠏꠏꠏꠏꠏꠏꠏꠏꠏꠏꠏꠏꠏꠏꠏꠏꠏꠏꠏꠏꠏꠏꠏꠏꠏꠏꠏꠏꠏꠏꠏꠏꠏꠏꠏꠏꠏꠏꠏꠏꠏꠏꠏꠏꠏꠏꠏꠏꠏꠏꠏꠏꠏꠏꠏꠏꠏꠏꠏꠏꠏꠏꠏꠏꠏꠏꠏꠏꠏꠏꠏꠏꠏꠏꠏꠏꠏꠏꠏꠏꠏꠏꠏꠏꠏꠏꠏꠏꠏꠏꠏꠏꠏꠏꠏꠏꠏꠏꠏꠏꠏꠏꠏꠏꠏꠏꠏꠏꠏꠏꠏꠏꠏꠏꠏꠏꠏꠏꠏꠏꠏꠏꠏꠏꠏꠏꠏꠏꠏꠏꠏꠏꠏꠏꠏꠏꠏꠏꠏ Number of case1201 46823294 3836602169191022112519 3.8%68.5%24.5%3.2% Normal women*56035.6%67.9%23.5%3.2%0.096 Age(year-old)Mean 43 45 49 520.000 38 4143420.00060 58 58 610.072 (Min∼Max)(25∼73)(20∼78)(25∼75)(31∼74)(25∼50)(20∼50)(25∼50)(20∼50)(52∼73)(51∼78)(51∼75)(51∼78) Follow up(months)Mean1021121091030.4661001161101070.2791081011081000.790 (Median)(93)(105)(102)(106)(93)(110)(97)(114)(93)(93)(107)(92) T SizeT 152.435.531.035.155.934.023.222.237.539.841.747.4 T 240.556.459.262.238.256.066.572.250.057.349.252.6 T 3 7.1 8.1 9.9 2.70.134 5.910.010.4 5.60.00812.5 2.8 9.2 0.00.162 Axillary nodeNegative55.655.751.763.255.653.549.752.655.661.854.473.7 Positive44.444.348.336.80.47744.446.550.347.40.83244.438.245.626.30.323 TNM stage0 & I34.924.824.218.938.223.619.5 5.322.228.330.633.3 II51.258.958.262.252.959.962.868.444.456.152.155.6 III14.016.317.518.90.768 8.816.517.726.30.11933.315.617.411.10.829 Histologic grade133.331.528.861.540.034.317.883.3 0.025.046.442.9 2 & 366.768.571.238.50.13560.065.782.216.70.007100.075.053.657.10.148 ER† Negative64.735.527.638.161.533.031.236.475.041.022.040.0 Positive35.364.572.461.90.02038.567.068.863.60.18725.059.078.060.00.045 PR‡ Negative46.728.529.630.046.219.726.120.050.047.834.840.0 Positive53.371.570.470.00.51753.880.373.980.00.13050.052.265.260.00.531 ChemotherapyNone48.641.744.663.643.335.633.850.071.459.059.876.5 Done51.458.355.436.40.07656.764.466.250.00.48828.641.040.223.50.502 Hormone therapyNone73.977.270.150.080.681.474.052.650.065.664.847.4 Done26.122.829.950.00.00019.418.626.047.40.00550.034.435.252.60.332 RadiotherapyNone73.772.172.484.473.370.968.887.575.075.777.281.3 Done26.327.927.615.60.50626.729.131.212.50.46725.024.322.818.80.959 ꠏꠏꠏꠏꠏꠏꠏꠏꠏꠏꠏꠏꠏꠏꠏꠏꠏꠏꠏꠏꠏꠏꠏꠏꠏꠏꠏꠏꠏꠏꠏꠏꠏꠏꠏꠏꠏꠏꠏꠏꠏꠏꠏꠏꠏꠏꠏꠏꠏꠏꠏꠏꠏꠏꠏꠏꠏꠏꠏꠏꠏꠏꠏꠏꠏꠏꠏꠏꠏꠏꠏꠏꠏꠏꠏꠏꠏꠏꠏꠏꠏꠏꠏꠏꠏꠏꠏꠏꠏꠏꠏꠏꠏꠏꠏꠏꠏꠏꠏꠏꠏꠏꠏꠏꠏꠏꠏꠏꠏꠏꠏꠏꠏꠏꠏꠏꠏꠏꠏꠏꠏꠏꠏꠏꠏꠏꠏꠏꠏꠏꠏꠏꠏꠏꠏꠏꠏꠏꠏꠏꠏꠏꠏꠏꠏꠏꠏꠏꠏꠏꠏꠏꠏꠏ Numbers in cells are percents, except number of case, age, follow-up, and P-value. *1998 National health and nutrition survey - medical testing study. Ministry of health and welfare, Korea; † ER = estrogen receptor; ‡ PR = progesterone receptor.
ꠏꠏꠏꠏꠏꠏꠏꠏꠏꠏꠏꠏꠏꠏꠏꠏꠏꠏꠏꠏꠏꠏꠏꠏꠏꠏꠏꠏꠏꠏꠏꠏꠏꠏꠏꠏꠏꠏꠏꠏꠏꠏꠏꠏꠏꠏꠏꠏꠏꠏꠏꠏꠏꠏꠏꠏꠏꠏꠏꠏꠏꠏꠏꠏꠏꠏꠏꠏꠏꠏꠏꠏꠏꠏꠏꠏꠏꠏꠏꠏꠏꠏꠏꠏꠏꠏꠏꠏꠏꠏꠏꠏꠏꠏꠏꠏꠏꠏꠏꠏꠏꠏꠏꠏꠏꠏꠏꠏꠏꠏꠏꠏꠏꠏꠏ
결 과
1) BMI에 따른 일반적 특성
전체 대상 환자 1201명의 평균 연령은 46±10세(최소 20 세, 최고 78세)였고 BMI의 평균은 23.4±3.2 (최소 15.0, 최 고 42.4)이었다. 전체 대상 환자 중 수술당시 폐경 전이었던 경우가 826명(BMI 평균 23.0±3.0)이었고 폐경 후였던 경우 는 375명(BMI 평균 24.3±3.3)이었으며, 양군의 BMI 평균값 은 폐경 후 여성에서 유의하게 높았다(P<0.001). 유방암환 자의 BMI 군별 분포는 저체중군 3.8%, 정상체중군 68.5%, 과체중군 24.5%, 그리고 비만군이 3.2%로 정상체중군이 제 일 많았다. 이러한 분포 형태는 20세 이상의 정상 성인 여성 들의 BMI 분포와 차이가 없었다(P=0.096). BMI가 높을수록 평균 나이가 유의하게 증가하였으며, 추적관찰기간에는 BMI 각 군 간의 차이가 없었다(Table 1).
액와림프절 전이 여부, TNM 병기, 조직학적 분화도, 프로 제스테론 수용체는 BMI 각 군에 따른 분포의 차이가 없었
다. 저체중군의 경우 폐경 전 여성에서 종괴의 크기가 작은 (T1) 경우가 55.9%으로 비만군의 22.2%에 비해 유의하게 많았고(P=0.008), 에스트로젠 수용체는 다른 체중군에서는 양성의 비율이 많은 반면 저체중군은 음성을 나타내는 경 우가 많았다(P=0.020, 폐경 후; P=0.045). 비만군은 폐경전 유방암 환자의 경우 조직학적 등급의 고분화도 비율이 83.3%로 다른 체중군에 비해 유의하게 증가된 결과를 나타 내었다(Table 1).
연령대별 BMI 평균은 20대 21.9±2.8, 30대 22.2±2.9, 40 대 23.5±3.0, 50대 24.0±3.2, 그리고 60대 이상이 24.7±3.5 으로 나타나 나이가 증가함에 따라 BMI도 유의하게 증가하 였다. 20세 이상 한국 성인여성의 경우에도 BMI는 연령이 증가함에 따라 증가하였다.(17) 과 유방암 환자의 BMI를 연 령대별로 비교해 본 결과 60세 이전의 환자의 BMI가 정상 성인 여성에 비해 낮은 경향이었고, 특히 30대와 50대에서 는 유의하게 낮았다. 60대 이상에서는 유방암 환자의 BMI 가 오히려 높게 나타났다(Table 2).
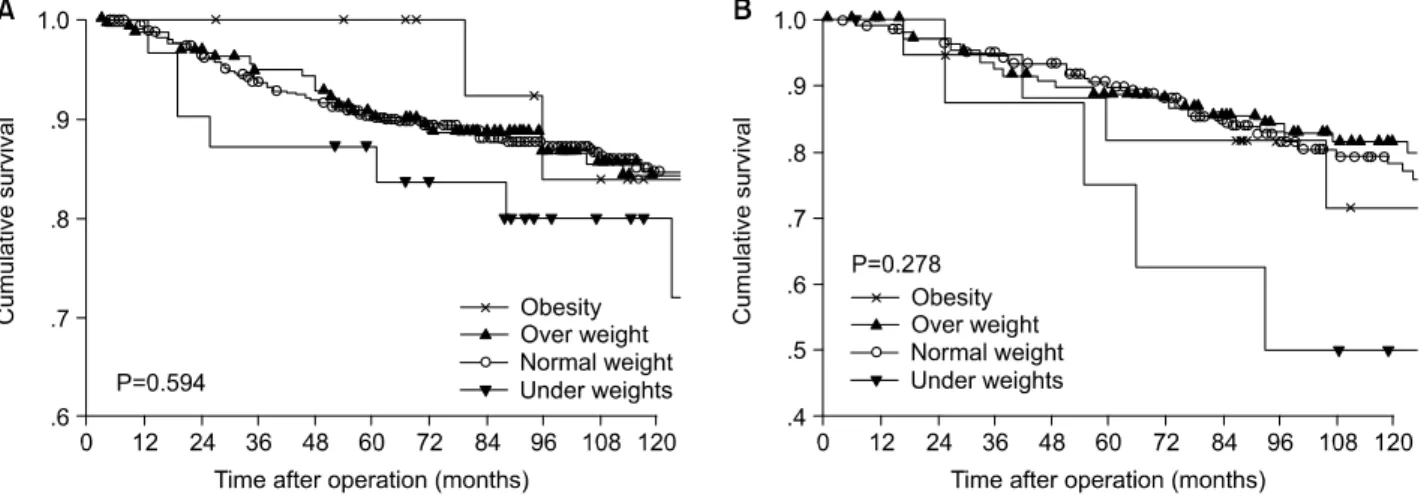
Fig. 1. Overall survival curve according to body mass index. (A) Premenopause patients, (B) Postmenopause patients. There is no significant difference between body mass index.
Table 2. Comparison of BMI between the breast cancer patients and control group (normal women) according to age group ꠚꠚꠚꠚꠚꠚꠚꠚꠚꠚꠚꠚꠚꠚꠚꠚꠚꠚꠚꠚꠚꠚꠚꠚꠚꠚꠚꠚꠚꠚꠚꠚꠚꠚꠚꠚꠚꠚꠚꠚꠚꠚꠚꠚꠚꠚꠚꠚꠚꠚꠚꠚꠚꠚꠚꠚꠚꠚꠚꠚꠚꠚꠚꠚꠚꠚꠚꠚꠚꠚꠚꠚꠚꠚꠚꠚꠚꠚꠚꠚꠚꠚꠚꠚꠚꠚꠚꠚꠚꠚꠚꠚꠚꠚꠚꠚꠚꠚꠚꠚꠚꠚꠚꠚꠚꠚꠚꠚꠚꠚꠚꠚꠚꠚꠚ
Breast cancer patients Normal women†
Age ꠏꠏꠏꠏꠏꠏꠏꠏꠏꠏꠏꠏꠏꠏꠏꠏꠏꠏꠏꠏꠏꠏꠏꠏꠏꠏꠏꠏꠏꠏꠏꠏꠏꠏ ꠏꠏꠏꠏꠏꠏꠏꠏꠏꠏꠏꠏꠏꠏꠏꠏꠏꠏꠏꠏꠏꠏꠏꠏꠏꠏꠏ P value
n Mean (±SD*) n Mean
ꠏꠏꠏꠏꠏꠏꠏꠏꠏꠏꠏꠏꠏꠏꠏꠏꠏꠏꠏꠏꠏꠏꠏꠏꠏꠏꠏꠏꠏꠏꠏꠏꠏꠏꠏꠏꠏꠏꠏꠏꠏꠏꠏꠏꠏꠏꠏꠏꠏꠏꠏꠏꠏꠏꠏꠏꠏꠏꠏꠏꠏꠏꠏꠏꠏꠏꠏꠏꠏꠏꠏꠏꠏꠏꠏꠏꠏꠏꠏꠏꠏꠏꠏꠏꠏꠏꠏꠏꠏꠏꠏꠏꠏꠏꠏꠏꠏꠏꠏꠏꠏꠏꠏꠏꠏꠏꠏꠏꠏꠏꠏꠏꠏꠏꠏ
Age group 20∼29 47 21.9±2.8 1298 21.5 0.353
30∼39 262 22.2±2.9 1460 22.8 0.001
40∼49 471 23.5±3.0 1115 23.7 0.082
50∼59 301 24.0±3.2 788 24.6 0.002
≥60 120 24.7±3.5 942 24.2 0.159
ꠏꠏꠏꠏꠏꠏꠏꠏꠏꠏꠏꠏꠏꠏꠏꠏꠏꠏꠏꠏꠏꠏꠏꠏꠏꠏꠏꠏꠏꠏꠏꠏꠏꠏꠏꠏꠏꠏꠏꠏꠏꠏꠏꠏꠏꠏꠏꠏꠏꠏꠏꠏꠏꠏꠏꠏꠏꠏꠏꠏꠏꠏꠏꠏꠏꠏꠏꠏꠏꠏꠏꠏꠏꠏꠏꠏꠏꠏꠏꠏꠏꠏꠏꠏꠏꠏꠏꠏꠏꠏꠏꠏꠏꠏꠏꠏꠏꠏꠏꠏꠏꠏꠏꠏꠏꠏꠏꠏꠏꠏꠏꠏꠏꠏꠏ
*SD = standard deviation; †1998 National health and nutrition survey-medical testing study, Ministry of health and welfare, Korea.
ꠏꠏꠏꠏꠏꠏꠏꠏꠏꠏꠏꠏꠏꠏꠏꠏꠏꠏꠏꠏꠏꠏꠏꠏꠏꠏꠏꠏꠏꠏꠏꠏꠏꠏꠏꠏꠏꠏꠏꠏꠏꠏꠏꠏꠏꠏꠏꠏꠏꠏꠏꠏꠏꠏꠏꠏꠏꠏꠏꠏꠏꠏꠏꠏꠏꠏꠏꠏꠏꠏꠏꠏꠏꠏꠏꠏꠏꠏꠏꠏꠏꠏꠏꠏꠏꠏꠏꠏꠏꠏꠏꠏꠏꠏꠏꠏꠏꠏꠏꠏꠏꠏꠏꠏꠏꠏꠏꠏꠏꠏꠏꠏꠏꠏꠏ
2) 기타 종양의 임상병리학적 인자에 따른 BMI 비교 폐경 전 유방암 환자의 경우 종괴의 크기가 2 cm 이하인 경우의 BMI가 22.5±2.9로 다른 군에 비하여 유의하게 낮았 고, TNM 병기가 높을수록 BMI의 평균값이 유의하게 높았 다. 그 외에 액와림프절 전이 여부, 그리고 호르몬 수용체에 따른 BMI의 차이는 유의하지 않았다. 폐경 후 유방암 환자에 서는 종괴의 크기, 액와림프절 전이 여부, TNM 병기 그리고 호르몬 수용체에 따른 BMI의 차이가 보이지 않았으나, 조직 학적으로 저분화일수록 BMI가 유의하게 낮았다(Table 3).
수술 후 화학요법을 받은 군과 받지 않은 군 간의 폐경 여부에 따른 BMI 평균값은 차이가 없었다. 수술 후에 호르 몬 치료를 받은 폐경 전 여성의 경우 BMI 평균값(24.0±3.5) 이 호르몬치료를 받지 않은 환자들(23.2±3.0)보다 유의하 게 높았고, 폐경 후 환자의 경우에는 차이가 없었다. 수술 후(주로 유방 부분 절제술을 받은 경우) 방사선치료의 경우 치료유무에 따른 BMI 평균값의 차이는 없었다(Table 3).
3) BMI에 따른 유방암의 예후 분석
전체생존율은 BMI에 따라 유의한 차이는 보이지 않았으
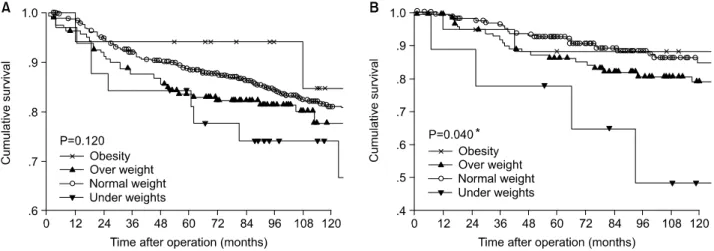
나 비정상체중군이 정상체중군에 비해 낮은 양상이었다 (Fig. 1). 무병생존율도 전체생존율과 마찬가지로 LRRFS과 DRFS 모두 BMI에 따라 대부분 큰 차이를 보이지는 않았으 나 정상체중군에 비해 저체중군이나 과체중군의 생존율이 낮은 양상이었다(Fig. 2, 3). 단 DRFS의 경우 폐경 전 군에서 는 유의하지 않았으나 폐경 후 군에서는 정상체중군에 비해 저체중군의 무병생존율이 유의하게(P=0.040) 낮았다(Fig.
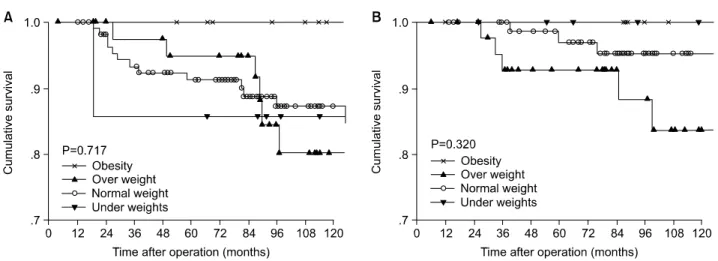
3B). 특히 수술 후 호르몬치료를 받은 환자만을 대상으로 BMI에 따른 생존율을 분석한 결과 전체생존율, LRRFS과 DRFS 모두 전체적으로 저체중군과 과체중군이 정상체중군 에 비해 낮은 양상을 보였으나 대부분 통계학적으로 의미 있는 차이가 아니었고, 폐경 후 유방암 환자의 경우 저체중 군의 전체생존율과 DRFS이 유의하게(P=0.002, 0.036) 낮았 다(Fig. 4A, 6B).
BMI, 종괴의 크기, 액와림프절 전이 유무, 에스트로젠 수용체에 대한 다변량분석 결과 종괴의 크기가 크고 액와 림프절 전이가 될수록 사망, 국소재발과 원격전이에 대한 상대위험도는 유의하게 높았으나, 호르몬 수용체와 BMI 의 각 군 간에는 이러한 상대위험도의 차이가 유의하지 않았다.
Table 3. BMI distribution and relationship of BMI to other clinicopathological parameters according to menstrual status ꠚꠚꠚꠚꠚꠚꠚꠚꠚꠚꠚꠚꠚꠚꠚꠚꠚꠚꠚꠚꠚꠚꠚꠚꠚꠚꠚꠚꠚꠚꠚꠚꠚꠚꠚꠚꠚꠚꠚꠚꠚꠚꠚꠚꠚꠚꠚꠚꠚꠚꠚꠚꠚꠚꠚꠚꠚꠚꠚꠚꠚꠚꠚꠚꠚꠚꠚꠚꠚꠚꠚꠚꠚꠚꠚꠚꠚꠚꠚꠚꠚꠚꠚꠚꠚꠚꠚꠚꠚꠚꠚꠚꠚꠚꠚꠚꠚꠚꠚꠚꠚꠚꠚꠚꠚꠚꠚꠚꠚꠚꠚꠚꠚꠚꠚ
Premenopause Postmenopause
Clinicopathological factors ꠏꠏꠏꠏꠏꠏꠏꠏꠏꠏꠏꠏꠏꠏꠏꠏꠏꠏꠏꠏꠏꠏꠏꠏꠏꠏꠏꠏꠏꠏꠏꠏꠏꠏꠏꠏ ꠏꠏꠏꠏꠏꠏꠏꠏꠏꠏꠏꠏꠏꠏꠏꠏꠏꠏꠏꠏꠏꠏꠏꠏꠏꠏꠏꠏꠏꠏꠏꠏꠏꠏꠏ
n* Mean±SD† P value n* Mean±SD† P value
ꠏꠏꠏꠏꠏꠏꠏꠏꠏꠏꠏꠏꠏꠏꠏꠏꠏꠏꠏꠏꠏꠏꠏꠏꠏꠏꠏꠏꠏꠏꠏꠏꠏꠏꠏꠏꠏꠏꠏꠏꠏꠏꠏꠏꠏꠏꠏꠏꠏꠏꠏꠏꠏꠏꠏꠏꠏꠏꠏꠏꠏꠏꠏꠏꠏꠏꠏꠏꠏꠏꠏꠏꠏꠏꠏꠏꠏꠏꠏꠏꠏꠏꠏꠏꠏꠏꠏꠏꠏꠏꠏꠏꠏꠏꠏꠏꠏꠏꠏꠏꠏꠏꠏꠏꠏꠏꠏꠏꠏꠏꠏꠏꠏꠏꠏ
T size T 1 229 22.5±2.9 129 24.3±3.3
T 2 459 23.2±3.0 186 24.3±3.3
T 3 75 23.1±2.9 0.012 18 24.5±3.1 0.966
Axillary node Negative 436 22.9±3.0 223 24.3±3.3
Positive 390 23.1±3.1 0.448 150 24.3±3.3 0.982
TNM stage 0 & I 186 22.5±2.8 105 24.4±3.2
II 489 23.1±3.0 196 24.3±3.2
III 135 23.4±3.3 0.018 59 24.0±3.8 0.759
Histologic grade 1 66 23.2±3.4 31 25.4±2.8
2 & 3 138 23.4±2.8 0.746 66 23.9±3.1 0.025
ER‡ Negative 110 23.2±3.7 59 23.7±3.4
Positive 215 23.4±3.0 0.599 105 24.7±3.1 0.074
PR§ Negative 66 23.4±4.0 66 24.5±3.2
Positive 229 23.3±3.1 0.822 85 24.5±3.0 0.994
CTx.∥ None 259 23.1±3.2 193 24.6±3.3
Done 463 23.0±3.0 0.909 126 24.2±3.2 0.365
HRTx.¶ None 541 22.9±2.9 173 24.3±3.1
Done 172 23.6±3.5 0.009 135 24.6±3.5 0.366
RTx.** None 505 23.1±3.1 241 24.5±3.3
Done 207 23.0±2.9 0.692 74 24.3±3.4 0.635
ꠏꠏꠏꠏꠏꠏꠏꠏꠏꠏꠏꠏꠏꠏꠏꠏꠏꠏꠏꠏꠏꠏꠏꠏꠏꠏꠏꠏꠏꠏꠏꠏꠏꠏꠏꠏꠏꠏꠏꠏꠏꠏꠏꠏꠏꠏꠏꠏꠏꠏꠏꠏꠏꠏꠏꠏꠏꠏꠏꠏꠏꠏꠏꠏꠏꠏꠏꠏꠏꠏꠏꠏꠏꠏꠏꠏꠏꠏꠏꠏꠏꠏꠏꠏꠏꠏꠏꠏꠏꠏꠏꠏꠏꠏꠏꠏꠏꠏꠏꠏꠏꠏꠏꠏꠏꠏꠏꠏꠏꠏꠏꠏꠏꠏꠏ
*n = number of patients; †SD = standard deviation; ‡ER = estrogen receptor; §PR = progesterone receptor; ∥CTx. group = chemotherapy treated group; ¶EndoTx. group = endocrine therapy (Tamoxifen) treated group; **RTX. group = radiotherapy treated group.
Fig. 2. Loco-regional relapse free survival curve according to body mass index. (A) Premenopause patients, (B) Postmenopause patients.
There is no significant difference between body mass index.
ꠏꠏꠏꠏꠏꠏꠏꠏꠏꠏꠏꠏꠏꠏꠏꠏꠏꠏꠏꠏꠏꠏꠏꠏꠏꠏꠏꠏꠏꠏꠏꠏꠏꠏꠏꠏꠏꠏꠏꠏꠏꠏꠏꠏꠏꠏꠏꠏꠏꠏꠏꠏꠏꠏꠏꠏꠏꠏꠏꠏꠏꠏꠏꠏꠏꠏꠏꠏꠏꠏꠏꠏꠏꠏꠏꠏꠏꠏꠏꠏꠏꠏꠏꠏꠏꠏꠏꠏꠏꠏꠏꠏꠏꠏꠏꠏꠏꠏꠏꠏꠏꠏꠏꠏꠏꠏꠏꠏꠏꠏꠏꠏꠏꠏꠏ
Fig. 4. Overall survival curve according to body mass index in endocrine therapy with Tamoxifen. (A) Premenopause patients, (B) Postmenopause patients. *There is significant differencee between under and normal group (P<0.001). *There is significant differencee between under and over group (P=0.011). *There is significant differencee between under and obesity group (P=0.046).
Fig. 3. Distant relapse free survival curve according to body mass index. (A) Premenopause patients, (B) Postmenopause patients. *There is significant differencee between under and normal group (P=0.005).
ꠏꠏꠏꠏꠏꠏꠏꠏꠏꠏꠏꠏꠏꠏꠏꠏꠏꠏꠏꠏꠏꠏꠏꠏꠏꠏꠏꠏꠏꠏꠏꠏꠏꠏꠏꠏꠏꠏꠏꠏꠏꠏꠏꠏꠏꠏꠏꠏꠏꠏꠏꠏꠏꠏꠏꠏꠏꠏꠏꠏꠏꠏꠏꠏꠏꠏꠏꠏꠏꠏꠏꠏꠏꠏꠏꠏꠏꠏꠏꠏꠏꠏꠏꠏꠏꠏꠏꠏꠏꠏꠏꠏꠏꠏꠏꠏꠏꠏꠏꠏꠏꠏꠏꠏꠏꠏꠏꠏꠏꠏꠏꠏꠏꠏꠏ
고 찰
비만은 각종 성인병의 중대한 요인일 뿐 아니라 수명을 단축시키는 중대한 건강문제로,(1) 이러한 비만도의 측정에 는 앞서 기술한 BMI가 흔히 사용되는데 남녀에 공통으로 사용할 수 있고 실제 체지방을 잘 반영하면서고 체중과 신 장만으로 구할 수 있는 매우 간단한 방법으로 실제 비만에 관한 역학조사에서 흔히 사용되고 있다.(16,18)
1998년 보건복지부에서 조사하여 1999년 출간한 국민건 강․영양조사(17)에 의하면 우리나라에서는 BMI의 비만판 정기준이 제시되지 못하고 있고 외국에서도 비만판정기준 에 대해서는 논란이 많은 것이 사실이다. 현재 제시되고 있 는 비만 판정기준은 BMI가 18.5 미만을 저체중, 25∼30이면 경도 비만, 그리고 30 이상이면 고도비만으로 정의하고 있
다. 한국 보건복지부에 의해 조사된 1998년도 20세 이상 한 국 성인여성의 BMI 평균은 23.1±0.2였다.(17) BMI의 연령 별 분포는 정상 성인 여성에서는 50대까지는 연령이 증가 할수록 BMI가 증가하나 그 이후에는 감소추세를 보이고 있 으며 50∼59세(남자의 경우 40∼49세)에 가장 높은 것으로 보고하고 있다.(1,17) 그러나 유방암 환자의 경우 연령대가 증가할수록 BMI 역시 유의하게 증가하는 경향을 보여 (Table 2) 연령이 증가할수록 BMI와 유방암 발병과의 상관 성을 시사하였다.
비만과 유방암과의 관련성에 관한 지금까지의 연구 보고 들을 보면 일반적으로 키가 크거나 체중이 많이 나가는 여 성에서 유방암 발생률이 더 높다고 보고하고 있다.(2,3) 민 등(18)은 한국의 유방암 환자 BMI는 일반여성과 차이가 없 다고 보고하였다. 더욱이 폐경여부에 따른 비만과 유방암 과의 관련성에 관한 보고들이 있는데, 즉 폐경 전 여성에서 Fig. 5. Loco-regional relapse free survival curve according to body mass index in endocrine therapy with Tamoxifen. (A) Premenopause
patients, (B) Postmenopause patients. There is no significant difference between body mass index.
Fig. 6. Distant relapse free survival curve according to body mass index in endocrine therapy with Tamoxifen. (A) Premenopause patients, (B) Postmenopause patients. *There is significant differencee between under and normal group (P=0.003).
ꠏꠏꠏꠏꠏꠏꠏꠏꠏꠏꠏꠏꠏꠏꠏꠏꠏꠏꠏꠏꠏꠏꠏꠏꠏꠏꠏꠏꠏꠏꠏꠏꠏꠏꠏꠏꠏꠏꠏꠏꠏꠏꠏꠏꠏꠏꠏꠏꠏꠏꠏꠏꠏꠏꠏꠏꠏꠏꠏꠏꠏꠏꠏꠏꠏꠏꠏꠏꠏꠏꠏꠏꠏꠏꠏꠏꠏꠏꠏꠏꠏꠏꠏꠏꠏꠏꠏꠏꠏꠏꠏꠏꠏꠏꠏꠏꠏꠏꠏꠏꠏꠏꠏꠏꠏꠏꠏꠏꠏꠏꠏꠏꠏꠏꠏ 는 BMI와 유방암 발생과는 역상관관계가 있으며, BMI가
높을수록 유방암 발생의 위험이 감소된다는 것이다.(4) 반 면, 폐경 전 여성과 조기 폐경여성의 경우 BMI는 유방암의 발생위험과 관계가 없다는 보고도 있다.(6) 폐경 후 여성에 서는 BMI와 유방암 발생이 비례관계를 보인다는 보고가 있 으며,(5) 현재 체중, 비만도(BMI), 18세 이후의 체중 증가량 등이 관련인자로 나타났다는 보고도 있다.(19,20) 우리나라 의 연구에서는 폐경 전 여성에서 체중과 비만도가 모두 유 방암 발생의 위험인자로 작용하며, 폐경 후 여성에서도 관 련성은 약하지만 체중과 비만도가 유방암 발생에 관여하고 있다고 하였다.(14)
저자들의 연구에서는 정상 성인여성과 유방암환자 모두 비슷한 양상으로 연령이 증가할수록 BMI가 증가하는 양상 을 보였다. 그러나 양 군의 BMI를 비교하면 50대까지는 유 방암군이 정상 성인 군에 비해 낮은 경향이었고, 특히 30대 와 50대에서 유의하게 낮았다. 60대 이상에서는 유방암 군 이 정상인 군에 비해 평균 BMI가 높았으나 통계적으로 유 의하지 않았다(Table 2). 이는 환자의 연령 또는 폐경상태에 따라 비만도와 유방암 발병의 상관성이 다를 수 있음을 시 사하는 것으로 판단된다. 기본적으로 우리나라 여성은 서 구화된 나라의 여성에 비해 비만도가 비교적 낮다는 점을 감안하여 비교되고 판단되어야 하겠지만, 폐경 전에는 BMI 가 낮을수록, 폐경 후에는 BMI가 높을수록 유방암의 발생 이 많다는 것을 시사하는 것으로 생각된다.
유방암 환자에 있어서 일부 예후인자와 BMI는 연관이 있 는 것으로 보고되고 있다.(21) BMI가 클수록 종양의 크기가 크다는 보고도 있으며,(10,22,23) 또 다른 연구에서는 BMI 가 큰 환자에서 높은 종양 등급, 높은 세포분열, 큰 종양 크 기를 보이나 액와림프절 전이 유무와는 연관성을 보이지 않는다고 보고하였다.(11,13) 반면에 높은 BMI를 보인 환자 군에서 액와림프절 전이가 많다는 보고도 있다.(2) 민 등 (18)은 BMI가 높을수록 종양의 크기는 증가하지만 액와림 프절 전이 여부와는 상관이 없고, 호르몬 수용체, 종양 등 급, 기타 종양 단백 발현과도 연관이 없다고 하였다. 저자들 의 경우 젊은 폐경 전 유방암 환자의 경우 BMI가 높을수록 종괴의 크기가 컸고, 액와림프절 전이 여부와는 상관이 없 었다. 한편 높은 BMI를 보이는 유방암 환자에서 에스트로 젠 수용체 또는 프로제스테론 수용체 발현이 적게 된다는 보고도 있고,(24) 그 반대로 수용체 발현이 많이 된다는 연 구 결과도 있으며,(25) BMI와 수용체 발현은 연관이 없다는 보고도 있다.(26) 그리고 p53 단백 발현은 BMI가 높은 유방 암 환자들에게 양성 발현율이 높은 것으로 보고 되고 있 다.(10,27) 본 연구에서는 폐경 전 환자에서는 유의한 차이 가 아니었으나(P=0.187), 폐경 후 환자의 경우에는 BMI가 높을수록 에스트로젠 수용체 양성률이 유의하게(P=0.045) 높았다.
비만을 포함하는 과체중은 암에 의한 사망률 이외에도
기타 다른 질병들을 포함하는 사망원인에 의한 사망률을 증가시키며, 이것은 특히 흑인보다 백인의 경우 연관성이 더 크다고 보고되었고,(7) 유방암 환자에 있어서도 좋지 않 은 예후인자로 보고되고 있다.(8,9) 또한 젊은 여성에서는 BMI가 높은 비만한 유방암 환자의 경우 마른 유방암 환자 보다 사망률이 매우 높다고 보고되었으나,(10) 저자들의 연 구에서는 BMI가 높은 과체중군에서뿐만 아니라 BMI가 낮 은 저체중군에서 재발률이 높고 생존율이 낮은 양상을 보 였다. 비만한 유방암 환자의 예후가 좋지 않은 원인에 관한 연구들을 보면, 비만한 환자의 지방 조직에서 에스트로젠 이 생성되고 에스트로젠 전구체가 증가되어 에스트로젠으 로의 전환이 증가되어 폐경기 이후에도 에스트로젠 자극이 계속될 수 있다는 것과, Sex hormone binding globulin의 감 소에 따른 혈중 에스트로젠의 증가, Insulin-like growth factor 생성의 증가로 고인슐린혈증(hyperinsulinemia)이 초 래, 과도한 지방 식이의 섭취 등을 이유로 들고 있다.(11) 그리고 비만한 여성에서 유방의 크기가 커서 종괴가 잘 촉 지 되지 않기 때문에 자가 검진이 어렵고, 또한 유방암 검진 에 참여하는 경향이 적어서 최초 유방암 진단 시 높은 병기 때 발견될 가능성이 높기 때문이라고 하였다.(12,13) 본 연 구에서는 폐경 전 환자의 경우 BMI가 낮을 때 종괴의 크기 가 의미있게 작았는데, 이것은 마른 여성일수록 유방의 크 기가 작아서 작은 크기의 종괴 일지라도 조기발견이 된다 는 것을 시사하는 것이라고 생각된다. 그러나 다른 연구에 서는 단순유방촬영이나 임상유방진찰에서 발견되는 유방 암의 병기는 BMI와 상관관계가 없다는 보고도 있다.(28) 민 등(18)은 BMI가 높을수록 종양의 병기 또한 높아진다고 하 였으며 예후와 관련해서는 통계적 의의는 없었으나 BMI 과 체중군이 저체중군에 비해 전체생존율과 무병생존율이 낮 은 경향이 있다고 하였다. 본 연구에서는 저체중군이 정상 체중군에 비해 무병생존율과 특히 DRFS가 낮았다.
본 연구 결과, BMI 18.5 미만의 저체중군의 예후가 나쁘 고 BMI 30 이상의 비만체중군의 예후가 다른 체중군에 비 해 상대적으로 좋은 결과를 보였다. 하지만 비만체중군의 대상 환자 수가 다른 군에 비해 상대적으로 적어서 정확하 게 의미를 부여하기는 어렵고, 다른 예후인자와 함께 다변 량분석까지 시행해 본 결과 BMI의 예후인자로서의 가치는 상대적으로 미약하다고 생각된다. 그러나 우리나라 여성의 미에 대한 관심이 증가되면서 마른 체형에 대한 선호도가 증가함에 따라 향후 비만체중군에 대한 관심뿐 아니라 저 체중군에 대한 연구도 이루어져야 하겠으며, 이와 동시에 폐경여부에 따른 BMI 영향의 차이점에 대한 연구도 필요할 것으로 생각된다.
REFERENCES
1) Bae MK, Lee WK, Song CH, Lee KM, Jung SP. The factors
ꠏꠏꠏꠏꠏꠏꠏꠏꠏꠏꠏꠏꠏꠏꠏꠏꠏꠏꠏꠏꠏꠏꠏꠏꠏꠏꠏꠏꠏꠏꠏꠏꠏꠏꠏꠏꠏꠏꠏꠏꠏꠏꠏꠏꠏꠏꠏꠏꠏꠏꠏꠏꠏꠏꠏꠏꠏꠏꠏꠏꠏꠏꠏꠏꠏꠏꠏꠏꠏꠏꠏꠏꠏꠏꠏꠏꠏꠏꠏꠏꠏꠏꠏꠏꠏꠏꠏꠏꠏꠏꠏꠏꠏꠏꠏꠏꠏꠏꠏꠏꠏꠏꠏꠏꠏꠏꠏꠏꠏꠏꠏꠏꠏꠏꠏ associated with body mass index of adults. J Korean Acad
Fam Med 1999;20:906-16.
2) Newman SC, Lees AW, Jenkins HJ. The effect of body mass index and oestrogen receptor level on survival of breast cancer patients. Int J Epidemiol 1997;26:484-90.
3) Zhang Y, Rosenberg L, Colton T, Cupples LA, Palmer JR, Strom BL, et al. Adult height and risk of breast cancer among white women in a case-control study. Am J Epidemiol 1996;
143(11):1123-8.
4) Vatten LJ, Kvinnsland S. Body Mass Index and risk of breast cancer. A prospective study of 23,826 Norwegian women. Int J Cancer 1990;45:440-4.
5) Barone ET, Wynder EL. A case-control study on breast cancer and body mass. Eur J Cancer 1995;31:723-8.
6) London SJ, Colditz GA, Stampfer MJ, Willett WC, Rosner B, Speizer FE. Prospective study of relative weight, height, and risk of breast cancer. JAMA 1989;262:2853-8.
7) Calle EE, Thun MJ, Petrelli JM, Rodriguez C, Heath CW Jr.
Body-mass Index and mortality in a prospective cohort of U.S.
adults. N Engl J Med 1999;341:1097-105
8) Kyogoku S, Hirohata T, Takeshita S, Nomura Y, Shigematsu T, Horie A. Survival of breast-cancer patients and body size indicators. Int J Cancer 1990;46:824-31.
9) Bastarrachea J, Hortobagyi GN, Smith TL, Kau SW, Buzdar AU. Obesity as an adverse prognostic factor for patients re- ceiving adjuvant chemotherapy for breast cancer. Ann Intern Med 1994;120:18-25.
10) Daling JR, Malone KE, Doody DR, Johnson LG, Gralow JR, Porter PL. Relation of body mass index to tumor markers and survival among young women with invasive ductal breast carcinoma. Cancer 2001;92:720-9.
11) Friedenreich CM. Review of anthropometric factors and breast cancer risk. Eur J Cancer Prev 2001;10:15-32.
12) Wee CC, McCarthy EP, Davis RB, Phillips RS. Screening for cervical and breast cancer: Is obesity an unrecognized barrier to preventive care? Ann Intern Med 2000;132:697-704.
13) Cui Y, Whiteman MK, Flaws JA, Langenberg P, Tkaczuk KH, Bush TL. Body mass and stage of breast cancer at diagnosis.
Int J Cancer 2002;98:279-83.
14) Ahn SH, Kim MK, Kim SI. Relation between body size and body mass index and breast cancer by menopausal status in Korea. J Kor Cancer Assoc 1999;31(1):72-81.
15) National Institutes of Health Consensus Development Panel on the Health Implications of Obesity. Health implications of obesity. Ann Intern Med 1985;103:1073-7.
16) Garrow JS, Webster J. Quetelet's index (W/H2) as a measure of fatness. Int J Obes 1985;9:147-53.
17) 98 National health and nutrition survey-medical testing study.
Ministry of health and welfare, Korea; 1999. p.51-6.
18) Minn YK, Park CM, Kim WB, Cho SJ, Kim A, Kim NR, et al. Distribution and prognostic effect on adjuvant hormone therapy of Body Mass Index (BMI) in Korean Breast Cancer Patients. J Korean Surg Soc 2002;62:275-81.
19) Huang Z, Hankinson SE, Colditz GA, Stampfer MJ, Hunter DJ, Manson JE, Hennekens CH, Rosner B, Speizer FE, Willett WC. Dual effects of weight and weight gain on breast cancer risk. JAMA 1997;278(17):1407-11.
20) Trentham-Dietz A, Newcomb PA, Egan KM, Titus-Ernstoff L, Baron JA, Storer BE, Stampfer M, Willett WC. Weight change and risk of postmenopausal breast cancer (United States).
Cancer Causes and Control 2000;11:533-42.
21) Ingram D, Nottage E, Siobhan N, Sparrow L, Boberts A, Wilcox D. Obesity and breast cancer-the role of the female sex hormones. Cancer 1989;64:1949-53.
22) Hall HI, Coates RJ, Uhler RJ, Brinton LA, Gammon MD, Brogan D, Potischman N, Malone KE, Swanson CA. Stage of breast cancer in relation to body mass index and bra cup size.
Int J Cancer 1999;82:23-7.
23) Sohrabi A, Sandoz J, Spratt JS, Polk HC. Recurrence of breast cancer: obesity, tumor size and axillary lymph node metas- tases. JAMA 1980;244:264-5.
24) Mannisto S, Pietinen P, Pyy M, Palmgren J, Eskelinen M, Uusitupa M. Body-size indicators and risk of breast cancer according to menopause and estrogen-receptor status. Int J Cancer 1996;68:8-13.
25) Enger SM, Ross RK, Paganini-Hill A, Carpenter CL, Bernstein L. Body size physical activity, and breast cancer hormone receptor status: results from two case-control studies. Cancer Epidemiol Biomarkers Prev 2000;9:681-7.
26) Howson CP, Kinne D, Wynder EL. Body weight, serum cho- lesterol, and stage of primary breast cancer. Cancer 1986;
58:2372-81.
27) Van der Kooy K, Rookus MA, Peterse HL, van Leeuwen FE.
p53 protein overexpression in relation to risk factors for breast cancer. Am J Epidemiol 1996;144:924-33.
28) Reeves MJ, Newcomb PA, Remington PL, Marcus PM, Mac- Kenzie WR. Body Mass and Breast Cancer, Relationship Bet- ween Method of Detection and Stage of Disease. Cancer 1996;
77:301-7.