© 2012 Korean Breast Cancer Society. All rights reserved. http://ejbc.kr | pISSN 1738-6756
INTRODUCTION
In general, obesity has been regarded as a poor prognostic factor for breast cancer [1,2]. Several mechanisms have been raised to explain the association between obesity and poor prognosis. Some reports suggested that obesity leads to poor prognosis by increasing circulating plasma level of estrogen,
insulin and insulin-like growth factor that promote tumor growth [3,4]. Obese patients tend to have larger tumors and more positive nodes [5,6].
However, there are contradictory reports indicating that obesity is not associated with the prognosis of breast cancer [7]. The prognostic role of obesity is still controversial, be- cause systemic under-treatment of obese patients, not obesity itself, might contribute to the poor prognosis, and it is difficult to strictly adjust tumor characteristics and other prognostic factors that could affect positive results [8]. Furthermore, the effect of obesity on the prognosis of breast cancer might vary according to ethnicity [9]. Compared with Western breast cancer patients, Korean patients have shown a higher portion of breast cancer in patients aged less than 35 years [10,11]
which is considered a poor prognostic factor. Young, Korean breast cancer patients tend to have a lower body mass index (BMI) [12], and these ethnic differences may affect the prog- nostic effect of obesity.
To date, there are 2 Western reports that identify the posi-
Body Mass Index Is Not Associated with Treatment Outcomes of Breast Cancer Patients Receiving Neoadjuvant Chemotherapy: Korean Data
Kyung-Hun Lee1,2,*, Bhumsuk Keam1,2,*, Seock-Ah Im1,2, Tae-Yong Kim1,2, Sae-Won Han1,2, Do-Youn Oh1,2, Jee Hyun Kim2,3, Se-Hoon Lee1,2, Wonshik Han2,4, Dong-Wan Kim1,2, Tae-You Kim1,2,5, In Ae Park2,6, Dong-Young Noh2,4, Dae Seog Heo1,2, Yung-Jue Bang1,2
1Department of Internal Medicine, Seoul National University Hospital, Seoul; 2Cancer Research Institute, Seoul National University, Seoul; 3Department of Internal Medicine, Seoul National University Bundang Hospital, Seongnam; 4Department of Surgery, Seoul National University College of Medicine, Seoul;
5Department of Molecular Medicine & Biopharmaceutical Sciences, Graduate School of Convergence Science and Technology, Seoul National University, Seoul; 6Department of Pathology, Seoul National University College of Medicine, Seoul, Korea
ORIGINAL ARTICLE
Purpose: The effects of body mass index on pathologic complete response and survival have not been reported in Korean patients with breast cancer. The purpose of this study was to evaluate the predictive or prognostic value of obesity in breast cancer receiving neoadjuvant chemotherapy. Methods: A total of 438 stage II or III breast cancer patients treated with neoadjuvant chemotherapy were enrolled and analyzed retrospectively.
Results: In the study, 319 patients (72.8%) were normal weight, 100 patients (22.8%) were overweight, and 19 patients (4.3%) were obese. Baseline clinicopathologic characteristics were not different among the groups, except for age. There were no differ- ences in pathologic complete response rate between the groups (9.7% in normal weight, 10.0% in overweight, 5.3% in obese;
p=0.804). Neither overweight nor obese patients showed a significant difference in relapse-free survival compared to normal weight patients (p=0.523 and p=0.931, respectively). Also, no significant difference in overall survival (p=0.520 and p=0.864, respectively) was observed. Conclusion: Obesity or higher body mass index was not significantly associated with pathologic complete response and survival in Korean patients with breast cancer who received neoadjuvant chemotherapy. Our results suggest that the prognostic impact of body mass index is different from that of Western patients.
Key Words: Breast neoplasms, Neoadjuvant therapy, Obesity, Prognosis
Correspondence to: Seock-Ah Im
Department of Internal Medicine, Seoul National University Hospital, Seoul National University College of Medicine, 101 Daehak-ro, Jongno-gu, Seoul 110-744, Korea
Tel: +82-2-2072-0850, Fax: +82-2-762-9662 E-mail: [email protected]
*These authors contributed equally to this work.
This study was supported in part by grants of the Korean Health Technology R&D Project, Ministry of Health & Welfare, Republic of Korea (A110448), and the Seoul National University Brain Fusion Program 2010 Research Grant to S.A. Im.
Received: June 15, 2012 Accepted: November 9, 2012
Cancer
tive predictive or prognostic value of the obesity in locally advanced breast cancer patients receiving neoadjuvant che- motherapy (NAC) [13,14]. However, the effects of obesity on pathologic complete response (pCR) to NAC and survival have not been reported in Asian patients. The purpose of this study was to evaluate the predictive or prognostic value of obesity in Korean breast cancer patients treated with NAC.
METHODS
Patients and treatment
From April 1994 to August 2008, a total of 438 patients with stage II or III breast cancer received NAC at Seoul National University Hospital. These patients were enrolled consecu- tively and analyzed retrospectively. Among the 438 patients, 370 patients received docetaxel+doxorubicin as a NAC regi- men. Thirty-three patients received doxorubicin+cyclophos-
phamide, and 15 patients received paclitaxel+gemcitabine+
trastuzumab. Twenty patients received other taxane or anthra- cycline based regimens. After completion of NAC, the patients underwent curative surgery, either breast-conserving surgery or mastectomy. This study protocol was reviewed and approved by the Institutional Review Board of Seoul National University Hospital (H-1002-051-310).
Pathology
The conventional pathologic factors, including biological factors (estrogen receptor [ER], progesterone receptor [PR], and human epidermal growth factor receptor 2 [HER2]), were examined with immunohistochemistry. Immunohisto- chemistry was performed as previously described [15,16].
The molecular phenotypes of breast cancer were classified into luminal A, luminal B, HER2, and triple-negative breast cancer (TNBC) [17]. TNBC was defined as ER(-), PR(-), and Table 1. Correlation between obesity and initial clinical variables
Characteristic Total (n=438)
No. (%) NW (n=319)
No. (%) OW (n=100)
No. (%) OB (n=19)
No. (%) p-value*
Age (yr) 45.3±9.6 44.1±9.3 48.5±10.1 48.4±9.0 <0.001
<35 50 (11.4) 42 (13.2) 8 (8.0) 0 (0.0) 0.102
≥35 388 (88.6) 277 (86.8) 92 (92.0) 19 (100.0)
Pathologic characteristics
Invasive ductal carcinoma 416 (95.0) 304 (95.3) 93 (93.0) 19 (100.0) 0.388
Others† 22 (5.0) 15 (4.7) 7 (7.0) 0 (0.0)
Initial clinical stage
IIA 19 (4.3) 12 (3.8) 6 (6.0) 1 (5.3) 0.064
IIB 78 (17.8) 56 (17.6) 20 (20.0) 2 (10.5)
IIIA 208(47.5) 163 (51.1) 37 (37.0) 8 (42.1)
IIIB 67 (15.3) 39 (12.2) 25 (25.0) 3 (15.8)
IIIC 61 (13.9) 46 (14.4) 11 (11.0) 4 (21.1)
Unknown 5 (1.1) 3 (0.9) 1 (1.0) 1 (5.3)
Neoadjuvant regimen
DA 370 (95.0) 271 (85.0) 84 (84.0) 15 (78.9) 0.416
AC 33 (7.5) 24 (7.5) 7 (7.0) 2 (10.5)
PGH 15 (3.4) 11 (3.4) 2 (2.0) 2 (10.5)
Others 20 (4.6) 13 (4.1) 7 (7.0) 0 (0.0)
Inflammatory breast cancer
Yes 35 (8.0) 23 (7.2) 10 (10.0) 2 (10.5) 0.613
No 403 (92.0) 296 (92.8) 90 (90.0) 17 (89.5)
Type of surgery
Mastectomy 193 (44.1) 171 (53.6) 62 (62.0) 12(63.2) 0.273
Breast-conserving 245 (55.9) 148 (46.4) 38 (38.0) 7 (36.8)
Adjuvant hormonal therapy
Yes 197 (45.2) 145 (45.7) 42 (43.0) 10 (52.6) 0.646
No 239 (54.8) 172 (54.3) 58 (58.0) 9 (47.4)
Adjuvant radiation therapy
Yes 376 (85.8) 279 (87.5) 83 (80.0) 14 (73.7) 0.160
No 62 (14.2) 40 (12.5) 17 (17.0) 5 (26.3)
NW=normal/underweight; OW=overweight; OB=obese; DA=docetaxel+doxorubicin; AC=doxorubicin+cyclophosphamide; PGH=paclitaxel+gemcitabine+tra stuzumab.
*p-value is based on ANOVA test for the comparison of age, and chi-square test for the comparison of other variables; †Includes invasive lobular carcinoma, muci- nous carcinoma, metaplastic carcinoma, micropapillary carcinoma, and large cell carcinoma.
HER2(-). Luminal A phenotype was defined as ER(+) or PR(+) and HER2(-) tumor, and luminal B phenotype was defined as ER(+) or PR(+) and HER2(+). ER(-), PR (-) and HER2(+) tumor was classified as HER2 phenotype. pCR was defined as the complete disappearance of invasive carcinoma in both breast and axillary lymph nodes after NAC. Residual ductal carcinoma in situ was included in the pCR category.
Statistics
BMI was calculated by dividing weight in kilograms by the square of height in meters. BMI was measured at the time of diagnosis, and categorized using the definition of the World Health Organization [18]: BMI <25 kg/m2 was categorized as normal/underweight (NW); BMI 25.0 to 29.9 kg/m2 was cate-
gorized as overweight (OW); BMI ≥30 kg/m2 was categorized as obese (OB).
The association between obesity and response to NAC was investigated in terms of pCR, relapse-free survival (RFS), and overall survival (OS). RFS was determined as the interval between the initiation of NAC and the date when disease relapse or progression was first documented, or the date of death from any cause. OS was measured from the date NAC was initiated to the date of death.
The chi-square test or analysis of variance (ANOVA) was used to compare the differences in clinicopathologic features between groups. Logistic regression analysis was used to determine the correlation between BMI and pCR. Receiver- operating characteristics (ROC) analysis was performed to Table 2. Correlation between obesity and pathologic variables
Characteristic Total (n=438)
No. (%)
NW (n=319) No. (%)
OW (n=100) No. (%)
OB (n=19)
No. (%) p-value
pCR
No 396 (90.4) 288 (90.3) 90 (90.0) 18 (94.7) 0.804
Yes 42 (9.6) 31 (9.7) 10 (10.0) 1 (5.3)
Nuclear grade
I 22 (5.0) 15 (4.7) 6 (6.0) 1 (5.3) 0.460
II 89 (20.3) 73 (22.9) 13 (13.0) 3 (15.8)
III 264 (60.3) 184 (57.7) 68 (68.0) 12 (63.2)
Unknown 63 (14.4) 47 (14.7) 13 (13.0) 3 (15.8)
Histologic grade
I 10 (2.3) 9 (3.0) 0 (0.0) 1 (5.3) 0.463
II 138 (31.5) 105 (34.4) 28 (28.0) 5 (26.3)
III 205 (46.8) 142 (46.6) 53 (53.0) 10 (52.6)
Unknown 85 (19.4) 49 (16.1) 19 (19.0) 3 (15.8)
ER
Negative 228 (52.1) 165 (51.7) 54 (54.0) 9 (47.4) 0.847
Positive 210 (47.9) 154 (48.3) 46 (46.0) 10 (52.6)
PR
Negative 294 (67.1) 213 (66.8) 67 (67.0) 14 (73.7) 0.823
Positive 144 (32.9) 106 (33.2) 33 (33.0) 5 (26.3)
HER2
0 168 (38.4) 124 (38.9) 38 (38.0) 6 (31.6) 0.949
+ 94 (21.5) 68 (21.3) 21 (21.0) 5 (26.3)
++ 79 (18.0) 56 (17.6) 18 (18.0) 5 (26.3)
+++ 94 (21.5) 68 (21.3) 23 (23.0) 3 (15.8)
Unknown 3 (0.7) 3 (0.9) 0 (0.0) 0 (0.0)
Subtype
Luminal A 168 (38.4) 123 (38.6) 37 (37.0) 8 (42.1) 0.982
Luminal B 45 (10.3) 32 (10.0) 11 (11.0) 2 (10.5)
HER2 95 (21.7) 68 (21.3) 22 (22.0) 5 (26.3)
TNBC 127 (29.0) 93 (29.2) 30 (30.0) 4 (21.1)
Unknown 3 (0.7) 3 (0.9) 0 (0.0) 0 (0.0)
Recurrence
No recurrence 326 (74.4) 239 (74.9) 72 (72.0) 15 (78.9) 0.533
Locoregional 20 (4.6) 14 (4.4) 4 (4.0) 2 (10.5)
Distant 92 (21.0) 66 (20.7) 24 (24.0) 2 (10.5)
NW=normal/underweight; OW=overweight; OB=obese; pCR=pathologic complete response; ER=estrogen receptor; PR=progesterone receptor; HER2=human epidermal growth factor receptor 2; TNBC=triple-negative breast cancer.
determine a cut-off for the hold for the prediction of pCR.
Survival function was estimated using the Kaplan-Meier product limit method. Survival comparisons between each group were made using log-rank tests. The Cox proportional hazard model (PHM) was used for prognostic significance of obesity in each group. The performance of Cox PHM was quantified in terms of the discrimination performance. Dis- crimination was evaluated using the C statistic with Harrell’s concordance index (C-index) [19], which is similar in concept to the area under the ROC curve in the logistic model, how- ever appropriate for censored data. All reported p-values were two-sided, with the level of significance established at p<0.05.
STATA statistical software version 11.0 (STATA Co., College Station, USA) was used for statistical analyses.
RESULTS
Obesity and clinicopathologic characteristics
The median age of the cohort was 45 years (range, 20-84 years). Three hundred nineteen patients (72.8%) were classi-
fied as NW, 100 patients (22.8%) were OW, and 19 patients (4.3%) were OB. Baseline clinicopathologic characteristics were not different among each group, except for age (Table 1).
NW patients were younger than OB or OW patients (mean age, 44.1±9.3 in NW, 48.5±10.1 in OW, 48.4±9.0 in OB, p<
0.001). BMI, as continuous variable, was correlated with age (Pearson’s correlation coefficient=0.275, p<0.001). OB patients were not associated with ER negativity. Molecular subtypes were not different according to BMI categories (Table 2). NW, OW, and OB patients had a similar proportion of TNBC.
Obesity and pCR to NAC
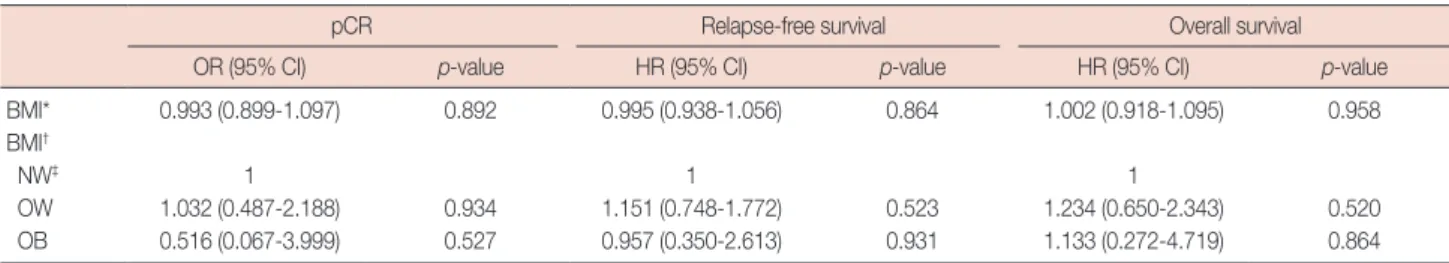
Overall, the pCR rate was 9.6%. The pCR rate was not differ- ent among each group (9.7% in NW, 10.0% in OW, 5.3% in OB, p=0.804 by chi-square test). On the univariate logistic regression model, there was no association between pCR and BMI as a continuous variable (odds ratio [OR], 0.993; 95%
confidence interval [CI], 0.899-1.097; p=0.892). BMI as a categorical variable did not show statistical significance with pCR (Table 3).
Figure 1. (A) Relapse-free survival by body mass index (BMI) categories, and (B) overall survival by BMI categories.
NW=normal/underweight; OW=overweight; OB=obese.
A
Survival probability
0 24 48 72 96 Relapse-free survival (mo)
1.00
0.75
0.50
0.25
0.00
NW
NW OW
OW
NW OW OB
NW OW OB OB
OB
p=0.455
At risk
NW 318 203 42 8 3
OW 100 56 17 4 3
OB 19 10 2 1 0
B
Survival probability
0 24 48 72 96 Overall survival (mo)
1.00
0.75
0.50
0.25
0.00
p=0.324
At risk
NW 318 235 59 14 5
OW 100 65 20 6 3
OB 19 13 2 1 0
Table 3. Logistic regression model for pCR and Cox proportional hazard regression model for relapse-free survival and overall survival
pCR Relapse-free survival Overall survival
OR (95% CI) p-value HR (95% CI) p-value HR (95% CI) p-value
BMI* 0.993 (0.899-1.097) 0.892 0.995 (0.938-1.056) 0.864 1.002 (0.918-1.095) 0.958
BMI†
NW‡ 1 1 1
OW 1.032 (0.487-2.188) 0.934 1.151 (0.748-1.772) 0.523 1.234 (0.650-2.343) 0.520
OB 0.516 (0.067-3.999) 0.527 0.957 (0.350-2.613) 0.931 1.133 (0.272-4.719) 0.864
pCR=pathologic complete response; OR=odds ratio; CI=confidence interval; HR=hazard ratio; BMI= body mass index; NW=normal/underweight; OW=over- weight; OB=obese.
*As continuous variable; †As categorical variable; ‡Reference group.
Obesity and survival
With a median follow-up of 35.4 months, there were 112 (25.6%) recurrent patients, and 49 (11.2%) patients died. All of the deaths were from breast cancer progression, and there were no deaths from obesity related complications such as cardiovascular disease or diabetes. Kaplan-Meier survival curve indicated that RFS or OS was not different by BMI cate- gories (log-rank p=0.455 and p=0.324, respectively) (Figure 1). In univariate Cox PHM, OB or OW patients did not show a difference in RFS compared to NW patients (hazard ratio [HR], 1.151; 95% CI, 0.748-1.772; p=0.523, and HR, 0.957;
95% CI, 0.350-2.613; p=0.931, respectively), and also no difference in OS (HR, 1.234; 95% CI, 0.650-2.343; p=0.520, and HR, 1.133; 95% CI, 0.272-4.719; p=0.864, respectively).
Harrell’s C-index of BMI was 0.506 in discriminating RFS, and 0.501 in discriminating OS, which means that BMI has no discriminatory ability for RFS or OS in these Cox PHMs.
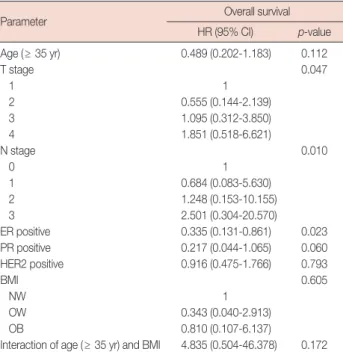
When analyzed separately by ER status, BMI remained non- significant in both ER positive and negative patients (data not shown). Multivariate analysis of clinical and pathological parameters using Cox proportional hazard model for OS is shown in Table 4. As interactions between age and BMI were suggested (Table 1), Table 4 shows the results of models that indicate interactions between age and BMI, and OS was not
Table 4. Multivariate analysis of clinical and pathological parameters us- ing Cox proportional hazard model for overall survival
Parameter Overall survival
HR (95% CI) p-value
Age (≥ 35 yr) 0.489 (0.202-1.183) 0.112
T stage 0.047
1 1
2 0.555 (0.144-2.139)
3 1.095 (0.312-3.850)
4 1.851 (0.518-6.621)
N stage 0.010
0 1
1 0.684 (0.083-5.630)
2 1.248 (0.153-10.155)
3 2.501 (0.304-20.570)
ER positive 0.335 (0.131-0.861) 0.023
PR positive 0.217 (0.044-1.065) 0.060
HER2 positive 0.916 (0.475-1.766) 0.793
BMI 0.605
NW 1
OW 0.343 (0.040-2.913)
OB 0.810 (0.107-6.137)
Interaction of age (≥ 35 yr) and BMI 4.835 (0.504-46.378) 0.172 pCR=pathologic complete response; HR=hazard ratio; CI=confidence inter- val; ER=estrogen receptor; PR=progesterone receptor; HER2=human epi- dermal growth factor receptor 2; BMI=body mass index; NW=normal/under- weight; OW=overweight; OB=obese.
significantly different among BMI groups. Models with BMI and no interaction term gave consistent results (data not shown).
DISCUSSION
In the present study, neither obesity nor higher BMI was associated significantly with pCR and survival in Korean patients with breast cancer who received NAC. Obesity has been regarded as a poor prognostic factor, although several studies showed no association between obesity and clinical outcomes, like the present study [7]. Several meta-analyses have indicated that obesity adversely influences the clinical outcomes in breast cancer [20-22]. However, the majority of the studies were conducted in Western countries, except for in 2 Japanese reports [23,24], and data is limited in Asian patients.
Hence, it seems that we may need to pay attention when adapt- ing the prognostic value of obesity in studies acquired from Western countries to Asian patients.
In locally advanced breast cancer patients receiving NAC, 2 reports from M.D. Anderson Cancer Center [13,14] are avail- able. Dawood et al. [13] analyzed 602 patients, and reported that OB or OW patients had a significantly worse recurrence- free survival and OS than NW patients (p=0.001 and p=0.001, respectively). However, the pCR rate of OB or OW patients were not different than that of NW (13.5% in NW, 10.3%
in OW, 8.8% in OB, p=0.38) in the study. Litton et al. [14]
reported that pCR was not associated with BMI in univariate logistic analysis but significant on multivariate logistic analysis.
Plausible explanations for the lack of association between obesity and clinical outcomes are: First, non-breast cancer related death could contribute, because OB or OW itself has a higher mortality than NW [25], mainly due to cardiovascular disease. Litton et al. [14] reported that OB or OW status was not associated with progression-free survival or breast cancer- specific survival, but significantly associated with OS when adjusting for other prognostic factors. Dignam et al. [7] found that OB patients had greater all-cause mortality due to causes unrelated to breast cancer in node negative, ER positive breast cancer. This suggested that non-cancer causes of death could contribute to the unfavorable outcomes of OB patients [26].
In contrast to the previous reports where non-cancer mortali- ty could confound the data, all deaths were attributed to pro- gression of breast cancer in the present study.
The second plausible explanation is ethnic differences. In 2 reports from M.D. Anderson Cancer Center, OB patients were more likely to have hormone receptor negativity [14], advanced stage [13,14], and high tumor grade [13]. On the contrary, this trend was not observed in the present study.
This may be attributed to differences in epidemiology and
tumor biology of breast cancer between Asians and Westerns [11,27]. Korean patients have shown higher ER negative rates and a higher portion of young breast cancer patients than Western patients [10,11]. The ER negative rate in our study (52.1%) was higher than observed in Western populations (39.9%) [14]. The peak incidence age of breast cancer in Korean patients occurs in women aged 45 to 49 years, which is 10 years younger than the peak at which breast cancer occurs in Western women [11]. The median age of patients in our study was 45 years, which is comparable with Korean epidemiologic data. In Korea, young breast cancer patients demonstrate a higher ER negative rate [10], and tend to have lower BMI [12], also shown in the present study. However, in Western coun- tries, African-American breast cancer patients have higher BMI [9] and higher proportion of TNBC [28], this could con- tribute to obesity being a poor prognosis. Western obese and overweight patients were more likely to present with TNBC [29], while our study population did not show this.
Third, the patterns of obesity in Korean population were different from those of Western populations. The patients in the present study were leaner than their Western counterparts.
The prevalence of obesity in our study was 4.3% which is lower than 30% [14] or 34% [13] in Western populations. Because of the different proportion of BMI categories, a different cut- off for obesity in Asian has been proposed [30]. However, we found no significant differences in pCR or survival according to this criteria (data not shown). Moreover, we found no opti- mal cut-off for BMI in the ROC analysis for determining an optimal cut-off value of BMI to predict pCR. In addition, a meta-analysis have indicated that the adverse effect of obesity on breast cancer may be overestimated because of publication bias against negative studies [22].
The present study is the first in an Asian population that identifies the association between obesity and pCR. Further- more, this is a report of homogenous patient population from a single center with a relatively large sample size (n=438). On the other hand, retrospective single institution studies such as ours have limitations and should be further validated in a larger population.
In conclusion, obesity or higher BMI plays neither a predic- tive nor a prognostic role in association with breast cancer in our Korean patients who received NAC. Our results suggest that the prognostic impact of BMI in Asian breast cancer patients may be different from that of Western patients.
ACKNOWLEDGEMENTS
We thank BioMed Proofreading LLC for English editing.
CONFLICT OF INTEREST
The authors declare that they have no competing interests.
REFERENCES
1. Bastarrachea J, Hortobagyi GN, Smith TL, Kau SW, Buzdar AU. Obesity as an adverse prognostic factor for patients receiving adjuvant chemo- therapy for breast cancer. Ann Intern Med 1994;120:18-25.
2. Carmichael AR. Obesity as a risk factor for development and poor prognosis of breast cancer. BJOG 2006;113:1160-6.
3. Goodwin PJ, Ennis M, Pritchard KI, Trudeau ME, Koo J, Madarnas Y, et al. Fasting insulin and outcome in early-stage breast cancer: results of a prospective cohort study. J Clin Oncol 2002;20:42-51.
4. McTiernan A, Rajan KB, Tworoger SS, Irwin M, Bernstein L, Baumgart- ner R, et al. Adiposity and sex hormones in postmenopausal breast can- cer survivors. J Clin Oncol 2003;21:1961-6.
5. Cui Y, Whiteman MK, Flaws JA, Langenberg P, Tkaczuk KH, Bush TL.
Body mass and stage of breast cancer at diagnosis. Int J Cancer 2002;98:
279-83.
6. Zumoff B, Dasgupta I. Relationship between body weight and the inci- dence of positive axillary nodes at mastectomy for breast cancer. J Surg Oncol 1983;22:217-20.
7. Dignam JJ, Wieand K, Johnson KA, Fisher B, Xu L, Mamounas EP. Obe- sity, tamoxifen use, and outcomes in women with estrogen receptor- positive early-stage breast cancer. J Natl Cancer Inst 2003;95:1467-76.
8. Goodwin PJ, Boyd NF. Body size and breast cancer prognosis: a critical review of the evidence. Breast Cancer Res Treat 1990;16:205-14.
9. Dignam JJ, Wieand K, Johnson KA, Raich P, Anderson SJ, Somkin C, et al. Effects of obesity and race on prognosis in lymph node-negative, es- trogen receptor-negative breast cancer. Breast Cancer Res Treat 2006;
97:245-54.
10. Ahn SH, Son BH, Kim SW, Kim SI, Jeong J, Ko SS, et al. Poor outcome of hormone receptor-positive breast cancer at very young age is due to tamoxifen resistance: nationwide survival data in Korea: a report from the Korean Breast Cancer Society. J Clin Oncol 2007;25:2360-8.
11. Yoo KY, Kang D, Park SK, Kim SU, Shin A, Yoon H, et al. Epidemiology of breast cancer in Korea: occurrence, high-risk groups, and prevention.
J Korean Med Sci 2002;17:1-6.
12. Moon HG, Han W, Noh DY. Underweight and breast cancer recurrence and death: a report from the Korean Breast Cancer Society. J Clin Oncol 2009;27:5899-905.
13. Dawood S, Broglio K, Gonzalez-Angulo AM, Kau SW, Islam R, Horto- bagyi GN, et al. Prognostic value of body mass index in locally advanced breast cancer. Clin Cancer Res 2008;14:1718-25.
14. Litton JK, Gonzalez-Angulo AM, Warneke CL, Buzdar AU, Kau SW, Bondy M, et al. Relationship between obesity and pathologic response to neoadjuvant chemotherapy among women with operable breast cancer. J Clin Oncol 2008;26:4072-7.
15. Keam B, Im SA, Kim HJ, Oh DY, Kim JH, Lee SH, et al. Prognostic im- pact of clinicopathologic parameters in stage II/III breast cancer treated with neoadjuvant docetaxel and doxorubicin chemotherapy: paradoxi- cal features of the triple negative breast cancer. BMC Cancer 2007;7:203.
16. Lee KH, Im SA, Oh DY, Lee SH, Chie EK, Han W, et al. Prognostic sig-
nificance of bcl-2 expression in stage III breast cancer patients who had received doxorubicin and cyclophosphamide followed by paclitaxel as adjuvant chemotherapy. BMC Cancer 2007;7:63.
17. Carey LA, Dees EC, Sawyer L, Gatti L, Moore DT, Collichio F, et al. The triple negative paradox: primary tumor chemosensitivity of breast can- cer subtypes. Clin Cancer Res 2007;13:2329-34.
18. WHO Expert Consultation. Appropriate body-mass index for Asian populations and its implications for policy and intervention strategies.
Lancet 2004;363:157-63.
19. Harrell FE Jr, Lee KL, Mark DB. Multivariable prognostic models: issues in developing models, evaluating assumptions and adequacy, and mea- suring and reducing errors. Stat Med 1996;15:361-87.
20. Berclaz G, Li S, Price KN, Coates AS, Castiglione-Gertsch M, Rudens- tam CM, et al. Body mass index as a prognostic feature in operable breast cancer: the International Breast Cancer Study Group experience.
Ann Oncol 2004;15:875-84.
21. Chlebowski RT, Aiello E, McTiernan A. Weight loss in breast cancer patient management. J Clin Oncol 2002;20:1128-43.
22. Ryu SY, Kim CB, Nam CM, Park JK, Kim KS, Park J, et al. Is body mass index the prognostic factor in breast cancer? A meta-analysis. J Korean Med Sci 2001;16:610-4.
23. Kimura M. Obesity as prognostic factors in breast cancer. Diabetes Res Clin Pract 1990;10 Suppl 1:S247-51.
24. Kyogoku S, Hirohata T, Takeshita S, Nomura Y, Shigematsu T, Horie A.
Survival of breast-cancer patients and body size indicators. Int J Cancer 1990;46:824-31.
25. Allison DB, Fontaine KR, Manson JE, Stevens J, VanItallie TB. Annual deaths attributable to obesity in the United States. JAMA 1999;282:
1530-8.
26. Dignam JJ, Mamounas EP. Obesity and breast cancer prognosis: an ex- panding body of evidence. Ann Oncol 2004;15:850-1.
27. Li CI, Malone KE, Daling JR. Differences in breast cancer stage, treatment, and survival by race and ethnicity. Arch Intern Med 2003;163:49-56.
28. Dolle JM, Daling JR, White E, Brinton LA, Doody DR, Porter PL, et al.
Risk factors for triple-negative breast cancer in women under the age of 45 years. Cancer Epidemiol Biomarkers Prev 2009;18:1157-66.
29. Liedtke C, Mazouni C, Hess KR, André F, Tordai A, Mejia JA, et al. Re- sponse to neoadjuvant therapy and long-term survival in patients with triple-negative breast cancer. J Clin Oncol 2008;26:1275-81.
30. Kanazawa M, Yoshiike N, Osaka T, Numba Y, Zimmet P, Inoue S. Crite- ria and classification of obesity in Japan and Asia-Oceania. World Rev Nutr Diet 2005;94:1-12.