• 검색 결과가 없습니다.

Association of Body Mass Index with Risk of Major Adverse Cardiovascular Events and Mortality in People with Diabetes

N/A
N/A
Protected

Academic year: 2021

Share "Association of Body Mass Index with Risk of Major Adverse Cardiovascular Events and Mortality in People with Diabetes"

Copied!
10
0
0

로드 중.... (전체 텍스트 보기)

전체 글

(1)

Association of Body Mass Index with Risk of Major Adverse Cardiovascular Events and Mortality in People with Diabetes

Dong Hun Lee

1

, Kyoung Hwa Ha

2,3

, Hyeon Chang Kim

4,5

, Dae Jung Kim

2,3,

*

1

Ajou University School of Medicine, Suwon;

2

Department of Endocrinology and Metabolism and

3

Cardiovascular and Metabolic Disease Etiology Research Center, Ajou University School of Medicine, Suwon;

4

Department of Preventive Medicine and

5

Cardiovascular and Metabolic Diseases Etiology Research Center, Yonsei University College of Medicine, Seoul, Korea

Background: The relationship between cardiovascular and all-cause mortality and obesity in people with dia- betes is still controversial. We investigated the association of body mass index (BMI) with the risk of major ad- verse cardiovascular events (MACE) and all-cause mortality in people with diabetes.

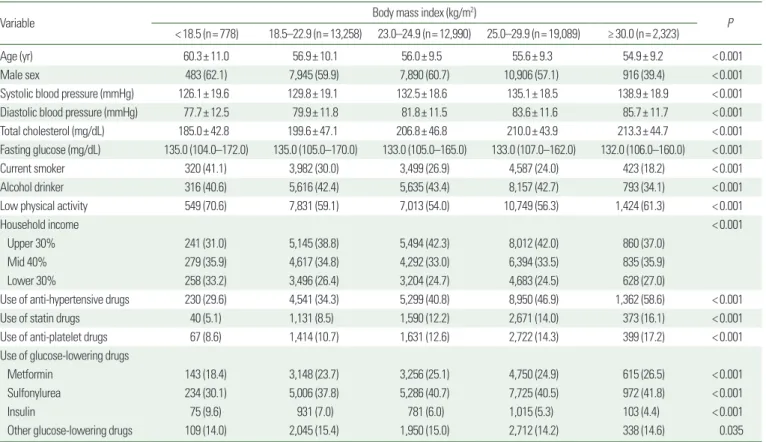
Methods: In total, 48,438 people with diabetes were enrolled in the Korean National Health Insurance Service- National Health Screening Cohort from 2002 to 2003 and were followed until 2013. Baseline BMI was catego- rized as underweight (<18.5 kg/m

2

), normal-weight (18.5–22.9 kg/m

2

), overweight (23.0–24.9 kg/m

2

), obese class I (25.0–29.9 kg/m

2

), and obese class II (≥30.0 kg/m

2

).

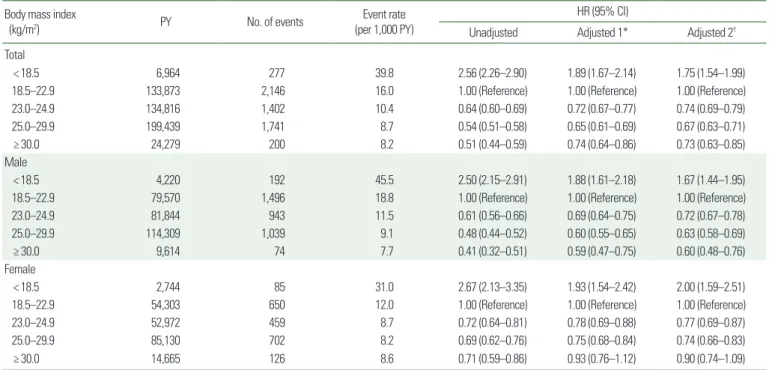
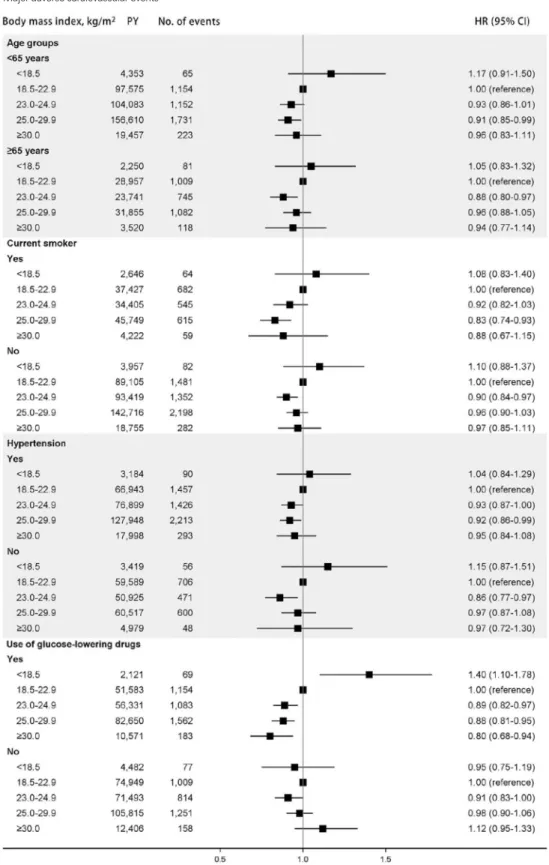
Results: During a median of 10.7 years of follow-up (interquartile range, 10.2–11.2 years), there were 7,360 MACE and 5,766 deaths. Compared to those in the normal-weight group, the fully adjusted hazard ratios (HRs) for MACE were 1.09 (95% confidence interval [CI], 0.92−1.29), 0.91 (95% CI, 0.85−0.97), 0.93 (95% CI, 0.88−0.98), and 0.95 (95% CI, 0.84−1.06) for underweight, overweight, obese class I, and obese class II groups, respectively.

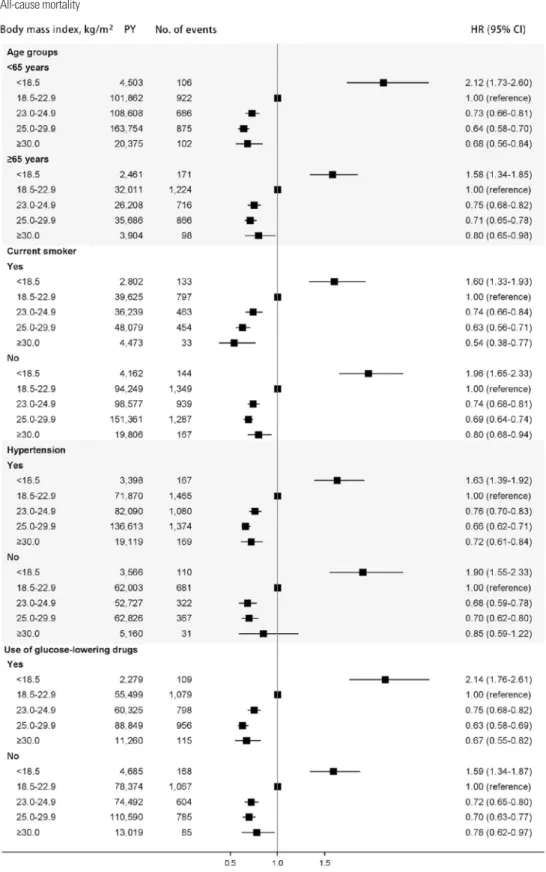
The HRs for all-cause mortality were 1.75 (95% CI, 1.54−1.99), 0.74 (95% CI, 0.69−0.79), 0.67 (95% CI, 0.63−0.71), and 0.73 (95% CI, 0.63−0.85) for underweight, overweight, obese class I, and obese class II groups, respectively.

Conclusion: In people with diabetes, underweight people had a higher risk for all-cause mortality, whereas overweight or obese people had a lower risk for MACE and all-cause mortality than those with a normal weight.

Key words: Death, Body mass index, Cardiovascular diseases, Diabetes mellitus

Received January 25, 2018 Reviewed February 12, 2018 Accepted February 19, 2018

* Corresponding author Dae Jung Kim

https://orcid.org/0000-0003-1025-2044 Department of Endocrinology and Metabolism, Ajou University School of Medicine, 164 World cup-ro, Yeongtong-gu, Suwon 16499, Korea Tel: +82-31-219-5128

Fax: +82-31-219-4497 E-mail: [email protected]

INTRODUCTION

Cardiovascular complications occur more commonly in people with diabetes. 1 The association between obesity and an increased risk of cardiovascular disease (CVD) is well established in the gen- eral population. 2,3 Although major adverse cardiovascular events (MACE) are critical health endpoints among people with diabetes, little is known about the relationship between body mass index (BMI) and MACE in people with diabetes. 4-7

There has been an ongoing debate over the relationship between

BMI and mortality in people with diabetes. Many observational studies have reported an “obesity paradox” in diabetics, indicating that people with diabetes and an elevated BMI have lower mortali- ty rates than those with BMIs that are considered to reflect normal weight. 8-11 On the other hand, a recent large cohort study suggested a J-shaped association between BMI at the time of diabetes diagno- sis and all-cause mortality, with the lowest risk observed among participants of normal weight. 12

We investigated the association of BMI with MACE and all- cause mortality in people with diabetes using the Korean National

Copyright © 2018 Korean Society for the Study of Obesity

This is an Open Access article distributed under the terms of the Creative Commons Attribution Non-Commercial License (http://creativecommons.org/licenses/by-nc/4.0/) which per- mits unrestricted non-commercial use, distribution, and reproduction in any medium, provided the original work is properly cited.

Original Article eISSN 2508-7576

2017-03-16 https://crossmark-cdn.crossref.org/widget/v2.0/logos/CROSSMARK_Color_square.svg

(2)

Health Insurance Service-National Health Screening Cohort (NHIS-HEALS).

METHODS Study participants

The Korean NHIS, a compulsory single-payer national health care insurance system, covers 98% of the population residing with- in the territory of Korea, and it administers all databases on health service utilization. The NHIS provides free regular health screen- ing tests to insured employees of all ages and to self-employed per- sons or dependents aged ≥ 40 years. The NHIS-HEALS was de- veloped in 2002 as a random sample of 10% of the population be- tween the ages of 40 and 79 years who completed a National Health Screening test in 2002 or 2003. The resulting NHIS-HEALS study enrolled 514,795 participants, and the database contains informa- tion regarding demographic characteristics, medical claims (includ- ing diagnostic and treatment codes), health surveys, physical exam- inations, and biochemical tests. 13

For this study, we selected people with diabetes between 2002 and 2003. Diabetes was defined by the following criteria: diag- nosed with diabetes (10th revision of the International Classifica- tion of Diseases [ICD-10] codes E10−E14) more than twice, re- ceiving a prescription for oral glucose-lowering medications (Ana- tomical Therapeutic Chemical [ATC] Classification System code A10B) for more than 30 days, receiving a prescription for insulin (ATC code A10A) as an outpatient, or fasting blood glucose level of ≥ 126 mg/dL. A total of 68,447 people with diabetes were se- lected. We excluded 14,138 people who had prior history of CVD or cancer and 5,871 people without variables used in the analysis.

Ultimately, 48,438 people were selected for statistical analysis. Fol- low-up was defined as the period of time from the date of the health screening test to the first outcome event, date of death, or end of the study period (December 31, 2013), whichever came first. The study protocol was reviewed and approved by the Institu- tional Review Board of Ajou University Hospital (IRB No. AJIRB- MED-EXP-17-253). Review board requirements for written in- formed consent were waived because all personal identifying infor- mation was removed from the dataset prior to analysis.

Exposure and covariates

Demographic and anthropometric data collected at baseline in 2002 or 2003 included age, sex, height, weight, and blood pressure.

BMI was calculated as weight (kg) divided by height squared (m 2 ) and classified according to Asian-specific criteria 14 as: underweight (<18.5 kg/m 2 ), normal-weight (18.5–22.9 kg/m 2 ), overweight (23.0–24.9 kg/m 2 ), obese class I (25.0–29.9 kg/m 2 ), and obese class II (≥ 30.0 kg/m 2 ). Baseline fasting blood samples were taken to measure total cholesterol and glucose levels. Smoking status (smoker, former smoker, or nonsmoker), alcohol consumption (drinker or nondrinker), and physical activity (low or medium- high) were obtained from self-report questionnaires. Household income was categorized into three groups (lowest 30%, middle 40%, and highest 30%). Prescribed drugs were classified using the following ATC criteria: anti-hypertensive drugs (ATC codes C02–

C03 or C07–C09), statin drugs (ATC code C10AA), anti-platelet drugs (ATC code B01), and glucose-lowering drugs (ATC code A10). Glucose-lowering drugs included metformin, sulfonylurea, insulin, or other glucose-lowering drugs.

Outcomes

The outcomes of the analysis were incidence of MACE and all- cause mortality. We defined MACE as a composite of hospitaliza- tion for myocardial infarction (ICD-10 codes I21−I22), stroke (ICD-10 codes I60−I69 or G45.9), and cardiovascular death (ICD-10 codes I00−I99). All-cause mortality and cardiovascular death were defined by death status in the NHIS database, which was linked to the National Death Registry using unique resident registration numbers.

Statistical analyses

Normally distributed data are presented as mean± standard de-

viation (SD), whereas nonparametric data are presented as median

and interquartile range by BMI. Categorical data are expressed as

number and frequency (%). We used Kaplan-Meier analyses with

log-rank tests to compare survival outcomes by BMI category. Cox

proportional hazards models were used to evaluate the association

of BMI at baseline with MACE and mortality, calculating hazard

ratio (HR) and 95% confidence interval (CI) and adjusting for the

following potential confounders: sex, age, systolic blood pressure,

(3)

fasting glucose, total cholesterol, drinking status, smoking status, physical exercise, household income, use of anti-hypertensive drugs, use of statin drugs, use of anti-platelet drugs, and use of glu- cose-lowering drugs. All analyses were conducted using SAS ver- sion 9.4 (SAS Institute Inc., Cary, NC, USA).

RESULTS

In total, 48,438 people (male, 58.1%; median age, 56.1 years) were included in the analysis. Table 1 summarizes the baseline characteristics of people with diabetes stratified by baseline BMI.

People with a higher BMI at baseline had higher systolic blood pressure, diastolic blood pressure, and total cholesterol, whereas they had lower fasting glucose. However, people with BMIs in the underweight range were the oldest (mean± SD, 60.3± 11.0 years), and this group had the highest proportions of males, current smok- ers, those engaged in low levels of physical activity, and insulin users.

People classified as obese class II were the youngest (mean±SD, 54.9± 9.2 years); this group had the highest proportions of females,

nondrinkers, users of metformin and sulfonylurea, and the lowest proportion of current smokers. The baseline characteristics of male and female with diabetes are summarized in the supplementary data according to baseline BMI (Supplementary Tables 1 and 2).

During a median of 10.7 years of follow-up (interquartile range, 10.2–11.2 years), there were 7,360 MACE and 5,766 deaths. Ka- plan-Meier survival curves differed by BMI classification. In partic- ular, people with an underweight BMI had an overt risk of MACE incidence and all-cause mortality compared with people with a normal-weight BMI (Fig. 1).

Table 2 shows MACE risk by BMI group. In an unadjusted mod- el, underweight BMI was associated with a significantly higher risk of MACE (HR, 1.32; 95% CI, 1.11−1.56) compared to normal- weight BMI. The association was not statistically significant after additional adjustments for confounders (HR, 1.09; 95% CI, 0.92−

1.29). An overweight and obese BMI were associated with a signifi- cantly lower risk of MACE (overweight: HR, 0.87; 95% CI, 0.81−

0.92; obese class I: HR, 0.87; 95% CI, 0.82−0.92; obese class II:

HR, 0.86; 95% CI, 0.77−0.97). This lower MACE risk remained Table 1. Baseline characteristics of the study participants by body mass index categories

Variable Body mass index (kg/m

2

)

< 18.5 (n= 778) 18.5–22.9 (n= 13,258) 23.0–24.9 (n= 12,990) 25.0–29.9 (n= 19,089) ≥ 30.0 (n= 2,323) P

Age (yr) 60.3± 11.0 56.9± 10.1 56.0± 9.5 55.6± 9.3 54.9± 9.2 < 0.001

Male sex 483 (62.1) 7,945 (59.9) 7,890 (60.7) 10,906 (57.1) 916 (39.4) < 0.001

Systolic blood pressure (mmHg) 126.1± 19.6 129.8± 19.1 132.5± 18.6 135.1± 18.5 138.9± 18.9 < 0.001

Diastolic blood pressure (mmHg) 77.7± 12.5 79.9± 11.8 81.8± 11.5 83.6± 11.6 85.7± 11.7 < 0.001

Total cholesterol (mg/dL) 185.0± 42.8 199.6± 47.1 206.8± 46.8 210.0± 43.9 213.3± 44.7 < 0.001

Fasting glucose (mg/dL) 135.0 (104.0–172.0) 135.0 (105.0–170.0) 133.0 (105.0–165.0) 133.0 (107.0–162.0) 132.0 (106.0–160.0) < 0.001

Current smoker 320 (41.1) 3,982 (30.0) 3,499 (26.9) 4,587 (24.0) 423 (18.2) < 0.001

Alcohol drinker 316 (40.6) 5,616 (42.4) 5,635 (43.4) 8,157 (42.7) 793 (34.1) < 0.001

Low physical activity 549 (70.6) 7,831 (59.1) 7,013 (54.0) 10,749 (56.3) 1,424 (61.3) < 0.001

Household income < 0.001

Upper 30% 241 (31.0) 5,145 (38.8) 5,494 (42.3) 8,012 (42.0) 860 (37.0)

Mid 40% 279 (35.9) 4,617 (34.8) 4,292 (33.0) 6,394 (33.5) 835 (35.9)

Lower 30% 258 (33.2) 3,496 (26.4) 3,204 (24.7) 4,683 (24.5) 628 (27.0)

Use of anti-hypertensive drugs 230 (29.6) 4,541 (34.3) 5,299 (40.8) 8,950 (46.9) 1,362 (58.6) < 0.001

Use of statin drugs 40 (5.1) 1,131 (8.5) 1,590 (12.2) 2,671 (14.0) 373 (16.1) < 0.001

Use of anti-platelet drugs 67 (8.6) 1,414 (10.7) 1,631 (12.6) 2,722 (14.3) 399 (17.2) < 0.001

Use of glucose-lowering drugs

Metformin 143 (18.4) 3,148 (23.7) 3,256 (25.1) 4,750 (24.9) 615 (26.5) < 0.001

Sulfonylurea 234 (30.1) 5,006 (37.8) 5,286 (40.7) 7,725 (40.5) 972 (41.8) < 0.001

Insulin 75 (9.6) 931 (7.0) 781 (6.0) 1,015 (5.3) 103 (4.4) < 0.001

Other glucose-lowering drugs 109 (14.0) 2,045 (15.4) 1,950 (15.0) 2,712 (14.2) 338 (14.6) 0.035

Values are presented as mean± standard deviation, number (%), or median (25th–75th percentile).

(4)

Table 2. HRs for major adverse cardiovascular events risk in people with diabetes by body mass index categories Body mass index

(kg/m

2

) PY No. of events Event rate

(per 1,000 PY)

HR (95% CI)

Unadjusted Adjusted 1* Adjusted 2

Total

< 18.5 6,603 146 22.1 1.32 (1.11–1.56) 1.06 (0.90–1.25) 1.09 (0.92–1.29)

18.5–22.9 126,532 2,163 17.1 1.00 (Reference) 1.00 (Reference) 1.00 (Reference)

23.0–24.9 127,824 1,897 14.8 0.87 (0.81–0.92) 0.93 (0.87–0.99) 0.91 (0.85–0.97)

25.0–29.9 188,465 2,813 14.9 0.87 (0.82–0.92) 0.97 (0.92–1.02) 0.93 (0.88–0.98)

≥ 30.0 22,977 341 14.8 0.86 (0.77–0.97) 1.04 (0.93–1.17) 0.95 (0.84–1.06)

Male

< 18.5 4,017 89 22.2 1.31 (1.06–1.63) 1.06 (0.85–1.31) 1.05 (0.84–1.30)

18.5–22.9 75,315 1,298 17.2 1.00 (Reference) 1.00 (Reference) 1.00 (Reference)

23.0–24.9 77,800 1,143 14.7 0.85 (0.78–0.92) 0.93 (0.86–1.01) 0.92 (0.85–1.00)

25.0–29.9 108,578 1,487 13.7 0.90 (0.84–0.97) 0.93 (0.86–1.00) 0.90 (0.84–0.97)

≥ 30.0 9,141 121 13.2 0.96 (0.80–1.15) 1.00 (0.83–1.20) 0.91 (0.75–1.10)

Female

< 18.5 2,586 57 22.0 1.33 (1.01–1.73) 1.07 (0.82–1.40) 1.18 (0.90–1.54)

18.5–22.9 51,217 865 16.9 1.00 (Reference) 1.00 (Reference) 1.00 (Reference)

23.0–24.9 50,024 754 15.1 0.89 (0.81–0.98) 0.92 (0.83–1.01) 0.89 (0.81–0.98)

25.0–29.9 79,887 1,326 16.6 0.98 (0.90–1.07) 1.02 (0.94–1.11) 0.96 (0.88–1.05)

≥ 30.0 13,836 220 15.9 0.94 (0.81–1.09) 1.09 (0.94–1.26) 0.99 (0.85–1.15)

*Adjusted for sex and age;

Adjusted for sex, age, systolic blood pressure, fasting glucose, total cholesterol, drinking status, smoking status, physical exercise, household income, use of anti-hypertensive drugs, use of statin drugs, use of anti-platelet drugs, and use of glucose-lowering drugs (metformin, sulfonylurea, insulin, and other glucose-lowering drugs).

HR, hazard ratio; PY, person-years; CI, confidence interval.

Figure 1. Cumulative incidence of major adverse cardiovascular events (A) and all-cause mortality (B) in people with diabetes by body mass index (BMI) categories.

60

30

0

Cumulative incidence (%)

2 4 6 8 10 Follow-up (yr)

Total

Log-rank test, P< 0.001

60

30

0 2 4 6 8 10

Follow-up (yr) Male

Log-rank test, P< 0.001

60

30

0 2 4 6 8 10

Follow-up (yr) Female

Log-rank test, P= 0.016

< 18.5 18.5–22.9 23.0–24.9 25.0–29.9

≥ 30.0 A

60

30

0

Cumulative incidence (%)

2 4 6 8 10 Follow-up (yr)

Total

Log-rank test, P< 0.001

60

30

0 2 4 6 8 10

Follow-up (yr) Male

Log-rank test, P< 0.001

60

30

0 2 4 6 8 10

Follow-up (yr) Female

Log-rank test, P< 0.001 B

< 18.5 18.5–22.9 23.0–24.9 25.0–29.9

≥ 30.0 BMI (kg/m

2

)

BMI (kg/m

2

)

(5)

significant after additional adjustments for comorbidities, except in obese class II people. When MACE occurring less than 3 years af- ter the index date were excluded, similar findings remained (over- weight: HR, 0.91; 95% CI, 0.85−0.98; obese class I: HR, 0.93; 95%

CI, 0.88−1.00) (data not shown). According to the sex-specific analysis, overweight and obese class I men had a significantly lower risk of MACE (overweight: HR, 0.92; 95% CI, 0.85−1.00; obese class I: HR, 0.90; 95% CI, 0.84−0.97). However, in women, only an overweight BMI was significantly associated with a lower risk of MACE (HR, 0.89; 95% CI, 0.81−0.98).

Table 3 shows all-cause mortality according to BMI group. In an unadjusted model, people with an underweight BMI had a signifi- cantly higher risk of all-cause mortality than did those with a nor- mal-weight BMI (HR, 2.56; 95% CI, 2.26–2.90). People with overweight and obese BMIs had a significantly lower risk of all- cause mortality (overweight: HR, 0.64; 95% CI, 0.60−0.69; obese class I: HR, 0.54; 95% CI, 0.51−0.58; obese class II: HR, 0.51;

95% CI, 0.44−0.59). This association remained significant after ad- ditional adjustments for confounders. In addition, when deaths oc- curring less than 3 years after the index date were excluded to mini- mize any effects of pre-existing disease on mortality, similar find-

ings remained (underweight: HR, 1.65; 95% CI, 1.43−1.90; over- weight: HR, 0.75; 95% CI, 0.70−0.81; obese I: HR, 0.69; 95% CI, 0.65−0.75; obese II: HR, 0.77; 95% CI, 0.66−0.90) (data not shown). However, in the sex-specific analysis, the lower risk of all- cause mortality in people categorized as obese class II remained significant in men (HR, 0.60; 95% CI, 0.48−0.76) but not in wom- en (HR, 0.90; 95% CI, 0.74−1.09).

According to the subgroup analyses by individual characteristics, the association of BMI with MACE and all-cause mortality did not differ by age, smoking, or hypertensive status. However, in people who use diabetes medication, underweight BMI was associated with a significantly higher risk of MACE (HR, 1.40; 95% CI, 1.10−1.78), whereas people not using diabetes medication had a lower, but not significant, risk of MACE (HR, 0.95; 95% CI, 0.75−1.19) (Fig. 2).

When classified by MACE subtype, underweight people had a higher risk of cardiovascular death (HR, 1.50; 95% CI, 1.09–2.06) and hospitalization for myocardial infarction (HR, 1.43; 95% CI, 1.06–1.94) than those classified as normal-weight. However, peo- ple classified as overweight and obese I had a lower risk of cardio- vascular death (overweight: HR, 0.80; 95% CI, 0.69–0.94; obese I:

Table 3. HRs for all-cause mortality in people with diabetes by body mass index categories Body mass index

(kg/m

2

) PY No. of events Event rate

(per 1,000 PY)

HR (95% CI)

Unadjusted Adjusted 1* Adjusted 2

Total

< 18.5 6,964 277 39.8 2.56 (2.26–2.90) 1.89 (1.67–2.14) 1.75 (1.54–1.99)

18.5–22.9 133,873 2,146 16.0 1.00 (Reference) 1.00 (Reference) 1.00 (Reference)

23.0–24.9 134,816 1,402 10.4 0.64 (0.60–0.69) 0.72 (0.67–0.77) 0.74 (0.69–0.79)

25.0–29.9 199,439 1,741 8.7 0.54 (0.51–0.58) 0.65 (0.61–0.69) 0.67 (0.63–0.71)

≥ 30.0 24,279 200 8.2 0.51 (0.44–0.59) 0.74 (0.64–0.86) 0.73 (0.63–0.85)

Male

< 18.5 4,220 192 45.5 2.50 (2.15–2.91) 1.88 (1.61–2.18) 1.67 (1.44–1.95)

18.5–22.9 79,570 1,496 18.8 1.00 (Reference) 1.00 (Reference) 1.00 (Reference)

23.0–24.9 81,844 943 11.5 0.61 (0.56–0.66) 0.69 (0.64–0.75) 0.72 (0.67–0.78)

25.0–29.9 114,309 1,039 9.1 0.48 (0.44–0.52) 0.60 (0.55–0.65) 0.63 (0.58–0.69)

≥ 30.0 9,614 74 7.7 0.41 (0.32–0.51) 0.59 (0.47–0.75) 0.60 (0.48–0.76)

Female

< 18.5 2,744 85 31.0 2.67 (2.13–3.35) 1.93 (1.54–2.42) 2.00 (1.59–2.51)

18.5–22.9 54,303 650 12.0 1.00 (Reference) 1.00 (Reference) 1.00 (Reference)

23.0–24.9 52,972 459 8.7 0.72 (0.64–0.81) 0.78 (0.69–0.88) 0.77 (0.69–0.87)

25.0–29.9 85,130 702 8.2 0.69 (0.62–0.76) 0.75 (0.68–0.84) 0.74 (0.66–0.83)

≥ 30.0 14,665 126 8.6 0.71 (0.59–0.86) 0.93 (0.76–1.12) 0.90 (0.74–1.09)

*Adjusted for sex and age;

Adjusted for sex, age, systolic blood pressure, fasting glucose, total cholesterol, drinking status, smoking status, physical exercise, household income, use of anti-hypertensive drugs, use of statin drugs, use of anti-platelet drugs, and use of glucose-lowering drugs (metformin, sulfonylurea, insulin, and other glucose-lowering drugs).

HR, hazard ratio; PY, person-years; CI, confidence interval.

(6)

A Major adverse cardiovascular events

Figure 2. Subgroup analyses of association of body mass index categories with major adverse cardiovascular events (A) and all-cause mortality (B). These analyses were adjusted to address potential confounding by sex, age, systolic blood pressure, fasting glucose, total cholesterol, drinking status, smoking status, physical exercise, house- hold income, use of anti-hypertensive drugs, use of statin drugs, use of anti-platelet drugs, and use of glucose-lowering drugs. PY, person-years; HR, hazard ratio; CI, confi- dence interval.

(Continued to the next page)

(7)

B All-cause mortality

Figure 2. Continued.

(8)

HR, 0.77; 95% CI, 0.67–0.89) and hospitalization for stroke (over- weight: HR, 0.92; 95% CI, 0.86–0.99; obese I: HR, 0.91; 95% CI, 0.85–0.97) (Supplementary Fig. 1).

DISCUSSION

In this analysis of nationwide follow-up data on Korean adults, overweight and obese people had a lower risk for MACE and all- cause mortality in people with diabetes. When classified by the specific subtype of MACE, underweight people had a higher risk for cardiovascular death and myocardial infarction than those with the normal-weight classification. However, overweight and obese people had a lower risk for cardiovascular death and stroke.

Previous studies reported that obesity had adverse effects on CVD. 7,9,15 In China, underweight BMI (< 18.5 kg/m 2 ) and obese BMI (≥ 25.0 kg/m 2 ) were associated with a higher risk of CVD in people with type 2 diabetes mellitus (T2DM). 7 In England, people classified as overweight or obese (BMI ≥ 25.0 kg/m 2 ) had a higher risk of cardiac events, including acute coronary syndrome and heart failure, than those of normal-weight (BMI 18.5−24.9 kg/m 2 ) in people with T2DM. 9 Overweight and obese (BMI ≥ 25.0 kg/

m 2 ) people had a higher risk of CVD compared with those classi- fied as normal-weight in the Swedish National Diabetes Register study. 15 Although overweight and obesity have adverse effects on CVDs, many studies suggest an obesity paradox in which over- weight and obese people have a better prognosis for CVD than un- derweight people. 16 The mechanisms for this paradox are unclear.

However, some characteristics of obese people, such as younger age, lower prevalence of smoking, and use of cardiac medications for high blood pressure, may explain a lower risk of CVD. 16 Our study also showed that obese people were younger-aged; had high- er blood pressure; were more likely to use medication such as an anti-hypertensive, statin, or anti-platelet; and were less likely to smoke. Thus, use of drugs and lifestyle modifications by obese people may affect the risk of MACE, although we controlled for these factors.

Several mechanisms may explain the observed higher risk for MACE associated with underweight BMI. First, increased fat, if properly distributed, can provide some benefits. Several studies have suggested that subcutaneous peripheral fat has a cardioprotec-

tive effect. 17-19 It may act as a “metabolic sink,” removing dietary tri- glycerides. 20,21 Second, muscle mass prevents insulin resistance and therefore has a protective effect in CVD. However, underweight people may have low muscle mass, as BMI is positively correlated with muscle mass, particularly in the elderly. 22 In this study, the un- derweight group was less physically active than the higher BMI groups. Third, genetic hypotheses can explain the advantages ob- served in the group categorized as obese. Underweight and normal- weight BMI people with diabetes may be genetically predisposed to a higher risk of cardiovascular events. 8

We found that the groups with an overweight and obese BMI had lower all-cause mortality than the normal-weight BMI group;

however, the highest mortality was in the underweight BMI group.

Conflicting results have been reported regarding obesity and all- cause mortality. In particular, a previous study reported improve- ments in the long-term outcomes of CVD in obese diabetic people after bariatric surgery. 23 However, the causes underlying the benefi- cial effects of bariatric surgery are not limited to weight reduction. 24 Additionally, the Look Action for Health in Diabetes trial, a multi- center randomized controlled trial, concluded that an intensive life- style intervention focused on weight loss improved glycemic con- trol but did not reduce the rate of cardiovascular events. 25 Addition- ally, Tobias et al. 12 suggested that the obesity paradox can be ex- plained by reverse causality or confounding factors; thus, restricting the analysis to people with incident diabetes and excluding people, such as smokers, those 65 years of age or older, and those with known illnesses at baseline, are imperative for reducing bias. How- ever, previous studies attempted to remove bias and found that the obesity paradox still existed among people with diabetes. 26,27 Al- though we did not consider important factors, such as the duration of diabetes or glycated hemoglobin levels, we also observed the obesity paradox after adjusting for confounding factors, such as sex, age, hypertension, and use of glucose-lowering drugs, using a strati- fication analysis.

This study had several limitations that should be addressed. First, the outcomes in this study were based on diagnoses obtained from health insurance claims data. Although previous validation studies for the identification of CVD events showed positive rates of 71.4%

for myocardial infarction and 83.4% for ischemic stroke, there were

potential disease misclassifications, biasing the observed difference-

(9)

in-difference estimate toward the null. 28,29 Additionally, due to inac- curacies in the diagnostic codes in the claims data, we included all types of diabetes mellitus in this study without distinguishing be- tween types. However, in Korea, type 1 diabetes mellitus accounts for approximately 0.02% of the entire population of Korea; there- fore, most data can be attributed to people with T2DM. 30 Finally, although statistical adjustments were performed, some important potential confounders (e.g., weight change, central obesity, dura- tion of diabetes, severity of diabetes) were not considered; thus, the possibility of residual confounding effects remains.

In conclusion, in people with diabetes, underweight people had a higher risk for all-cause mortality, whereas overweight or obese people had a lower risk for MACE and all-cause mortality than those of normal weight.

CONFLICTS OF INTEREST

The authors declare no conflict of interest.

ACKNOWLEDGMENTS

This study used NHIS data (NHIS-2017-2-544) made by the National Health Insurance Service (NHIS). The authors declare no conflict of interest with the NHIS. This research was supported by a grant from the Korea Health Technology R&D Project through the Korea Health Industry Development Institute (KHI- DI), funded by the Ministry of Health & Welfare, Republic of Ko- rea (grant No. HI13C0715). The funder did not play any role in the study design, data collection and analysis, decisions regarding data release, or manuscript preparation.

SUPPLEMENTARY MATERIALS

Supplementary Table 1. Baseline characteristics of the study par- ticipants by body mass index categories in male.

Supplementary Table 2. Baseline characteristics of the study par- ticipants by body mass index categories in female.

Supplementary Figure 1. The association of body mass index categories with subtypes of major adverse cardiovascular events in people with diabetes.

They can be found via https://doi.org/10.7570/jomes.2018.27.1.61.

REFERENCES

1. Tseng CH. Mortality and causes of death in a national sample of diabetic patients in Taiwan. Diabetes Care 2004;27:1605-9.

2. Bogers RP, Bemelmans WJ, Hoogenveen RT, Boshuizen HC, Woodward M, Knekt P, et al. Association of overweight with increased risk of coronary heart disease partly independent of blood pressure and cholesterol levels: a meta-analysis of 21 cohort studies including more than 300,000 persons. Arch In- tern Med 2007;167:1720-8.

3. Strazzullo P, D’Elia L, Cairella G, Garbagnati F, Cappuccio FP, Scalfi L. Excess body weight and incidence of stroke: meta- analysis of prospective studies with 2 million participants.

Stroke 2010;41:e418-26.

4. Czernichow S, Kengne AP, Huxley RR, Batty GD, de Galan B, Grobbee D, et al. Comparison of waist-to-hip ratio and other obesity indices as predictors of cardiovascular disease risk in people with type-2 diabetes: a prospective cohort study from ADVANCE. Eur J Cardiovasc Prev Rehabil 2011;18:312-9.

5. Li W, Katzmarzyk PT, Horswell R, Zhang Y, Wang Y, Johnson J, et al. Body mass index and heart failure among patients with type 2 diabetes mellitus. Circ Heart Fail 2015;8:455-63.

6. Li W, Katzmarzyk PT, Horswell R, Zhang Y, Zhao W, Wang Y, et al. Body mass index and stroke risk among patients with type 2 diabetes mellitus. Stroke 2015;46:164-9.

7. Wan EY, Fung CS, Fong DY, Chan AK, Lam CL. A curvilin- ear association of body mass index with cardiovascular diseas- es in Chinese patients with type 2 diabetes mellitus: a popula- tion-based retrospective cohort study. J Diabetes Complica- tions 2016;30:1261-8.

8. Carnethon MR, De Chavez PJ, Biggs ML, Lewis CE, Pankow JS, Bertoni AG, et al. Association of weight status with mortal- ity in adults with incident diabetes. JAMA 2012;308:581-90.

9. Costanzo P, Cleland JG, Pellicori P, Clark AL, Hepburn D, Kilpatrick ES, et al. The obesity paradox in type 2 diabetes mellitus: relationship of body mass index to prognosis. A co- hort study. Ann Intern Med 2015;162:610-8.

10. Jackson CL, Yeh HC, Szklo M, Hu FB, Wang NY, Dray-Spira

(10)

R, et al. Body-mass index and all-cause mortality in US adults with and without diabetes. J Gen Intern Med 2014;29:25-33.

11. Thomas G, Khunti K, Curcin V, Molokhia M, Millett C, Ma- jeed A, et al. Obesity paradox in people newly diagnosed with type 2 diabetes with and without prior cardiovascular disease.

Diabetes Obes Metab 2014;16:317-25.

12. Tobias DK, Pan A, Jackson CL, O’Reilly EJ, Ding EL, Willett WC, et al. Body-mass index and mortality among adults with incident type 2 diabetes. N Engl J Med 2014;370:233-44.

13. Seong SC, Kim YY, Park SK, Khang YH, Kim HC, Park JH, et al. Cohort profile: the National Health Insurance Service- National Health Screening Cohort (NHIS-HEALS) in Korea.

BMJ Open 2017;7:e016640.

14. World Health Organization; International Association for the Study of Obesity; International Obesity Task Force. The Asia- Pacific perspective: redefining obesity and its treatment. Syd- ney: Health Communications; 2000.

15. Eeg-Olofsson K, Cederholm J, Nilsson PM, Zethelius B, Nunez L, Gudbjörnsdóttir S, et al. Risk of cardiovascular dis- ease and mortality in overweight and obese patients with type 2 diabetes: an observational study in 13,087 patients. Diabeto- logia 2009;52:65-73.

16. Lavie CJ, McAuley PA, Church TS, Milani RV, Blair SN. Obe- sity and cardiovascular diseases: implications regarding fitness, fatness, and severity in the obesity paradox. J Am Coll Cardiol 2014;63:1345-54.

17. McLaughlin T, Lamendola C, Liu A, Abbasi F. Preferential fat deposition in subcutaneous versus visceral depots is associated with insulin sensitivity. J Clin Endocrinol Metab 2011;96:

E1756-60.

18. Neeland IJ, Turer AT, Ayers CR, Berry JD, Rohatgi A, Das SR, et al. Body fat distribution and incident cardiovascular disease in obese adults. J Am Coll Cardiol 2015;65:2150-1.

19. Tankó LB, Bagger YZ, Alexandersen P, Larsen PJ, Christian- sen C. Peripheral adiposity exhibits an independent dominant antiatherogenic effect in elderly women. Circulation 2003;107:

1626-31.

20. Lemieux I. Energy partitioning in gluteal-femoral fat: does the metabolic fate of triglycerides affect coronary heart disease risk? Arterioscler Thromb Vasc Biol 2004;24:795-7.

21. Manolopoulos KN, Karpe F, Frayn KN. Gluteofemoral body fat as a determinant of metabolic health. Int J Obes (Lond) 2010;34:949-59.

22. Yagi S, Kadota M, Aihara KI, Nishikawa K, Hara T, Ise T, et al. Association of lower limb muscle mass and energy expen- diture with visceral fat mass in healthy men. Diabetol Metab Syndr 2014;6:27.

23. Cefalu WT, Rubino F, Cummings DE. Metabolic surgery for type 2 diabetes: changing the landscape of diabetes care. Dia- betes Care 2016;39:857-60.

24. Eliasson B, Liakopoulos V, Franzén S, Näslund I, Svensson AM, Ottosson J, et al. Cardiovascular disease and mortality in patients with type 2 diabetes after bariatric surgery in Sweden:

a nationwide, matched, observational cohort study. Lancet Di- abetes Endocrinol 2015;3:847-54.

25. Look AHEAD Research Group, Wing RR, Bolin P, Brancati FL, Bray GA, Clark JM, et al. Cardiovascular effects of inten- sive lifestyle intervention in type 2 diabetes. N Engl J Med 2013;369:145-54.

26. Lee EY, Lee YH, Yi SW, Shin SA, Yi JJ. BMI and all-cause mortality in normoglycemia, impaired fasting glucose, newly diagnosed diabetes, and prevalent diabetes: a cohort study. Di- abetes Care 2017;40:1026-33.

27. Zhao W, Katzmarzyk PT, Horswell R, Wang Y, Li W, Johnson J, et al. Body mass index and the risk of all-cause mortality among patients with type 2 diabetes mellitus. Circulation 2014;130:2143-51.

28. Kimm H, Yun JE, Lee SH, Jang Y, Jee SH. Validity of the diag- nosis of acute myocardial infarction in Korean national medi- cal health insurance claims data: the Korean heart study (1).

Korean Circ J 2012;42:10-5.

29. Park JK, Kim KS, Kim CB, Lee TY, Lee KS, Lee DH, et al.

The accuracy of ICD codes for cerebrovascular diseases in medical insurance claims. Korean J Prev Med 2000;33:76-82.

30. Song SO, Song YD, Nam JY, Park KH, Yoon JH, Son KM, et al. Epidemiology of type 1 diabetes mellitus in Korea through an investigation of the national registration project of type 1 diabetes for the reimbursement of glucometer strips with ad- ditional analyses using claims data. Diabetes Metab J 2016;40:

35-45.

수치

Table 2 shows MACE risk by BMI group. In an unadjusted mod- mod-el, underweight BMI was associated with a significantly higher risk  of MACE (HR, 1.32; 95% CI, 1.11−1.56) compared to  normal-weight BMI
Table 2. HRs for major adverse cardiovascular events risk in people with diabetes by body mass index categories Body mass index
Table 3 shows all-cause mortality according to BMI group. In an  unadjusted model, people with an underweight BMI had a  signifi-cantly higher risk of all-cause mortality than did those with a  nor-mal-weight BMI (HR, 2.56; 95% CI, 2.26–2.90)
Figure 2. Subgroup analyses of association of body mass index categories with major adverse cardiovascular events (A) and all-cause mortality (B)
+2

참조

관련 문서

Participants were divided into 3 tertiles based on their ALM/Ht2, FM/Ht2, or body mass index (BMI) for both sexes: low, middle, and high tertiles.. The Framingham Risk

Diabetes Association (ADA) and the European Association for the Study of Diabetes (EASD) have suggested using continuous Metabolic Syndrome (cMetS) risk score for studies on

The present study investigated the association of the FTO rs9939609 genotypes, body mass index (BMI), and lifestyle-related factors including smoking, alcohol drinking,

Therefore, we investigated the association between migraine and major cardiovascular outcomes, including myocardial infarction (MI), ischemic stroke (IS), cardio-

The purpose of this study was to investigate associations between combinations of body mass index (BMI) cate- gories plus non-alcoholic fatty liver disease (NAFLD) and diabetes

The relationship between high-sensitivity C-reactive protein (hs-CRP) levels and major adverse cardiac event (MACE) were compared in 1,558 Korean patients with type 2 diabetes

Non-DM, control without diabetes; DM, type 2 diabetes group; GDF15, growth differentiation factor-15; BMI, body mass index; WC, waist circumference; TG, triglyceride; TC,

Therefore, we investigated whether experience of SH was as- sociated with an increased risk of CV mortality or death from any cause in Korean patients with type 2 diabetes using the