R E S E A R C H A R T I C L E
Open Access
Relationship between body mass index and
the expression of hormone receptors or
human epidermal growth factor receptor 2
with respect to breast cancer survival
Ye Won Jeon
1, Su Hwan Kang
2, Min Ho Park
3, Woosung Lim
4, Se Heun Cho
5and Young Jin Suh
1*Abstract
Background: The association between body mass index (BMI) at the time of breast cancer diagnosis and the prognosis of breast cancer patients remains controversial. Furthermore, the association between BMI and prognosis with respect to different breast cancer subtypes is not clearly defined.
Methods: We analyzed data from 41,021 invasive breast cancer patients between January 1988 and February 2008 from the Korean Breast Cancer Registry (KBCR) database. Overall survival (OS) and breast cancer-specific survival (BCSS) were analyzed using the Kaplan-Meier method and Cox’s proportional hazard regression model among all patients and specific breast cancer subtypes with respect to BMI categories.
Results: A U-shaped association between BMI and mortality was observed in the total cohort. Underweight and obese individuals exhibited worse OS (hazard ratio, 1.23 [95 % confidence interval {CI}, 1.05 to 1.44] and 1.29 [1.13 to 1.48], respectively) and BCSS (1.26 [1.03 to 1.54] and 1.21 [1.02 to 1.43], respectively) than normal-weight individuals. In the estrogen receptor (ER) and/or progesterone receptor (PR)+/human epidermal growth factor receptor 2 (HER2) - subgroup, obese individuals exhibited worse OS (1.48 [1.18 to 1.85]) and BCSS (1.31 [1.13 to 1.52]) than normal-weight individuals. Conversely, in the ER and PR-/HER2+ subgroup, underweight individuals exhibited worse OS (1.68 [1.12 to 2.47]) and BCSS (1.79 [1.11 to 2.90]) than normal-weight individuals.
Conclusions: We observed a U-shaped relationship between BMI at diagnosis and poor OS and BCSS among all breast cancer patients. However, obesity in the ER and/or PR+/HER2- subgroup and underweight in the ER and PR-/ HER2+ subgroup were poor prognostic factors. Therefore, BMI at diagnosis and breast cancer subtype should be considered simultaneously in various treatment decision processes and surveillance schedules.
Keywords: Breast neoplasms, Body mass index, Survival, Estrogen receptor, Progesterone receptor, Human epidermal growth factor receptor 2
Background
The association between body mass index (BMI) at the time of breast cancer diagnosis and the prognosis of breast cancer patients remains controversial despite many studies, including single institution, multi-center, and population-based studies, meta-analyses, and randomized
controlled trials [1–24]. In many studies, a high BMI at the time of breast cancer diagnosis has been identified as a negative prognostic factor [1–17]. However, several studies have suggested that a low BMI at the time of breast cancer diagnosis correlates with a negative progno-sis in breast cancer patients [18–20]. Some investigators have reported a weak or no relationship between BMI and prognosis in breast cancer patients [21–24].
Previous studies have not adequately demonstrated an association between BMI at the time of breast cancer diag-nosis and progdiag-nosis in breast cancer patients with respect * Correspondence:[email protected]
1Department of Surgery, St. Vincent’s Hospital, College of Medicine, The
Catholic University, 93 Joongboo-Daero Paldal-gu, Suwon 442-723, Kyunggi-do, Republic of Korea
Full list of author information is available at the end of the article
© 2015 Jeon et al. Open Access This article is distributed under the terms of the Creative Commons Attribution 4.0 International License (http://creativecommons.org/licenses/by/4.0/), which permits unrestricted use, distribution, and reproduction in any medium, provided you give appropriate credit to the original author(s) and the source, provide a link to the Creative Commons license, and indicate if changes were made. The Creative Commons Public Domain Dedication waiver (http://creativecommons.org/publicdomain/zero/1.0/) applies to the data made available in this article, unless otherwise stated.
to breast cancer subtypes. Recent advances in our under-standing of breast cancer biology based on molecular tech-niques allow us to divide breast cancer into at least four subtypes [25, 26]. These breast cancer subtypes exhibit dif-ferent prognoses according to the estrogen receptor (ER), progesterone receptor (PR) and human epidermal growth factor receptor 2 (HER2) expressions. Therefore, it is im-portant to understand the association between BMI and prognosis in the different breast cancer subtypes.
Moreover, there are certain differences between Asian and Western regions with respect to the prevalence of obesity. Although the prevalence of obesity is lower in Asians, the health risks associated with obesity occur at a lower BMI in Asian populations [27–29]. Therefore, an analysis of a large population-based cohort is needed to understand the prognostic significance of obesity in Asian breast cancer patients.
The aim of this study was to investigate the prognostic significance of BMI at the time of breast cancer diagnosis in all breast cancer patients and in each breast cancer sub-type by analyzing overall survival (OS) and breast cancer-specific survival (BCSS) using population-based data from the Korean Breast Cancer Registry (KBCR) database.
Methods
Korean breast cancer registry (KBCR)
The KBCR database is a web-based, prospectively main-tained nationwide database managed by the Korean Breast Cancer Society (KBCS). One hundred and two institutions have voluntarily participated in this registry since 1997. Be-fore inserting personal information along with various data-sets, written informed consent should be mandatory from the patient. From the initial conception of KBCR database, principal investigators from every single institution have agreed on the principles and process of utilizing this data-base for research purposes. After 2000, an online registra-tion program was implemented, and the database has been actively utilized for various research studies on breast cancer in Korea [18, 30]. Essential registry items include the patient’s unique Korean resident registration number, gen-der, age, the surgical method used, and cancer stage accord-ing to the seventh edition of American Joint Committee on Cancer classification [31]. Moreover, data on height, weight, biological status (such as ER, PR, HER2, p53, and Ki67 sta-tus), and adjuvant treatment (such as radiotherapy, chemo-therapy, and hormonal therapy) are collected as optional items within the KBCR database. The Korean Central Can-cer Registry provides mortality data only, and the KBCR does not include information on tumor recurrence.
According to the guidelines of utilizing KBCR database, this study was approved by the institutional Review Board (IRB) of St. Vincent’s Hospital, College of Medicine, The Catholic University, where the first author of this article is affiliated (VC14RISI0234).
Patients and follow-up
In this study, we selected and assessed invasive breast can-cer patients who underwent curative surgery between January 1988 and February 2008. To achieve a more accur-ate analysis, we excluded patients treaccur-ated with neoadjuvant therapy and patients for whom essential registry data (gen-der, age, height, weight and cancer stage) and ER/PR status were not available. Patients with distant metastasis at the time of diagnosis were excluded, because distant metastasis is the worst prognostic factor compared with other prog-nostic factors (such as age, tumor size, histologic grade, lymph node status, adjuvant treatment, BMI, hormone re-ceptor status and HER2 expression) and serves as con-founding factor for survival analysis.
The data on the remaining 41,021 patients were included in the final analysis.
All patients were categorized into five subgroups ac-cording to the expression of ER, PR and HER2 as follows: (a) ER and/or PR+/HER2-; (b) ER and/or PR+/HER2+; (c) ER and PR-/HER2+; (d) ER and PR-/HER2-; and (e) un-known. All patients for whom ER/PR expression but not HER2 expression information was available were catego-rized into the unknown group.
Positive staining for ER or PR was defined as the positive staining of ≥10 % nuclei in ten high-power fields, and HER2 positivity was defined as 3+ immunohistochemical (IHC) staining or HER2 gene amplification by fluorescence in situ hybridization (FISH). Cases of 2+ HER2 by IHC without a FISH result were treated as HER2-negative.
Patient survival data, including the date and cause of death, were obtained from the Korean Central Cancer Registry, Ministry of Health and Welfare, Korea.
Statistical analysis
BMI was calculated by dividing weight (kg) by height (m) squared. The BMI at diagnosis was categorized as normal BMI (18.5 - 24.9 kg/m2), underweight BMI (<18.5 kg/m2),
overweight BMI (25.0 – 29.9 kg/m2) and obese BMI
(≥30 kg/m2
) according to the guidelines of the World Health Organization (WHO) [32].
The patient characteristics were compared with respect to BMI category (underweight, normal weight, overweight and obese) using the chi-square test. The chi-square test and analysis of variance (ANOVA) were used to determine differences in the clinicopathological features between groups. With respect to survival analyses, we explored OS and BCSS using data from the KBCR database. OS was defined as the time from the initial diagnosis of primary breast cancer to death from any cause. BCSS was defined as survival until death from breast cancer. Survival curves were estimated using the Kaplan-Meier method. Log-rank tests were performed for the comparison of survival curves. Multivariate analyses were conducted using Cox’s proportional-hazard regression models to study the effect
of BMI at diagnosis on OS and BCSS. The parameters in-cluded in the multivariate analysis model were as follows: patient age; tumor size; histologic grade; lymph node sta-tus; operation method; adjuvant treatment; ER/PR status and HER2 expression. A p value of less than 0.05 was considered significant. All statistical analyses were per-formed using the SAS software for Windows (release 9.2; SAS Institute, Cary, NC, USA).
Results
Patient characteristics
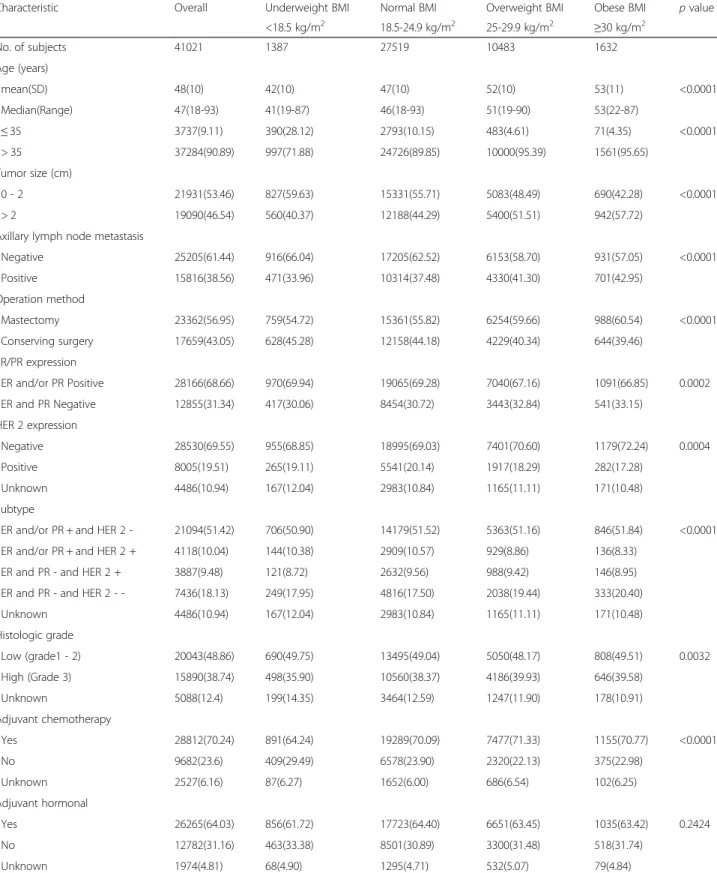
For the 41,021 patients included in our analysis, the mean age at breast cancer diagnosis was 48 years (range, 18 to 93). The baseline characteristics are presented in Table 1, stratified according to BMI categories. The BMI categories revealed a significant association with known breast cancer prognostic factors. The median age at diagnosis for obese patients was significantly older than underweight patients (p < 0.001). Obese patients had larger tumors (p < 0.001), high frequencies of axillary lymph node metastasis (p < 0.001), histologically high-grade lesions (p = 0.003), and negative ER and PR (p = 0.002) and HER2 expression (p = 0.004) compared with underweight patients.
Breast cancer subgroups categorized according to the expression of ER, PR and HER2 exhibited a significant as-sociation with BMI categories (p < 0.001). The ER and/or PR+/HER2- and ER and PR-/HER2- subtypes were more prevalent in the obese BMI category. However, the ER and/or PR+/HER2+ subtype was more prevalent in the underweight BMI category.
Overall survival and breast cancer-specific survival
A total of 4468 deaths from any cause and 2824 deaths from breast cancer were observed over a median follow-up time of 92 months after diagnosis, with a maximum follow-up of 300 months.
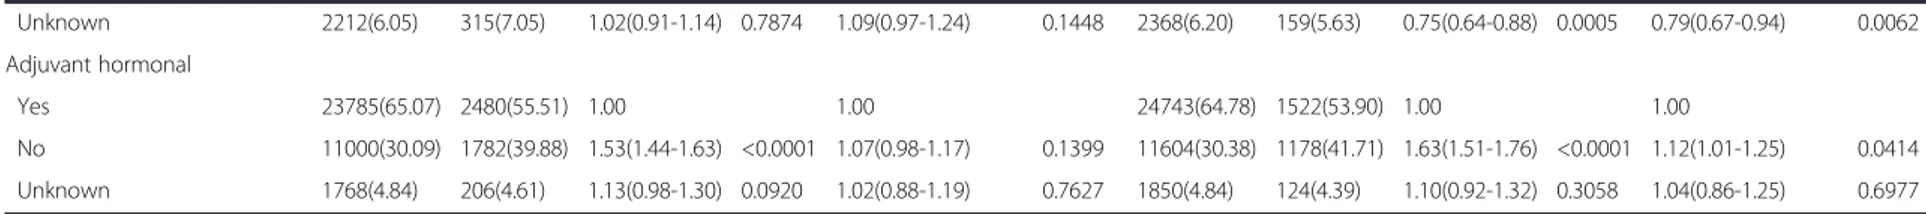
After adjusting for poor prognostic factors, such as tumor size, axillary lymph node metastasis, histologic grade, ER, PR and HER2 expression, a U-shaped asso-ciation between BMI and mortality was observed in the total cohort (Table 2). Compared with patients in the normal BMI category, those in the underweight BMI category exhibited significantly worse OS (adjusted hazard ratio [HR] 1.23, 95 % confidence interval [CI] 1.05 to 1.44, p = 0.0118), as did those in the obese BMI category (ad-justed HR 1.29, 95 % CI 1.13 to 1.48,p = 0.0002). Patients in the underweight BMI category (adjusted HR 1.26, 95 % CI 1.03 to 1.54, p = 0.0219) and the obese BMI category (adjusted HR 1.21, 95 % CI 1.02 to 1.43,p = 0.0321) exhib-ited significantly worse BCSS compared with those in the normal BMI category.
In the ER and/or PR+/HER2- subgroup, patients in the obese BMI category exhibited significantly worse
OS (adjusted HR 1.48, 95 % CI 1.18 to 1.85,p = 0.0006) and BCSS (adjusted HR 1.31, 95 % CI 1.13 to 1.52,p = 0.0003) compared with those in the normal BMI category (Table 3). However, no significant difference was observed in the OS (p = 0.1269) and BCSS (p = 0.2684) rate between patients in the normal BMI category and the underweight BMI cat-egory. Conversely, in the ER and PR-/HER2+ subgroup, patients in the underweight BMI category exhibited signifi-cantly worse OS (adjusted HR 1.67, 95 % CI 1.12 to
2.47, p = 0.0113) and BCSS (adjusted HR 1.79, 95 %
CI 1.11 to 2.90, p = 0.0179) compared with those in the normal BMI category. However, obese BMI was not associated with decreased OS (p = 0.4247) or BCSS (p = 0.5683) in the ER and PR-/HER2+ subgroup. In the ER and/or PR+/HER2+ and ER and PR-/HER2- sub-groups, BMI categories did not exhibit a significant association with OS and BCSS. In the unknown sub-group, patients in the obese BMI category exhibited significantly worse OS (adjusted HR 1.36, 95 % CI
1.04 to 1.79, p = 0.0261) but not worse BCSS
(ad-justed HR 1.36, 95 % CI 0.97 to 1.90, p = 0.0747)
compared with those in the normal BMI category.
Discussion
In our total cohort analysis, underweight and obese breast cancer patients exhibited significantly poorer OS and BCSS compared with normal BMI category breast cancer patients, suggesting a U-shaped relationship, as has been previously suggested [7, 13, 14, 17]. This is the largest study to suggest that breast cancer patients with a normal BMI range at diagnosis exhibit the most favorable breast cancer outcomes.
Similar to our finding, a previous study using the KBCR database demonstrated that underweight BMI is an inde-pendent negative prognostic factor for OS and BCSS after adjustment. However, in a previous study, neither obese patients nor overweight patients exhibited significant dif-ferences in OS and BCSS compared with normal-weight patients [18]. Two studies using the KBCR database re-ported different results for the prognostic significance of obesity in breast cancer patients. A potential explanation for the differing results is that more recent breast cancer patients (between 2007 and 2008) were included our study. Because an increase in overweight BMI and obesity has been noted in South Korean adults [33], our study, which included more recent breast cancer patients, may provide a more accurate analysis of the prognostic signifi-cance of obesity in Korean breast signifi-cancer patients.
This study is the first to further explore results with respect to both BMI at diagnosis and the four breast cancer subtypes, enabling better identification of women at highest risk of poor outcomes.
In the ER and/or PR+/HER2- subgroup, obese breast cancer patients exhibited significantly worse OS and BCSS
compared with normal and underweight BMI breast cancer patients. Previous studies have demonstrated that obesity is associated with an increase in OS or
BCSS in patients with ER and/or PR positive breast cancer but is not in patients with ER and PR negative breast cancer [1, 4, 10, 11, 14]. Several hypotheses may
Table 1 General characteristics of KBCS breast cancer subjects, overall and by BMI categories
Characteristic Overall Underweight BMI Normal BMI Overweight BMI Obese BMI p value
<18.5 kg/m2 18.5-24.9 kg/m2 25-29.9 kg/m2 ≥30 kg/m2 No. of subjects 41021 1387 27519 10483 1632 Age (years) mean(SD) 48(10) 42(10) 47(10) 52(10) 53(11) <0.0001 Median(Range) 47(18-93) 41(19-87) 46(18-93) 51(19-90) 53(22-87) ≤ 35 3737(9.11) 390(28.12) 2793(10.15) 483(4.61) 71(4.35) <0.0001 > 35 37284(90.89) 997(71.88) 24726(89.85) 10000(95.39) 1561(95.65) Tumor size (cm) 0 - 2 21931(53.46) 827(59.63) 15331(55.71) 5083(48.49) 690(42.28) <0.0001 > 2 19090(46.54) 560(40.37) 12188(44.29) 5400(51.51) 942(57.72)
Axillary lymph node metastasis
Negative 25205(61.44) 916(66.04) 17205(62.52) 6153(58.70) 931(57.05) <0.0001 Positive 15816(38.56) 471(33.96) 10314(37.48) 4330(41.30) 701(42.95) Operation method Mastectomy 23362(56.95) 759(54.72) 15361(55.82) 6254(59.66) 988(60.54) <0.0001 Conserving surgery 17659(43.05) 628(45.28) 12158(44.18) 4229(40.34) 644(39.46) ER/PR expression ER and/or PR Positive 28166(68.66) 970(69.94) 19065(69.28) 7040(67.16) 1091(66.85) 0.0002 ER and PR Negative 12855(31.34) 417(30.06) 8454(30.72) 3443(32.84) 541(33.15) HER 2 expression Negative 28530(69.55) 955(68.85) 18995(69.03) 7401(70.60) 1179(72.24) 0.0004 Positive 8005(19.51) 265(19.11) 5541(20.14) 1917(18.29) 282(17.28) Unknown 4486(10.94) 167(12.04) 2983(10.84) 1165(11.11) 171(10.48) Subtype
ER and/or PR + and HER 2 - 21094(51.42) 706(50.90) 14179(51.52) 5363(51.16) 846(51.84) <0.0001
ER and/or PR + and HER 2 + 4118(10.04) 144(10.38) 2909(10.57) 929(8.86) 136(8.33)
ER and PR - and HER 2 + 3887(9.48) 121(8.72) 2632(9.56) 988(9.42) 146(8.95)
ER and PR - and HER 2 - - 7436(18.13) 249(17.95) 4816(17.50) 2038(19.44) 333(20.40)
Unknown 4486(10.94) 167(12.04) 2983(10.84) 1165(11.11) 171(10.48) Histologic grade Low (grade1 - 2) 20043(48.86) 690(49.75) 13495(49.04) 5050(48.17) 808(49.51) 0.0032 High (Grade 3) 15890(38.74) 498(35.90) 10560(38.37) 4186(39.93) 646(39.58) Unknown 5088(12.4) 199(14.35) 3464(12.59) 1247(11.90) 178(10.91) Adjuvant chemotherapy Yes 28812(70.24) 891(64.24) 19289(70.09) 7477(71.33) 1155(70.77) <0.0001 No 9682(23.6) 409(29.49) 6578(23.90) 2320(22.13) 375(22.98) Unknown 2527(6.16) 87(6.27) 1652(6.00) 686(6.54) 102(6.25) Adjuvant hormonal Yes 26265(64.03) 856(61.72) 17723(64.40) 6651(63.45) 1035(63.42) 0.2424 No 12782(31.16) 463(33.38) 8501(30.89) 3300(31.48) 518(31.74) Unknown 1974(4.81) 68(4.90) 1295(4.71) 532(5.07) 79(4.84)
Age (years) ≤ 35 3330(9.11) 407(9.11) 1.00 3479(9.11) 258(9.14) 1.00 > 35 33223(90.89) 4061(90.89) 1.04(0.94-1.15) 0.4945 34718(90.89) 2566(90.86) 1.03(0.91-1.17) 0.6453 Tumor size (cm) 0 - 2 20608(56.38) 1323(29.61) 1.00 1.00 21185(55.46) 746(26.42) 1.00 1.00 > 2 15945(43.62) 3145(70.39) 2.74(2.57-2.92) <0.0001 1.70(1.58-1.82) <0.0001 17012(44.54) 2078(73.58) 3.16(2.91-3.44) <0.0001 1.77(1.61-1.93) <0.0001 Axillary lymph node metastasis
Negative 23731(64.92) 1474(32.99) 1.00 1.00 24439(63.98) 766(27.12) 1.00 1.00 Positive 12822(35.08) 2994(67.01) 3.43(3.22-3.65) <0.0001 2.95(2.75-3.16) <0.0001 13758(36.02) 2058(72.88) 4.42(4.07-4.80) <0.0001 3.50(3.20-3.84) <0.0001 Operation method Mastectomy 19830(54.25) 3532(79.05) 1.00 1.00 21094(55.22) 2268(80.31) 1.00 1.00 Conserving surgery 16723(45.75) 936(20.95) 0.37(0.34-0.39) <0.0001 0.55(0.51-0.59) <0.0001 17103(44.78) 556(19.69) 0.34(0.31-0.37) <0.0001 0.55(0.50-0.61) <0.0001 ER/PR expression ER and/or PR Positive 25647(70.16) 2519(56.38) 1.00 1.00 26629(69.71) 1537(54.43) 1.00 1.00 ER and PR Negative 10906(29.84) 1949(43.62) 1.75(1.65-1.86) <0.0001 1.55(1.42-1.70) <0.0001 11568(30.29) 1287(45.57) 1.87(1.73-2.01) <0.0001 1.56(1.40-1.74) <0.0001 HER 2 expression Negative 26098(71.40) 2432(54.43) 1.00 1.00 27018(70.73) 1512(53.54) 1.00 1.00 Positive 7040(19.26) 965(21.59) 1.42(1.32-1.53) <0.0001 1.11(1.03-1.20) 0.0061 7402(19.38) 603(21.35) 1.41(1.29-1.55) <0.0001 1.08(0.98-1.19) 0.1128 Unknown 3415(9.34) 1071(23.97) 2.23(2.07-2.41) <0.0001 1.70(1.58-1.84) <0.0001 3777(9.89) 709(25.10) 2.45(2.23-2.68) <0.0001 1.91(1.74-2.11) <0.0001 BMI calssification Underweight BMI 1229(3.36) 158(3.54) 1.16(0.98-1.36) 0.0784 1.23(1.05-1.44) 0.0118 1284(3.36) 103(3.65) 1.18(0.97-1.44) 0.0974 1.26(1.03-1.54) 0.0219 Normal BMI 24766(67.75) 2753(61.62) 1.00 1.00 25774(67.48) 1745(61.79) 1.00 1.00 Overweight BMI 9164(25.07) 1319(29.52) 1.26(1.18-1.35) <0.0001 1.15(1.07-1.23) <0.0001 9651(25.27) 832(29.46) 1.25(1.15-1.36) <0.0001 1.13(1.04-1.22) 0.0052 Obese BMI 1394(3.81) 238(5.33) 1.51(1.32-1.72) <0.0001 1.29(1.13-1.48) 0.0002 1488(3.90) 144(5.10) 1.42(1.19-1.68) <0.0001 1.21(1.02-1.43) 0.0321 Histologic grade Low (grade1 - 2) 18316(50.11) 1727(38.65) 1.00 1.00 19002(49.75) 1041(36.86) 1.00 1.00 High (Grade 3) 13631(37.29) 2259(50.56) 1.73(1.62-1.84) <0.0001 1.32(1.23-1.41) <0.0001 14401(37.70) 1489(52.73) 1.86(1.72-2.02) <0.0001 1.36(1.25-1.48) <0.0001 Unknown 4606(12.60) 482(10.79) 1.02(0.92-1.13) 0.6849 1.04(0.94-1.15) 0.494 4794(12.55) 294(10.41) 1.04(0.92-1.19) 0.5269 1.08(0.95-1.23) 0.2561 Adjuvant chemotherapy Yes 25339(69.32) 3473(77.73) 1.00 1.00 26475(69.31) 2337(82.75) 1.00 1.00 No 9002(24.63) 680(15.22) 0.58(0.53-0.63) <0.0001 1.41(1.29-1.55) <0.0001 9354(24.49) 328(11.61) 0.42(0.37-0.47) <0.0001 1.12(0.99-1.28) 0.0753 Cancer (2015) 15:865 Page 5 of 9
Table 2 Cox’s proportional hazard regression model for overall survival (OS) and breast cancer specific survival (BCSS) (Continued) Unknown 2212(6.05) 315(7.05) 1.02(0.91-1.14) 0.7874 1.09(0.97-1.24) 0.1448 2368(6.20) 159(5.63) 0.75(0.64-0.88) 0.0005 0.79(0.67-0.94) 0.0062 Adjuvant hormonal Yes 23785(65.07) 2480(55.51) 1.00 1.00 24743(64.78) 1522(53.90) 1.00 1.00 No 11000(30.09) 1782(39.88) 1.53(1.44-1.63) <0.0001 1.07(0.98-1.17) 0.1399 11604(30.38) 1178(41.71) 1.63(1.51-1.76) <0.0001 1.12(1.01-1.25) 0.0414 Unknown 1768(4.84) 206(4.61) 1.13(0.98-1.30) 0.0920 1.02(0.88-1.19) 0.7627 1850(4.84) 124(4.39) 1.10(0.92-1.32) 0.3058 1.04(0.86-1.25) 0.6977
Abbreviations:OS overall survival, BCSS breast cancer specific survival, HR hazard ratio Data presented as n (%) and HR (95 % CI)
HRs are unadjusted or adjusted based on Cox’s proportional-hazard regression models
Patient age; tumor size; histologic grade; lymph node status; operation method; adjuvant treatment; ER/PR status and HER2 expression included in the multivariate analysis model
Jeon et al. BMC Cancer (2015) 15:865 Page 6 of 9
ER and/or PR + and HER 2 -No. of participants 19674 1420 20248 846 Underweight BMI 659(3.35) 47(3.31) 1.17(0.87-1.57) 0.2902 1.26(0.94-1.69) 0.1269 678(3.35) 28(3.31) 1.17(0.80-1.71) 0.4239 1.24(0.85-1.82) 0.2684 Normal BMI 13352(67.87) 827(58.24) 1.00 1.00 13686(67.59) 493(58.27) 1.00 1.00 Overweight BMI 4901(24.91) 462(32.54) 1.48(1.32-1.66) <0.0001 1.32(1.18-1.48) <0.0001 5084(25.11) 279(32.98) 1.49(1.29-1.73) 0.0035 1.30(0.96-1.76) 0.0874 Obese BMI 762(3.87) 84(5.92) 1.74(1.39-2.18) <0.0001 1.48(1.18-1.85) 0.0006 800(3.95) 46(5.44) 1.57(1.16-2.12) <0.0001 1.31(1.13-1.52) 0.0003 ER and/or PR + and HER 2 +
No. of participants 3691 427 3851 267
Underweight BMI 130(3.52) 14(3.28) 0.95(0.56-1.62) 0.8463 1.07(0.63-1.83) 0.802 139(3.61) 5(1.87) 0.54(0.22-1.31) 0.1737 0.61(0.25-1.48) 0.2705 Normal BMI 2612(70.77) 297(69.56) 1.00 1.00 2726(70.79) 183(68.54) 1.00 1.00
Overweight BMI 827(22.41) 102(23.89) 1.06(0.85-1.33) 0.5960 1.02(0.81-1.28) 0.875 856(22.23) 73(27.34) 1.24(0.95-1.63) 0.1177 1.18(0.90-1.55) 0.2251 Obese BMI 122(3.31) 14(3.28) 1.05(0.61-1.79) 0.8608 0.94(0.55-1.61) 0.8193 130(3.38) 6(2.25) 0.72(0.32-1.62) 0.4277 0.62(0.27-1.39) 0.2449 ER and PR - and HER 2 +
No. of participants 3349 538 3551 336
Underweight BMI 94(2.81) 27(5.02) 1.79(1.21-2.65) 0.0034 1.67(1.12-2.47) 0.0113 103(2.90) 18(5.36) 1.88(1.16-3.05) 0.0099 1.79(1.11-2.90) 0.0179 Normal BMI 2288(68.32) 344(63.94) 1.00 1.00 2418(68.09) 214(63.69) 1.00 1.00
Overweight BMI 847(25.29) 141(26.21) 1.09(0.90-1.33) 0.3926 0.94(0.77-1.14) 0.5093 900(25.34) 88(26.19) 1.09(0.85-1.40) 0.4921 0.93(0.73-1.19) 0.5715 Obese BMI 120(3.58) 26(4.83) 1.38(0.93-2.06) 0.1132 1.18(0.79-1.76) 0.4247 130(3.66) 16(4.76) 1.35(0.81-2.24) 0.2496 1.16(0.70-1.93) 0.5683 ER and PR and HER 2
-No. of participants 6424 1012 6770 666 Underweight BMI 215(3.35) 34(3.36) 1.09(0.77-1.54) 0.6222 1.19(0.84-1.68) 0.3333 225(3.32) 24(3.60) 1.14(0.76-1.72) 0.5347 1.27(0.84-1.92) 0.2606 Normal BMI 4206(65.47) 610(60.28) 1.00 1.00 4402(65.02) 414(62.16) 1.00 1.00 Overweight BMI 1727(26.88) 311(30.73) 1.20(1.05-1.38) 0.0080 1.07(0.93-1.23) 0.3301 1849(27.31) 189(28.38) 1.07(0.90-1.27) 0.4398 0.93(0.79-1.11) 0.4320 Obese BMI 276(4.30) 57(5.63) 1.37(1.04-1.80) 0.0234 1.18(0.90-1.55) 0.2395 294(4.34) 39(5.86) 1.38(0.99-1.91) 0.0571 1.16(0.84-1.61) 0.3749 Unknown No. of participants 3415 1071 3777 709 Underweight BMI 131(3.84) 36(3.36) 0.98(0.70-1.37) 0.8923 1.11(0.79-1.55) 0.5528 139(3.68) 28(3.95) 1.16(0.79-1.70) 0.44 1.29(0.87-1.89) 0.2010 Normal BMI 2308(67.58) 675(63.03) 1.00 1.00 2542(67.30) 441(62.20) 1.00 1.00 Overweight BMI 862(25.24) 303(28.29) 1.18(1.03-1.35) 0.0153 1.12(0.98-1.28) 0.1042 962(25.47) 203(28.63) 1.20(1.02-1.42) 0.0283 1.15(0.97-1.36) 0.1030 Obese BMI 114(3.34) 57(5.32) 1.61(1.23-2.11) 0.0005 1.36(1.04-1.79) 0.0261 134(3.55) 37(5.22) 1.56(1.11-2.18) 0.0099 1.36(0.97-1.90) 0.0747
Abbreviations:OS overall survival, BCSS breast cancer specific survival, HR hazard ratio Data presented as n (%) and HR (95 % CI)
HRs are unadjusted or adjusted based on Cox’s proportional-hazard regression models
Patient age; tumor size; histologic grade; lymph node status; operation method; adjuvant treatment; ER/PR status and HER2 expression included in the multivariate analysis model
Cancer (2015) 15:865 Page 7 of 9
explain why obese patients with HR-positive breast cancer exhibit worse survival [8, 34–36]. Obesity is related to the increased peripheral conversion of androgenic pre-cursors to estradiol due to increased aromatase enzyme activity from large amounts of adipose tissue and is also related to decreased sex hormone-binding globulin [8, 34]. Additionally, obesity can increase insulin and insulin-like growth factors and obesity-related regulatory proteins, such as leptin and adiponectin [35, 36]. As a result, high circulating bioavailable estrogen, growth factors and regu-latory proteins could have a carcinogenic effect, promot-ing tumor growth and progression, in breast cancer cells expressing the estrogen receptor.
In contrast to the ER and/or PR+/HER2- subgroup, underweight breast cancer patients exhibit significantly worse OS and BCSS compared with normal and obese BMI category breast cancer patients in the ER and PR-/ HER2+ subgroup. Recently, two studies evaluated the correlation between BMI and disease-free survival in HER2-positive breast cancer patients [11, 37]. One study reported that obesity decreases survival compared with normal weight [11], but the second study reported con-flicting results [37]. Because these studies were analyzed only in the context of obese versus non-obese HER2-positive patients, including ER and/or PR HER2-positive and ER and PR negative breast cancer patients in the small sample size, these studies have not demonstrated whether an underweight BMI is associated with an increased risk of mortality relative to normal weight in the ER and PR-/ HER2+ subgroup. The relationship between underweight BMI and decreased survival might be at least partly ex-plained by the presence of circulating tumor cells (CTCs) in the peripheral blood of breast cancer patients. CTCs that have detached from the primary tumor site may reach a secondary organ and lead to metastases [38]. Further-more, alterations of the circulating immune cells may influence tumor progression and the efficacy of systemic antitumor treatments. Chronic undernutrition and micro-nutrient deficiency compromise the cytokine response and affect immune cell trafficking, which might affect the tumor-immune system interaction in other organs [39].
In the ER and/or PR+/HER2+ and ER and PR-/ HER2- subgroups, BMI categories did not exhibit a significant association with OS and BCSS. Similar to our finding, one study reported that obesity was not associated with decreased survival in patients with triple-negative breast cancer [40]. Because the impact on BMI and breast cancer outcomes was masked by the effect of the ER and/or PR+/HER2- and ER and PR-/HER2+ subgroups, a weaker association between BMI and poor outcomes may exist in patients in the ER and/or PR+/HER2+ and ER and PR-/HER2- subgroup.
Our study has several strengths and limitations. The main strength of our study is its inclusion of a large sample
(4468 deaths from any cause, 2824 deaths from breast can-cer among 41,021 breast cancan-cer patients), permitting a de-tailed examination across multiple BMI categories during the long follow-up period. Furthermore, our study is the first to investigate the prognostic significance of BMI in four different breast cancer subtypes. However, our study was limited by the information available in the KBCR data-base. First, registered patients in the KBCR database were heterogeneous with respect to breast cancer stage, IHC staining results, and presence of comorbidities. Addition-ally, the essential registry data (BMI and HR expression) were only available for 62.84 % of invasive breast cancer patients in the KBCR database. Therefore, the possibility of selection bias remains. Second, although total sample size is larger compared with previous studies, the sample size of underweight and obese BMI subjects is small to draw a conclusion on the independent effect of BMI. Finally, the ethnic homogeneity of the KBCR database may limit the generalizability of our finding to other racial and ethnic groups.
Conclusions
In conclusion, our results indicated a U-shaped relation-ship between BMI at diagnosis and poor OS and BCSS among all breast cancer patients, with the lowest risk ob-served among breast cancer patients with normal BMIs (18.5 - 24.9 kg/m2). Among breast cancer patients with ER and/or PR+/HER2- tumors, obese individuals exhibit sig-nificantly poorer OS and BCSS, whereas among those with ER and PR-/HER2+ tumors, underweight patients exhibit significantly poorer OS and BCSS compared with breast cancer patients with normal BMIs. Although obes-ity and underweight BMI at diagnosis are poor prognostic factors in pooled breast cancer samples, BMI at diagnosis exhibited a different impact on breast cancer prognosis in specific breast cancer subtypes. Therefore, BMI at diagno-sis and breast cancer subtype should be considered simul-taneously in various treatment decision processes and surveillance schedules.
Abbreviations
HR:Hormone receptor; HER2: Human epidermal growth factor receptor 2; OS: Overall survival; BCSS: Breast cancer-specific survival; ER: Estrogen receptor; PR: Progesterone receptor; IHC: Immunohistochemistry; FISH: Fluorescence in situ hybridization; HR: Hazard ratio; CI: Confidence interval.
Competing interests
The authors declare that they have no competing interests.
Authors’ contributions
YW Jeon, YJ Suh participated in the design of the study. YW Jeon, YJ Suh participated in the statistical analysis and interpretation of the data. YJ Suh has been involved in revising it critically for important intellectual content. YW Jeon drafted the manuscript. YW Jeon, SH Kang, MH park, WS Lim, SH Cho and YJ Suh participated in the collection of the data. All authors read and approved the final manuscript.
Acknowledgements
Statistical analysis support was provided by the Catholic Research Coordinating Center of the Korea Health 21 R&D Project (A070001), Ministry of Health & Welfare, Republic of Korea.
No funds were received in support of this study. Author details
1
Department of Surgery, St. Vincent’s Hospital, College of Medicine, The Catholic University, 93 Joongboo-Daero Paldal-gu, Suwon 442-723, Kyunggi-do, Republic of Korea.2Department of Surgery, Yeungnam University College of Medicine, 170 Hyunchung-ro, Nam-gu, Deagu 705-703, Republic of Korea.3Department of Surgery, Chonnam National University Medical School, 160 Baekseo-ro, Dong-gu, Gwangju 501-746, Republic of Korea.4Department of Surgery, Ewha Womans University, Mokdong hospital, 1071, Anyangcheon-ro, Yangcheon-gu, Seoul 158-710, Republic of Korea.
5
Department of Surgery, Dong-A University College of Medicine, 26, Daesingongwon-ro, Seo-gu, Busan 602-715, Republic of Korea.
Received: 14 October 2014 Accepted: 30 October 2015
References
1. Chang S, Alderfer JR, Asmar L, Buzdar AU. Inflammatory breast cancer survival: the role of obesity and menopausal status at diagnosis. Breast Cancer Res Treat. 2000;64:157–63.
2. Berclaz G, Li S, Price KN, Coates AS, Castiglione-Gertsch M, Rudenstam CM, et al. Body mass index as a prognostic feature in operable breast cancer: the International Breast Cancer Study Group experience. Ann Oncol. 2004;15:875–84.
3. Loi S, Milne RL, Friedlander ML, McCredie MR, Giles GG, Hopper JL, et al. Obesity and outcomes in premenopausal and postmenopausal breast cancer. Cancer Epidemiol Biomarkers Prev. 2005;14:1686–91.
4. Dignam JJ, Wieand K, Johnson KA, Raich P, Anderson SJ, Somkin C, et al. Effects of obesity and race on prognosis in lymph node-negative, estrogen receptor-negative breast cancer. Breast Cancer Res Treat. 2006;97:245–54. 5. Demirkan B, Alacacioglu A, Yilmaz U. Relation of body mass index (BMI) to
disease free (DFS) and distant disease free survivals (DDFS) among Turkish women with operable breast carcinoma. Jpn J Clin Oncol. 2007;37:256–65. 6. Vitolins MZ, Kimmick GG, Case LD. BMI influences prognosis following
surgery and adjuvant chemotherapy for lymph node positive breast cancer. Breast J. 2008;14:357–65.
7. Caan BJ, Kwan ML, Hartzell G, Castillo A, Slattery ML, Sternfeld B, et al. Pre-diagnosis body mass index, post-diagnosis weight change, and prognosis among women with early stage breast cancer. Cancer Causes Control. 2008;19:1319–28.
8. de Azambuja E, McCaskill-Stevens W, Francis P, Quinaux E, Crown JP, Vicente M, et al. The effect of body mass index on overall and disease-free survival in node-positive breast cancer patients treated with docetaxel and doxorubicin-containing adjuvant chemotherapy: the experience of the BIG 02-98 trial. Breast Cancer Res Treat. 2010;119:145–53.
9. Chen X, Lu W, Zheng W, Gu K, Chen Z, Zheng Y, et al. Obesity and weight change in relation to breast cancer survival. Breast Cancer Res Treat. 2010;122:823–33. 10. Keegan TH, Milne RL, Andrulis IL, Chang ET, Sangaramoorthy M, Phillips KA,
et al. Past recreational physical activity, body size, and all-cause mortality following breast cancer diagnosis: results from the Breast Cancer Family Registry. Breast Cancer Res Treat. 2010;123:531–42.
11. Sparano JA, Wang M, Zhao F, Stearns V, Martino S, Ligibel JA, et al. Obesity at diagnosis is associated with inferior outcomes in hormone receptor-positive operable breast cancer. Cancer. 2012;118:5937–46.
12. Sestak I, Distler W, Forbes JF, Dowsett M, Howell A, Cuzick J. Effect of body mass index on recurrences in tamoxifen and anastrozole treated women: an exploratory analysis from the ATAC trial. J Clin Oncol. 2010;28:3411–5. 13. Kwan ML, Chen WY, Kroenke CH, Weltzien EK, Beasley JM, Nechuta SJ, et al.
Pre-diagnosis body mass index and survival after breast cancer in the After Breast Cancer Pooling Project. Breast Cancer Res Treat. 2012;132:729–39. 14. Conroy SM, Maskarinec G, Wilkens LR, White KK, Henderson BE, Kolonel LN.
Obesity and breast cancer survival in ethnically diverse postmenopausal women: the Multiethnic Cohort Study. Breast Cancer Res Treat. 2011;129:565–74. 15. Lu Y, Ma H, Malone KE, Norman SA, Sullivan-Halley J, Strom BL, et al. Obesity
and survival among black women and white women 35 to 64 years of age at diagnosis with invasive breast cancer. J Clin Oncol. 2011;29:3358–65.
16. Ewertz M, Jensen MB, Gunnarsdóttir KÁ, Højris I, Jakobsen EH, Nielsen D, et al. Effect of obesity on prognosis after early-stage breast cancer. J Clin Oncol. 2011;29:25–31.
17. Kawai M, Minami Y, Nishino Y, Fukamachi K, Ohuchi N, Kakugawa Y. Body mass index and survival after breast cancer diagnosis in Japanese women. BMC Cancer. 2012;12:149.
18. Moon HG, Han W, Noh DY. Underweight and breast cancer recurrence and death: a report from the Korean Breast Cancer Society. J Clin Oncol. 2009;27:5899–905. 19. Chauvet B, Reynaud-Bougnoux A, Calais G, Panel N, Lansac J, Bougnoux P,
et al. Prognostic significance of breast relapse after conservative treatment in node-negative early breast cancer. Int J Radiat Oncol Biol Phys. 1990;19:1125–30.
20. Marret H, Perrotin F, Bougnoux P, Descamps P, Hubert B, Lefranc T, et al. Low body mass index is an independent predictive factor of local recurrence after conservative treatment for breast cancer. Breast Cancer Res Treat. 2001;66:17–23.
21. Enger SM, Bernstein L. Exercise activity, body size and premenopausal breast cancer survival. Br J Cancer. 2004;90:2138–41.
22. Carmichael AR, Bendall S, Lockerbie L, Prescott RJ, Bates T. Does obesity compromise survival in women with breast cancer? Breast. 2004;13:93–6. 23. Niraula S, Ocana A, Ennis M, Goodwin PJ. Body size and breast cancer prognosis
in relation to hormone receptor and menopausal status: a meta-analysis. Breast Cancer Res Treat. 2012;134:769–81.
24. Ladoire S, Dalban C, Roché H, Spielmann M, Fumoleau P, Levy C, et al. Effect of obesity on disease-free and overall survival in node-positive breast cancer patients in a large French population: a pooled analysis of two randomised trials. Eur J Cancer. 2014;50:506–16.
25. Perou CM, Sørlie T, Eisen MB, van de Rijn M, Jeffrey SS, Rees CA, et al. Molecular portraits of human breast tumours. Nature. 2000;406:747–52. 26. Sørlie T, Perou CM, Tibshirani R, Aas T, Geisler S, Johnsen H, et al. Gene
expression patterns of breast carcinomas distinguish tumor subclasses with clinical implications. Proc Natl Acad Sci U S A. 2001;98:10869–74. 27. World Health Organization. Western Pacific Region, IASO International
Association for the Study of Obesity, International Obesity Task Force: The Asia Pacific perspective: Redefining obesity and its treatment. Australia: Health Communications Australia; 2000.
28. Deurenberg-Yap M, Chew SK, Deurenberg P. Elevated body fat percentage and cardiovascular risks at low body mass index levels among Singaporean Chinese, Malays and Indians. Obes Rev. 2002;3:209–15.
29. Gurrici S, Hartriyanti Y, Hautvast JG, Deurenberg P. Relationship between body fat and body mass index: differences between Indonesians and Dutch Caucasians. Eur J Clin Nutr. 1998;52:779–83.
30. Jeon YW, Choi JE, Park HK, Kim KS, Lee JY, Suh YJ. Impact of local surgical treatment on survival in young women with T1 breast cancer: long-term results of a population-based cohort. Breast Cancer Res Treat. 2013;138:475–84. 31. Edge SB, Byrd DR, Compton CC, Fritz AG, Greene FL, Trotti A. AJCC Cancer
Staging Manual. 7th ed. New York: Springer; 2010.
32. BMI classification [http://apps.who.int/bmi/index.jsp?introPage=intro_3.html]. Accessed date: 5 November 2015.
33. Jang M, Berry D. Overweight, obesity, and metabolic syndrome in adults and children in South Korea: a review of the literature. Clin Nurs Res. 2011;20:276–91. 34. Cleary MP, Grossmann ME. Minireview: obesity and breast cancer: the estrogen
connection. Endocrinology. 2009;150:2537–42.
35. Papa V, Belfiore A. Insulin receptors in breast cancer: biological and clinical role. J Endocrinol Invest. 1996;19:324–33.
36. Rose DP, Gilhooly EM, Nixon DW. Adverse effects of obesity on breast cancer prognosis, and the biological actions of leptin (review). Int J Oncol. 2002;21:1285–92.
37. Crozier JA, Moreno-Aspitia A, Ballman KV, Dueck AC, Pockaj BA, Perez EA. Effect of body mass index on tumor characteristics and disease-free survival in patients from the HER2-positive adjuvant trastuzumab trial N9831. Cancer. 2013;119:2447–54.
38. Paget S. The distribution of secondary growths in cancer of the breast. 1889. Cancer Metastasis Rev. 1989;8:98–101.
39. Cunningham-Rundles S, McNeeley DF, Moon A. Mechanisms of nutrient modulation of the immune response. J Allergy Clin Immunol. 2005;115:1119–28. quiz 1129.
40. Mowad R, Chu QD, Li BD, Burton GV, Ampil FL, Kim RH. Does obesity have an effect on outcomes in triple-negative breast cancer? J Surg Res. 2013;184:253–9.