INTRODUCTION
Breast cancer is known to be one of the most common female cancers in industrialized countries around the world.
Also, the number of women suffering from breast cancer in developing countries has recently been increasing (1). Breast cancer is also the most common cause of death in cancer patients (2). In Korea, it ranks as the 3rd most common female cancer (3-5) and its mortality rate is 4.2 per 100,000 women, which accounted for more than 970 deaths in 1998 (6).
It has been reported that the factors that affect the prog- nosis of breast cancer after diagnosis include race (7, 8), age (7, 9-12), menopause (9, 13-15), period of disease (16), metas- tasis to the axillary lymph nodes (11, 17), estrogen receptors (18, 19), and weight, etc. Body size may also be related to prognosis in women with breast cancer. This relationship was first reported by Abe et al. (20), who studied obesity in Japanese women with breast cancer. After this several other investigators have studied the effect of body size on progno- sis in breast cancer. Many investigators have found adverse
effects associated with increased body size, whereas others have reported no effects (21). Commonly, in such studies body weight and body mass index (BMI) have been chosen as variables that represent body size.
The purpose of this study was to integrate the relationship between BMI, which is an indicator of body size, and prog- nosis in breast cancer by meta-analysis.
MATERIALS AND METHODS Data collection
The materials used in this study were articles concerning the relationship between BMI and prognosis in breast can- cer that were published in English between January 1966 and December 1999. Information was retrieved from the MEDLINE (only English publications) databases. In addition, the cited references in published articles were also reviewed for relevant results. The medical subject headings for this search were breast cancer, prognosis, survival, body size, BMI,
So Yeon Ryu, Chun-Bae Kim*, Chung Mo Nam�, Jong Ku Park*, Ki Soon Kim, Jong Park, Soo Young Yoo�, Kyung Sook Cho*
Department of Preventive Medicine, Chosun University College of Medicine, Kwangju;
Department of Preventive Medicine* and General Surgery�, Yonsei University Wonju College of Medicine, Wonju; Department of Preventive Medicine and Public Health�, College of Medicine, Yonsei University, Seoul, Korea
Received : 3 May 2001 Accepted : 20 June 2001
Address for correspondence Chun-Bae Kim, M.D.
Department of Preventive Medicine, Yonsei University Wonju College of Medicine, 162 Ilsan-dong, Wonju 220-701, Korea Tel : +82.33-741-0344, Fax : +82.33-747-0409 E-mail : [email protected]
*This study was supported by a research grant No.
HMP-98-I-4-0014 from the ’98 Good Health R & D Project, Ministry of Health & Welfare, Republic of Korea.
610
Is Body Mass Index the Prognostic Factor in Breast Cancer?
: A Meta-Analysis
This study was performed to integrate the results of previous studies that inves- tigated the relationship between body mass index (BMI) and prognosis in breast cancer. We reviewed the English literatures using the MEDLINE database from 1966 to 1999. The materials included 12 published articles with a total of 8,029 cases of breast cancer. The effect size was obtained from hazard ratio in each study. Homogeneity test was conducted before the integration of each effect size and the result demonstrated that the studies were heterogeneous. A random effect model was used to integrate the overall effect size. The integrated effect size was 1.56 (95% confidence interval, 1.22-2.00). In addition, publication bias should be accounted for because each published study was asymmetric in shape revealed by funnel plot. These results suggest that BMI have a prognostic signif- icance in breast cancer. We believe that well-designed longitudinal studies, involv- ing a large number of samples are required to resolve these issues.
Key Words : Breast Neoplasms; Prognosis; Body Mass Index; Meta-Analysis
and Quetelet’s index.
Meta-analysis
A total of 22 articles, which contained the above informa- tion, were selected and evaluated thoroughly by two review- ers. The agreement rate to the quality evaluation of each article between the two reviewers was 87.4%, and disagree- ments were adjusted by mutual consensus. The criteria for excluding articles for quantitative meta-analysis were as fol- lows: i) articles that only compared survival rates versus BMI categories or ii) articles that researched the association bet- ween patient death without follow-up and BMI. In particu- lar, the following standards were used for assessing the in- clusion criteria of articles before applying the meta-analysis, and those that did not meet the standards were excluded from the analysis, even though they provided information for integrating effect size. Firstly, only original articles were used for the evaluation. Secondly, the investigators should have confirmed patient deaths with follow-up. Thirdly, the hazard ratio (effect size) and the 95% confidence interval (CI) must be included as the information about the relation- ship between BMI and prognosis in breast cancer, and be determined using Cox’s proportional hazard model. Adopt- ing these criteria allowed twelve studies to be included in the meta-analysis.
The following information was collected from each study:
the name of the first author, the year of publication, the coun- try, the number of subjects, menopause state, definition of BMI including cut-off, effect size, 95% CI, etc. Particularly, the category of BMI in 12 studies was usually partitioned into binary, tertile, quartile, or quintiles. Therefore, we select- ed articles that were divisible into binary categories, to com- pare only the highest and lowest level of BMI. This method addresses only the question of the risk ratio between the ex- treme categories of exposure.
If the hazard ratio of breast cancer prognosis associated
with the BMI was expressed in more than one way, the esti- mate extracted from the study was the one that reflected the greatest degree of controlling for confounders. Because few studies provided complete data for pre- and post-menopausal women separate, we chose the hazard ratio for the whole group if available.
The relationship between BMI and prognosis in breast cancer was assessed by the estimation of the effect size and 95% CI. In three studies (22-24), only the hazard ratio and the p-value were described, so we computed 95% CI of the hazard ratio by Greenland’s method (25).
To estimate the overall effect size, fixed-effects model and random-effects model were used. A general variance-based method using the confidence intervals based on the assump- tion of fixed effects was used for calculating the overall effect size, 95% CI, and Q statistics by Greenland (25), Prentice and Thomas (26). Because heterogeneity was assessed by the homogeneity test, we presented the overall effect size using the random-effects model as developed by DerSimonian and Laird (27). In addition, the sample sizes and effect size of each article were illustrated using funnel plot to assess pub- lication bias (28).
RESULTS
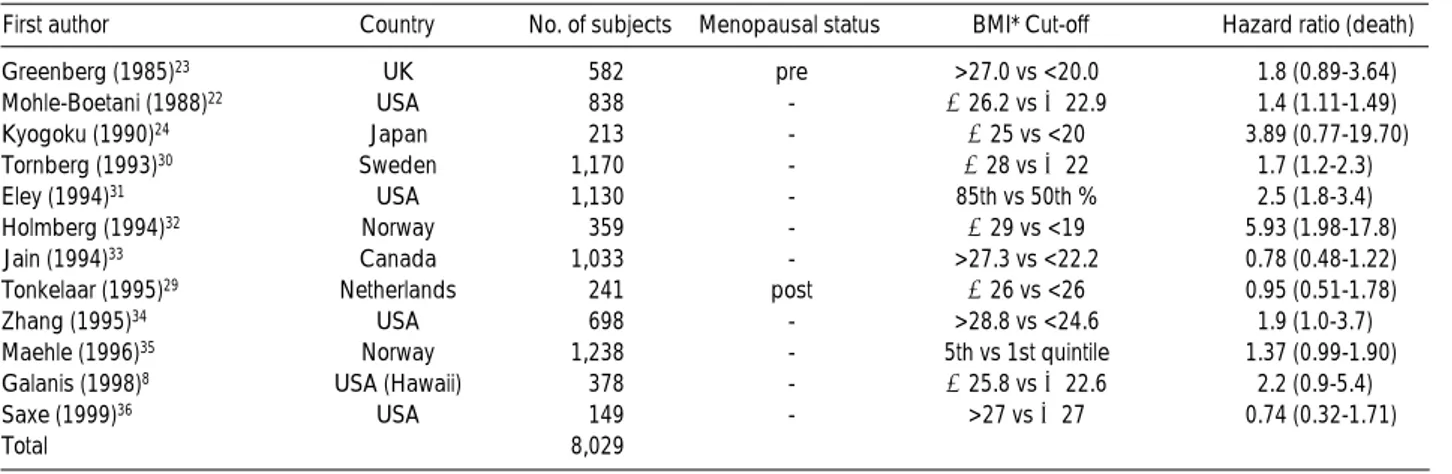
Table 1 presents the details of the 12 studies used in the meta-analysis. A total of 8,029 breast cancer cases were in- cluded in the analysis. Six studies were performed in North America, five were published each in Europe and one in Asia.
Two articles were written in the late 1980s and ten were written after the 1990s. In one paper (23), the subjects were women in pre-menopause. In another (29), the subjects were in post-menopause. In the remaining studies, the analyses of subjects were made regardless of the menopausal status.
Each study was completed at the time of death. In 4 studies (8, 22, 34, 35), the only cause of deaths was breast cancer.
Greenberg (1985)23 UK 582 pre >27.0 vs <20.0 1.8 (0.89-3.64)
Mohle-Boetani (1988)22 USA 838 - ≥26.2 vs ≤22.9 1.4 (1.11-1.49)
Kyogoku (1990)24 Japan 213 - ≥25 vs <20 3.89 (0.77-19.70)
Tornberg (1993)30 Sweden 1,170 - ≥28 vs ≤22 1.7 (1.2-2.3)
Eley (1994)31 USA 1,130 - 85th vs 50th % 2.5 (1.8-3.4)
Holmberg (1994)32 Norway 359 - ≥29 vs <19 5.93 (1.98-17.8)
Jain (1994)33 Canada 1,033 - >27.3 vs <22.2 0.78 (0.48-1.22)
Tonkelaar (1995)29 Netherlands 241 post ≥26 vs <26 0.95 (0.51-1.78)
Zhang (1995)34 USA 698 - >28.8 vs <24.6 1.9 (1.0-3.7)
Maehle (1996)35 Norway 1,238 - 5th vs 1st quintile 1.37 (0.99-1.90)
Galanis (1998)8 USA (Hawaii) 378 - ≥25.8 vs ≤22.6 2.2 (0.9-5.4)
Saxe (1999)36 USA 149 - >27 vs ≤27 0.74 (0.32-1.71)
Total 8,029
First author Country BMI* No. of subjects Menopausal status Cut-off Hazard ratio (death) Table 1. Characteristics of studies for meta-analysis
*BMI: body mass index.
Author
Greenberg (1985) Mohle-Boetani (1988) Kyogoku (1990) Tornberg (1993) Eley (1994) Holmberg (1994) Jain (1994) Tonkelaar (1995) Zhang (1995) Maehle (1996) Galanis (1998) Saxe (1999) Overall
Effect size
0 10 20
Fig. 1. Effect sizes, overall effect size, and their 95% confidence intervals for body mass index and prognosis in breast cancer by study.
For this study, we selected death as a standard for analysis regardless of the cause of death.
A homogeneity test was performed to check the results of each study. The statistical Q-value was 30.88, which is larger than the critical value of 19.67 when the degree of freedom is 11. No homogeneity was found, and therefore, all 12 stud- ies were heterogeneous.
Fig. 1 shows the effect sizes and 95% CI of each study, and the overall effect size determined by meta-analysis. Three of the twelve studies only reported that the effect size was less than 1 and the remaining nine studies reported that the effect size was greater than 1. However, only five studies men- tioned the statistical significance of these results. Using the random-effects model (27), which accounted for hetero- geneity across the 12 studies, estimates based on an overall effect size for BMI and prognosis in breast cancer found to be 1.56 (95% CI, 1.22-2.00), which was statistically signif- icant (Table 2).
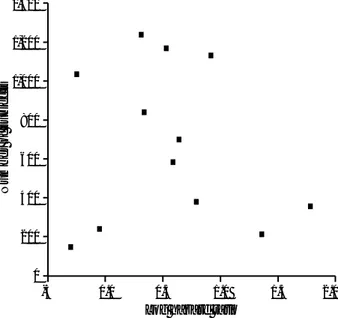
Inverse funnel plotting between sample size and the effect sizes for each study is shown in the log scale (Fig. 2). The scatter of points showed that the studies were concentrated at the right lower and middle part of the triangle. There- fore, studies with a large number of breast cancer patients were lacking.
DISCUSSION
Studies on obesity and prognosis in breast cancer have been undertaken since the late 1970s. In this study, a meta-anal- ysis was performed to integrate the relationship between BMI as an index of obesity and prognosis in breast cancer.
We observed that high BMI had a bad affect on the progno- sis in breast cancer with a statistical significance in this study.
However, because the information used in this study was based on observational studies, the confounding effect of each of the study variables should be accounted for when estimating the relationship between BMI and the prognosis of a breast cancer patient. Also, because the terms of reference of BMI used in each study were different, we were present- ed with limitations in the terms of explaining this result.
Only the highest and lowest hazard ratio of BMI were inte- grated, and therefore, this study does not purport the relation- ship between BMI and prognosis in breast cancer across the BMI range. For these reasons, we thought that the strength of effect size did not mean the absolute value, while it did suggest the possibility of BMI as a prognostic factor related to the prognosis of breast cancer.
Subjects of each study were the patients who had been list- ed as having breast cancer in their community cancer reg- istry, who had had a diagnosis at a defined group and were followed up prospectively, who had had medical treatment at specific hospitals, or who had been assigned to patient groups in a case-control study. Different methods of subject selection might also have influenced the results of this study.
Since six studies were published in North America, five in
Fixed effect 1.54 1.35-1.75
Random effect 1.56 1.22-2.00
Model Overall effect size 95% confidence interval Table 2.The overall effect size and 95% confidence interval for body mass index and prognosis in breast cancer accord- ing to statistical model
Number of subjects
Log hazard ratio 1,400
1,200
1,000
800
600
400
200
0
-5 0.0 0.5 1.0 1.5 2.0
Fig. 2. Funnel plotting of sample size and the logarithm of the hazard ratio of body mass index and prognosis in breast cancer by study.
Europe, and one in Asia, it is possible that racial and envi- ronmental factors might also have influenced the results. In addition, an inconsistency might have existed in terms of the definition of death and the time of the final observation.
In this study, there was a lack of clarity in terms of the recog- nition of the termination of study, and we will emphasize the importance of this particular aspect in further study.
We integrated the results of the studies chosen, which were based on effect size and 95% CI for each study using the fixed effects model and the random effects model. When the fixed effect model is used to integrate the results of studies, a homogeneity test is necessary (27). The hypothe- sis that the magnitude of the effect size was homogeneous was not accepted, and it was shown that the results of the studies incorporated into this analysis were heterogeneous.
Because of diversity in the design and analysis of the various studies, we assumed that the effect size being estimated would vary among the studies. For example, due to differ- ent study population (nations, menopausal status, etc.) and the BMI cut-offs for the comparisons the true effects would vary. To account for several sources of variation in this study, DerSimonian and Laird had employed a random effects model to take account of the variation in the true effects of the studies being combined. Rather than rely on tests of homogeneity to establish the validity of the analysis, we assumed heterogeneity and employed the random effects models (Table 2) as developed by DerSimonian and Laird (27).
The findings of some meta-analyses have later been con- tradicted by large randomized controlled trials (38). Such discrepancies have brought discredit to a technique that has been controversial since its outset. The avoidance of mis- leading meta-analysis necessarily involves considerations of the existence of publication bias and the many other biases that may be introduced into the process of locating, selecting, and combining studies (28, 39-41). Funnel plots, plots of the trials’effect estimates against sample size, may be useful to detect the validity of meta-analyses, including publica- tion bias, etc. (28, 42). In this study, the possibility of pub- lication bias was assessed using funnel plots. Funnel plot asymmetry is shown in areas with many subjects and large effect size (Fig. 2). We do not believe publication bias to be the source of asymmetry in this study. Rather, we think that the asymmetry may have been caused by the lack of the incor- poration of larger-scale studies. As an evidence, although studies on the relationship between obesity and the progno- sis in breast cancer have been conducted since the late 1970s (21), articles have only been published from 1990.
The primary targets of meta-analysis are randomized clin- ical trials in which there is little possibility of a bias interven- ing in the individual research project. Thus, a number of drawbacks are indicated in the application of this method to observational researches, and a considerable debate contin- ues as to the merits of meta-analysis in observational studies
(43-45). Nonetheless, many researchers have emphasized the significance of meta-analysis for contributing to knowl- edge by studying features across studies that may account for result variations (46-48).
It is still difficult to find a large cohort study of high qual- ity targeted at women in this area. Therefore, what we should emphasize is not just a simple methodological application of meta-analysis, but the necessity to conduct high quality cohort studies and higher quantity studies related to this issue. Only when high quality studies are performed, will quantitative meta-analysis contribute to the integration of high quality results.
In conclusion, our results suggest that BMI may be a prog- nostic indicator in breast cancer.
REFERENCES
1. Parkin DM, Stjernsward J, Muir C. Estimates of worldwide frequen- cy of twelve major cancers. B World Health Organ 1984; 62: 163- 82.
2. Canadian Cancer Society. Canadian Cancer Statistics 1987. Toron- to, Canada, 1987.
3. Korean Ministry of Health & Welfare. Analysis of Korean cancer registration data (1993), 1995.
4. Yoo KY, Noh DY, Choi KJ. Epidemiology of breast cancer in Korea.
Korean J Epidemiol 1995; 17: 30-47.
5. Yoo KY, Park SK, Sung JH, Kang DH, Kim YC, Kang HS, Suh JS, Kim JS, Yoon IJ, Han SH, Noh DY, Choi KJ. High risk group for female breast cancer in Korea. J Korean Cancer Assoc 1998; 30:
435-49.
6. National Statistical Office Republic of Korea. 1998 annual report on the cause of death statistics (based on vital registration), 1999.
7. Gloecker-Reis L, Pollack ES, Young JL. Cancer patient survival. J Natl Cancer Inst 1983; 70: 693-707.
8. Galanis DJ, Kolonel LN, Lee J, Le Marchand L. Anthropometric predictors of breast cancer incidence and survival in a multi-ethnic cohort of female residents of Hawaii, United States. Cancer Causes Control 1998; 9: 217-24.
9. Muller CB, Ames F, Anderson GD. Breast cancer in 3558 women:
age as a significant determinant in the rate of dying and causes of death. Surgery 1978; 83: 123-32.
10. Palmer MK, Lythgoe JP, Smith A. Prognostic factors in breast can- cer. Br J Surgery 1982; 69: 697-8.
11. Rutqvist LE, Wallgren A. Influence of age on outcome in breast carcinoma. Acta Radiol Oncol 1983; 22: 289-94.
12. Velentgas P, Daling JR. Risk factors for breast cancer in younger women. J Natl Cancer Inst Monogr 1994; 16: 15-24.
13. Cutler SJ, Asire AJ, Taylor SG III. An evaluation of ovarian status as prognostic factor in disseminated cancer of the breast. Cancer 1970; 26: 938-43.
14. Langlands AO, Kerr GR. Prognosis in breast cancer: the effect of age and menstrual status. Clin Oncol 1979; 5: 123-33.
15. Ursin G, Longnecker MP, Haile RW, Greenland S. A meta-analysis
of body mass index and risk of premenopausal breast cancer. Epi- demiology 1995; 6: 137-41.
16. Wilkinson GS, Edgerton F, Wallace HJ, Resse P, Patterson J, Priore R. Delay, stage of disease and survival from breast cancer. J Chronic Dis 1979; 32: 365-73.
17. Fisher B, Bauer M, Wickerham DL, Redmond CK, Fisher ER, Cruz AB, Foster R, Gardner B, Lerner H, Margolese R, et al. Relation of number of positive axillary nodes to the prognosis of patients with primary breast cancer. Cancer 1983; 52: 1551-7.
18. Clark GM, McGuire WL, Hubay CA, Person OH, Marshall JS. Pro- gesterone receptors as a prognostic factor in stage II breast cancer.
N Engl J Med 1983; 309: 1343-7.
19. Manni A. Hormone receptors and breast cancer. N Engl J Med 1983;
309: 1383-5.
20. Abe R, Kumagi N, Kimura M, Hirosaki Am Nakamura T. Biologi- cal characteristics of breast cancer in obesity. Tohoku J Exp Med 1976; 120: 351-9.
21. Goodwin PJ, Boyd NF. Body size and breast cancer prognosis: a critical review of the evidence. Breast Cancer Res Treat 1990; 16:
205-14.
22. Mohle-Boetani J, Grosser S, Whittemore AS, Malec M, Kampert JB, Paffenbarger RS Jr. Body size, reproductive factors and breast cancer survival. Prev Med 1988; 17: 634-42.
23. Greenberg ER, Vessy MP, Mcpherson K, Doll R, Yeates D. Body size and survival in premenopausal breast cancer. Br J Cancer 1985;
51: 691-7.
24. Kyogoku S, Hirohata T, Takeshita S, Nomura Y, Shigematsu T, Horie A. Survival of breast-cancer patients and body size indicators.
Int J Cancer 1990; 46: 824-31.
25. Greenland S. Quantitative methods in the review of epidemiologic literature. Epidemiol Rev 1987; 9: 1-30.
26. Prentice RL, Thomas DB. On the epidemiology of oral contracep- tives and disease. Adv Cancer Res 1987; 49: 285-401.
27. DerSimonian R, Laird N. Meta-analysis in clinical trials. Control Clin Trials 1986; 7: 177-88.
28. Egger M, Smith GD, Schneider M, Minder C. Bias in meta-analysis detected by a simple, graphical test. Br Med J 1997; 315: 629-34.
29. den Tonkelaar I, de Waard F, Seidell JC, Fracheboud J. Obesity and subcutaneous fat patterning in relation to survival of postmenopausal breast cancer patients participating in the DOM-project. Breast Cancer Res Treat 1995; 34: 129-37.
30. Tornberg S, Carstensen J. Serum beta-lipoprotein, serum cholesterol and Quetelet's index as predictors for survival of breast cancer pa- tients. Eur J Cancer 1993; 29A: 2025-30.
31. Eley W, Hill HA, Chen VW, Austin DF, Wesley MN, Muss HB, Greenberg RS, Coates RJ, Correa P, Redmond CK, Hunter CP, Herman AA, Kurman R, Blacklow R, Shapiro S, Edwards BK.
Racial differences in survival from breast cancer. Results of the national cancer institute black/white cancer survival study. JAMA
1994; 272: 947-54.
32. Holmberg L, Lund E, Bergstrom R, Adami HO, Meirik O. Oral contraceptives and prognosis in breast cancer: effects of duration, latency, residency, age at first use and relation to parity and body mass index in young women with breast cancer. Eur J Cancer 1994;
30A: 351-4.
33. Jain M, Miller AB. Pre-morbid body size and the prognosis of women with breast cancer. Int J Cancer 1994; 59: 363-8.
34. Zhang S, Folsom AR, Sellers TA, Kushi LH, Potter JD. Better breast cancer survival for postmenopausal women who are less overweight and eat less fat. The Iowa women's health study. Cancer 1995; 76:
275-83.
35. Maehle BO, Tretli S. Pre-morbid body mass index in breast cancer:
reversed effect on survival in hormone receptor negative patients.
Breast Cancer Res Treat 1996; 41: 123-30.
36. Saxe GA, Rock CL, Wicha MS, Schottenfeld D. Diet and risk for breast cancer recurrence and survival. Breast Cancer Res Treat 1999; 53: 241-53.
37. Petitti DB. Meta-analysis, decision analysis and cost-effectiveness analysis-methods for quantitative synthesis in medicine. New York, Oxford University Press, 1994.
38. Egger M, Smith GD. Misleading meta-analysis. Lessons from “an effective, safe, simple”intervention that wasn’t. Br Med J 1995; 310:
752-4.
39. Easterbrook PJ, Berlin JA, Gopalan R, Matthews DR. Publication bias in clinical research. Lancet 1991; 337: 867-72.
40. Egger M, Zellweger-Zahner T, Schneider M, Junker C, Lengeler C, Antes G. Language bias in randomized controlled trials published in English and German. Lancet 1997; 350: 326-9.
41. Petitti DB. Of babies and bathwater. Am J Epidemiol 1994; 140:
779-82.
42. Light RJ, Pillemer DB. Summing up. The science of reviewing re- search. Cambridge, MA: Harvard University Press, 1984.
43. Cook DJ, Sackett DL, Spitzer WO. Methodologic guidelines for systematic reviews of randomized control trials in health care from the Potsdam Consultation on Meta Analysis. J Clin Epidemiol 1995; 48(1): 167-71.
44. Shapiro S. Meta-analysis/Shmeta-analysis. Am J Epidemiol 1994;
140: 771-8.
45. Davey Smith G, Egger M, Phillips AN. Meta-analysis and data synthesis in medical research. In: Oxford Textbook of Public Health (Vol 2). New York, Oxford University Press, 1997: 631-50 46. Greenland S. Can meta-analysis be salvaged? Am J Epidemiol 1994;
140: 783-7.
47. Bailar JC III. The practice of meta-analysis. J Clin Epidemiol 1995;
48: 149-57.
48. Mosteller F, Colditz GA. Understanding research synthesis (meta- analysis). Annu Rev Public Health 1996; 17: 1-23.