The Impact of Asian Economic Policy Uncertainty : Evidence from Korean Housing Market
Ji-Hong Jeon1
Received: April 12, 2018. Revised: April 22, 2018. Accepted: May 5, 2018.
Abstract
We study the impact of economic policy uncertainty (EPU) of Asian four countries such as Korea, Japan, Hong Kong, and China on housing market returns in Korea. Also, we document the relationship between the EPU index of those four countries and the housing market including macroeconomic indicators in Korea. The EPU index of those four countries has significantly a negative effect on the housing purchase price index, housing lease price index in Korea. The EPU index in Korea and Japan has significantly a negative effect on the CPI.
The EPU index in only Japan has significantly a negative effect on the PPI. The EPU index in Hong Kong and Korea has significantly a negative effect but the EPU index in China significantly has a positive effect on the stock price index in construction industry. The EPU index in only Korea has significantly a negative effect the stock price index in banking industry. This study shows the EPU index of the Korea has the negative relationships on the housing market economy rather than other countries by VECM. And this study has an important evidence of the spillover of several macroeconomic indicators in Korea for the EPU index of the Asian four countries.
Keywords: Asian Countries, Economy Policy Uncertainty Index, Housing Market, Stock market, Vector Error Correction Model.
JEL Classification Code: C32, D80, E60, E66, G10, G15.
1. Introduction 1
Housing prices are closely related to national economic policies. Numerous studies supporting this are still continuing. In this study, we examine whether the economic policy uncertainty (EPU) of Asian countries including Korea can affect Korea's economic environment, especially the housing market. Also, if Asian countries have an impact on Korea's housing market, which any country's EPU will has the most impact?
Prior to starting this interesting question, we looked at the information about population density republished from the Central Intelligence Agency (CIA) World Factbook 2017.
Korea is one of the most densely populated countries in Asia, including Hong Kong, Japan, etc. According to Ministry of Land, Infrastructure and Transport as of 2016, it takes 6.7 years to purchase the first house for the life in Korea. The Korean people are more interested in purchasing a house than other assets. The economic uncertainty of the country
1 First Author, Adjunct Professor, School of Business, Hanyang University, Seoul, Korea. Tel: +82-2-2220-2435,
E-mail: [email protected]
can have a significant impact on the housing market. We examine the impact of this study on the Korean housing market through the EPU of four major Asian powers: Korea, Japan, Hong Kong and China. In particular, Korea is more sensitive to housing economy than other countries because of its high population density. Therefore, the share of housing in the national economy is large. We find out previous studies that the relationship between the national economy and the housing market is intimate. Buckley and Ermisch (1982) use the UK government as an example. If the government had a large involvement in the housing market, it would have a strong influence on the housing market. Englund and Ioannides (1997) compare housing prices in 15 Organization for Economic Co-operation and Development (OCED) countries, including Sweden, the United Kingdom and the United States, and housing prices are not the main macroeconomic variables, but policy changes, such as tax reforms and credit deregulation, have the greatest impact on housing prices.
Bittlingmayer (1998) report that stock volatility increases if the output decreases. Taking Germany as an example, it is clear that political events are a source of volatility. During the mid and late 1920s, Germany's political stabilization was steadily decreasing volatility and volatility of stocks. He also
44 Ji-Hong Jeon / Journal of Asian Finance, Economics and Business Vol 5 No 2 (2018) 43-51
finds that using VAR (vector auto regression), uncertainty has a negative relationship to stock volatility and consumer price index (CPI). According to Bloom (2009), investment and employment are halted and consumption and production are reduced in uncertain times such as the Cuban Missile Crisis and the Organization of the Petroleum Exporting Countries (OPEC) I oil shock. Thus, the impact of this uncertainty has shown a short, rapid decline and recovery.
Beltratti and Morana (2010) study the relationship between macroeconomic conditions and housing prices in the Group of 7 (G-7) countries. Rahman (2010) reports Australia's recent rise in housing prices because of the complexity of various factors, especially as mortgage-based house owners and renters increased in number. In addition, government taxes, land supply and land-use planning systems, and economic climate have contributed to changes in housing prices. Jian (2012) documents the urban consumption in China with Foodstuff, Health care and Housing. Wang and Kim (2014) study the problem of an aging population and reverse mortgages in China by using housing price, interest rate, and so on. Antonakakis and Floros (2016) cite economic variables such as the United Kingdom (UK) housing and stock market, economic policy uncertainty, inflation, and real interest rate. Unexpected severe economic fluctuations such as the financial crisis could lead to uncertainty in the economic situation and real estate investment market. Zhang et al. (2016) study the relationship between house price and house demand. Jeong (2017) examines the credit loan for housing in Korea to explain the household consumption. In this way, we find that there are studies on the economic policy uncertainties and the housing market.
First of all, the EPU index as the indicator of economic policy uncertainties bases on the frequency of the terms in the newspaper, and the EPU index of over 20 countries, including Korea, Japan, Hong Kong and China, is made by Baker et al. (2016). They investigate the relationship between various economic factors such as stock price volatility and employment growth. Aoki et al. (2004) study housing price, consumption and monetary policy in the UK housing market. As a result, the impact of monetary policy increases consumption but lowers the effect of housing prices and housing investment. Also, structural changes in the credit markets have lowered the additional loan transaction costs.
Mei and Guo (2004) study the effects of policy instability on the stock markets of 22 emerging markets, focusing on the financial crisis. As a result, using the probit and switching regression, they find that the stock market volatility increases during political elections. Döpke and Pierdzioch (2006) study the relationship between German
politics and stock markets. Using a VAR model, the stock market affects the popularity of the German government.
And that the political process has a weak impact on the stock market. Compared with the United State (US), the German stock market did not move much higher during the left government period than the right-wing government.
Campbell and Cocoo (2007) use a UK family consumption survey to study the response of consumption to housing prices. As a result, predicted changes in housing prices correlated with consumption forecasts. And more sensitive to lending, affect not only homeowners but also renters, and in the end, UK house prices are closely correlated with the overall financial market.
Backé and Wójcik (2008) study the effects of consumption and monetary policy, which play a pivotal role in credit expansion in the euro area. In particular, the recent lending boom has a strong connection with mortgage-based housing loans and can give the energy to policy makers and new research. Iacoviello and Minetti (2008) conduct a study of bank lending related to the housing market in four countries such as Finland, Germany, Norway and the UK.
They argue that the credit channel is related to the structural characteristics of the housing finance system, namely efficiency and institutional organization. Using a VAR model, they find that there is a close correlation between the credit channel, the efficiency of housing finance, and the mortgage organization.
Calcagno et al. (2009) study the impact of Italy's household income and consumption behavior on real estate change. An increase in housing prices has led to an increase in consumption for homeowners and tenants.
Boutchkova et al. (2012) argue that political uncertainty affects stock market volatility and political risk makes volatility even higher. The industry response to political events is asymmetric. Julio and Yook (2012) study the relationship between the policy instability and corporate investment in 48 countries. They find that it reduces investment spending on companies until policy instability is resolved.
Chang et al. (2015) examine the relationship between the seven OECD countries and the economic uncertainty of each country. The results of the bootstrap panel causality test show that policy uncertainty has a negative impact on industrial production (IP), economic growth, and firm-level investment decisions, which has a negative impact on share prices. Su et al. (2016) find that EPU in Germany has no impact on the housing market. The reason is that the German real estate market has stabilized. A characteristic of social welfare and a reasonable system are provided.
However, in an external crisis, the real estate market has an important influence on economic policy choice.
There are housing in K relationship b tax income demographic (2008) studie instability. A decrease in h Construction housing price The CPI o effect on the Gross Domes macroeconom housing price study, corpor construction government's stabilize hous Excessive h consumers' s as follows. S and empirica analysis of th
2. Data an
2.1. Data The data u 1999 to Dece variables, and Japan, Hong In addition, excluding EP CPI, Produce consumption Index (HPPI) indicate direc construction s indirectly ide variables.
The EPU i comes from B the CPI is o Korea and th addition, the Bank in Kor indexes are s For the CP an alternative
many studie Korea. Chung between instab and housing variables hav s the impact o decrease in housing supply orders show e instability.
of macroecono home sales pr stic Product (G mic variables
es in Korea.
rate bond retu permits show s housing po
sing, but it h housing policy sense of buyin Section 2 prov al analysis mo
e model. Sect
nd Method
used in this stu ember 2016. T
d we try to an Kong and Ch
there are PU for the em
er Price Inde and productio ) and the Ho ctly trends in stock Index an entifies housin ndex of Korea Baker et al. (20 btained from he PPI is obta HPPI and H ea, and the supplied by Fn PI, Dougherty e to home purc
s on econom g and Haurin bility of family s
cost. Stocha ve influenced of housing poli construction y and an incre w a negative
omic variable rice and the le GDP), CPI, an
that affect th According to urns, money s wed significan olicy changed
ad no effect y has adve ng home. The vides an expla odel, and Se tion 4 describe
dology
udy are month The data used
alyze the effe hina on Korea six macroe mpirical analys ex (PPI) that
on. The Hous using Lease n the housing
nd the banking ng market tre a, Japan, Hon 016). As a ma
the National ained from the HLPI are obta
construction Guide in Kore
and Order (1 chase price an
mic uncertainty n (2002) stud
size outcome, astic economic
housing choic icy on housing orders results ease in house
e relationship s has a sign ease price. The nd money sup he destabilizat the results o supply and bu nt results, bu d several tim
on housing p rsely affected rest of this st anation of the ection 3 show es the conclus
hly data for Ja in this study a ct of EPU of K a 's housing m
conomic var is. We use K represent K sing Purchase Price Index ( g market. An g stock index ends are use ng Kong and acroeconomic Statistical Off e Bank of Kor ined from Ko and banking ea.
982) report C nd mortgage in
y and dy the , after- c and ce. Yu g price s in a
prices.
p with nificant
ey use pply as tion of of the uilding ut the mes to prices.
d the tudy is e data ws the
ion.
anuary are ten Korea, market.
riables Korea's Korea's Price (HLPI) nd the
which ed as
China index, fice of rea. In ookmin stock CPI as nterest
cos exp wel rela stud on pric the the HLP the
F
A indi stoc And Wh fina 199 can Jeo
st, along with penditure flow fare. Yu and L ated to HPPI a dies that if the
Korea, the U ces of raw ma
PPI using the cycle for CPI PI and PPI ha
last 18 years
igure 1. The cy
Figure 2. The As for the sto
irectly predict ck price index d we report tha
en the hous ancial stock ind 97). While the n be predicted on et al., 2017)
capital cost, w needed to Lee (2010) stu and HLPI. Re e uncertainty o United States
terials such as e raw materia
, HPPI, HLPI ave risen 57%
respectively.
cle of the CPI, H 2016
cycle of the CSI ock price ind changes in th that represen at CSI and BS sing market
dexes are also EPU index inc to decrease.
).
as an index o support a sta udy that Korea
garding the P f the national and Japan is s gold and cru ls increases. F and PPI. Kor
%, 101%, 165
HPPI, HLPI, and 6:12)
I and BSI. (1999 ex, in Fig. 2 e housing ma ts the Korean SI move in the improves, the o rising. (Englu creases, the s
(Antonakakis
of the minimu andard level a's CPI is close PPI, Jeon (201
economic poli s uncertain, th ude oil rise, an Fig. 1 illustrat rea's CPI, HPP 5% and 31% f
d PPI. (1999:01-
9:01-2016:12) 2, CSI and B
rket through th housing mark same directio e housing an und & Ioannid stock price ind
& Floros, 201 um
of ely 7) cy he nd es PI, for
-
BSI he ket.
on.
nd es, ex 16;
46 Ji-Hong Jeon / Journal of Asian Finance, Economics and Business Vol 5 No 2 (2018) 43-51
Table 1. Descriptive statistics.
Korea EPUI
Japan EPUI
Hong Kong EPUI
China
EPUI CPI PPI HPPI HLPI CSI BSI Mean 4.696 4.618 4.635 4.686 4.425 4.518 4.340 4.225 4.857 5.411 Median 4.723 4.619 4.654 4.657 4.426 4.508 4.409 4.189 4.963 5.447 Min. 3.119 3.883 3.136 2.205 4.166 4.340 3.920 3.648 3.644 4.598 Max. 5.975 5.465 5.828 6.373 4.621 4.691 4.619 4.621 6.097 5.949 S.D. 0.475 0.292 0.554 0.655 0.145 0.117 0.216 0.239 0.576 0.346 N 216 216 216 216 216 216 216 216 216 216 Note: EPUI, CPI, PPI, HPPI, HLPI, CSI, BSI indicate separately
Economy Policy Uncertainty Index, Consumer Price Index, Producer Price Index, Housing Purchase Price Index, Housing Lease Price Index, Construction Stock Index, Banking Stock Index.
2.2. Methodology
In this study, we use Vector Error Correction Model (VECM) as Equation (1) rather than Vector Auto Regression (VAR) for the empirical analysis through the relationship between cointegration and error correction model proposed by Granger (1981). The reason for using VECM is that the linear combination of abnormal time series variables may look normal as the study of Engle and Granger (1987) which considered whether the system has the equilibrium in the long time and a stationary linear for changes. Therefore, when there is no unit root in the first difference variable but the cointegration relation is found through the cointegration test, it is possible to prevent the information loss that may occur in the first differential using VECM using the level variable.
∆ = ∑ ∆ + + ψ + (1) Δ: first difference operator
: (p × 1) vector as variables are I(1) i: lag order
s: maximum number of lag order t: time (period)
γ: p × p matrix of short-run coefficients αβ : lagged error correction term α: adjustment parameters
β: cointegration vectors
ψ: vector of deterministic components : p × 1 vector of disturbances
p: EPU Index of Korea, Japan, Hong Kong and China, CPI, PPI, HPPI, HLPI, CSI, BSI.
3. Empirical Findings
3.1. Unit Root Test
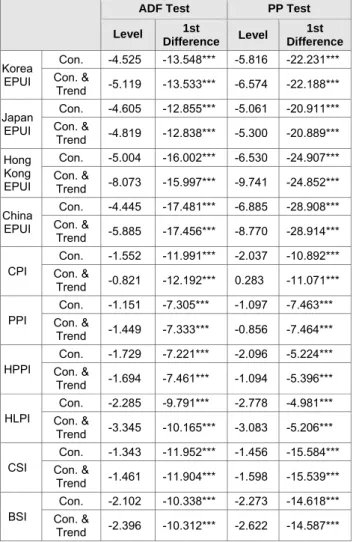
Granger and Newbold (1974) suggest that the unit root test should identify whether there is strong autocorrelation in the monthly residual series. If the time series variable is unstable, there may be a problem with spurious regression. Augmented dickey fuller (ADF) and Phillips-Perron (PP) tests are performed as shown in Table 2. As a result of the unit root test, the level variable that took log data in raw data has a unit root, but there is no unit root in the first difference result. Therefore, the first subordinate time series has stability because there is no unit root.
Table 2. Unit root tests.
ADF Test PP Test
Level 1st
Difference Level 1st Difference Korea
EPUI
Con. -4.525 -13.548*** -5.816 -22.231***
Con. &
Trend -5.119 -13.533*** -6.574 -22.188***
Japan EPUI
Con. -4.605 -12.855*** -5.061 -20.911***
Con. &
Trend -4.819 -12.838*** -5.300 -20.889***
Hong Kong EPUI
Con. -5.004 -16.002*** -6.530 -24.907***
Con. &
Trend -8.073 -15.997*** -9.741 -24.852***
China EPUI
Con. -4.445 -17.481*** -6.885 -28.908***
Con. &
Trend -5.885 -17.456*** -8.770 -28.914***
CPI
Con. -1.552 -11.991*** -2.037 -10.892***
Con. &
Trend -0.821 -12.192*** 0.283 -11.071***
PPI
Con. -1.151 -7.305*** -1.097 -7.463***
Con. &
Trend -1.449 -7.333*** -0.856 -7.464***
HPPI
Con. -1.729 -7.221*** -2.096 -5.224***
Con. &
Trend -1.694 -7.461*** -1.094 -5.396***
HLPI
Con. -2.285 -9.791*** -2.778 -4.981***
Con. &
Trend -3.345 -10.165*** -3.083 -5.206***
CSI
Con. -1.343 -11.952*** -1.456 -15.584***
Con. &
Trend -1.461 -11.904*** -1.598 -15.539***
BSI
Con. -2.102 -10.338*** -2.273 -14.618***
Con. &
Trend -2.396 -10.312*** -2.622 -14.587***
Notes: 1. EPUI, CPI, PPI, HPPI, HLPI, CSI, BSI indicate separately Economy Policy Uncertainty Index, Consumer Price Index, Producer Price Index, Housing Purchase Price Index, Housing Lease Price Index, Construction Stock Index, Banking Stock Index.
2. ADF and PP denote Augmented Dickey-Fuller and Phillips-Perron respectively.
3. Con, Con. & Trend denote constant, and constant and trend separately.
4. ***, **, * mean 1%, 5%, 10% levels.
3.2. Cointegration Test
The cointegration test developed by Johansen (1988) is used to confirm whether there is a cointegration relation in time series. Johansen test is divided into Trace statistic and Maximum eigen value (λmax). Ho is a hypothesis that there is no cointegration. As a result of the cointegration test in Table 3, the cointegration exists, and the VECM, rather than the VAR, is used for the empirical analysis.
Table 3. Cointegration test.
Ho Trace 5% Critical
Value ëmax 5% Critical Value r=0 679.90 233.13 196.55 62.81 r≤1 483.34 192.89 137.58 57.12 r≤2 345.76 156.00 107.33 51.42
r≤3 238.43 124.24 84.40 45.28
r≤4 154.02 94.15 72.58 39.37
r≤5 81.43 68.52 28.48 33.46 r≤6 52.94 47.21 23.95 27.07 r≤7 28.99* 29.68 15.59 20.97 Note: * means p<0.05.
3.3. Granger Causality Test
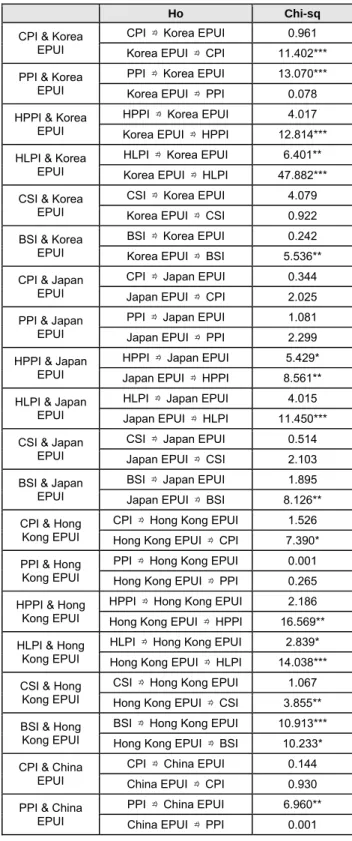
Through the Granger causality test by Granger (1980), we examine the effects of EPU index in the four countries on the Korean economy. In Table 4, if the null hypothesis (Ho) is significant, the EPU index of four countries and the Korean economic index variables, it is rejected, and the alternative hypothesis is adopted. As a result of the Granger causality test, Korea EPU index has a causal relationship valid for CPI, HPPI, HLPI, and BSI. Conversely, PPI, HLPI has a causal relationship valid for Korea EPU index. Japan EPU index has a causal relationship available to HPPI, HLPI, BSI. On the contrary, only HPPI has a causal relationship valid for Japan EPU index. Hong Kong EPU index has a causal relationship valid for all other Korean economic index variables except PPI. On the other hand, only HLPI and BSI had a causal relationship valid for Hong Kong EPU index.
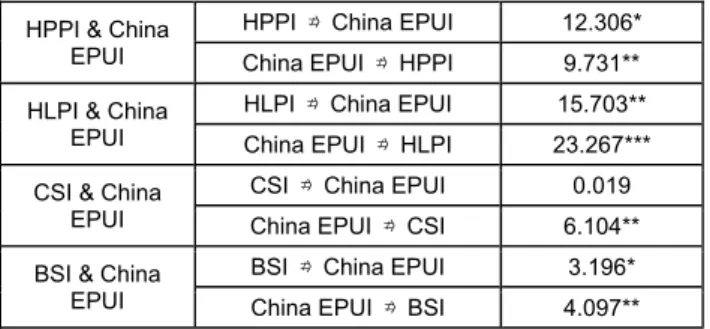
China EPU index had a causal relationship to all other economic index variables except CPI and PPI. All other economic index variables except CPI and CSI had a causal relationship valid for China EPU index.
3.4. VECM
Table 4. Granger causality tests.
Ho Chi-sq
CPI & Korea EPUI
CPI ⇏ Korea EPUI 0.961 Korea EPUI ⇏ CPI 11.402***
PPI & Korea EPUI
PPI ⇏ Korea EPUI 13.070***
Korea EPUI ⇏ PPI 0.078 HPPI & Korea
EPUI
HPPI ⇏ Korea EPUI 4.017 Korea EPUI ⇏ HPPI 12.814***
HLPI & Korea EPUI
HLPI ⇏ Korea EPUI 6.401**
Korea EPUI ⇏ HLPI 47.882***
CSI & Korea EPUI
CSI ⇏ Korea EPUI 4.079 Korea EPUI ⇏ CSI 0.922 BSI & Korea
EPUI
BSI ⇏ Korea EPUI 0.242 Korea EPUI ⇏ BSI 5.536**
CPI & Japan EPUI
CPI ⇏ Japan EPUI 0.344 Japan EPUI ⇏ CPI 2.025 PPI & Japan
EPUI
PPI ⇏ Japan EPUI 1.081 Japan EPUI ⇏ PPI 2.299 HPPI & Japan
EPUI
HPPI ⇏ Japan EPUI 5.429*
Japan EPUI ⇏ HPPI 8.561**
HLPI & Japan EPUI
HLPI ⇏ Japan EPUI 4.015 Japan EPUI ⇏ HLPI 11.450***
CSI & Japan EPUI
CSI ⇏ Japan EPUI 0.514 Japan EPUI ⇏ CSI 2.103 BSI & Japan
EPUI
BSI ⇏ Japan EPUI 1.895 Japan EPUI ⇏ BSI 8.126**
CPI & Hong Kong EPUI
CPI ⇏ Hong Kong EPUI 1.526 Hong Kong EPUI ⇏ CPI 7.390*
PPI & Hong Kong EPUI
PPI ⇏ Hong Kong EPUI 0.001 Hong Kong EPUI ⇏ PPI 0.265 HPPI & Hong
Kong EPUI
HPPI ⇏ Hong Kong EPUI 2.186 Hong Kong EPUI ⇏ HPPI 16.569**
HLPI & Hong Kong EPUI
HLPI ⇏ Hong Kong EPUI 2.839*
Hong Kong EPUI ⇏ HLPI 14.038***
CSI & Hong Kong EPUI
CSI ⇏ Hong Kong EPUI 1.067 Hong Kong EPUI ⇏ CSI 3.855**
BSI & Hong Kong EPUI
BSI ⇏ Hong Kong EPUI 10.913***
Hong Kong EPUI ⇏ BSI 10.233*
CPI & China EPUI
CPI ⇏ China EPUI 0.144 China EPUI ⇏ CPI 0.930 PPI & China
EPUI
PPI ⇏ China EPUI 6.960**
China EPUI ⇏ PPI 0.001
48 Ji-Hong Jeon / Journal of Asian Finance, Economics and Business Vol 5 No 2 (2018) 43-51
HPPI & China EPUI
HPPI ⇏ China EPUI 12.306*
China EPUI ⇏ HPPI 9.731**
HLPI & China EPUI
HLPI ⇏ China EPUI 15.703**
China EPUI ⇏ HLPI 23.267***
CSI & China EPUI
CSI ⇏ China EPUI 0.019 China EPUI ⇏ CSI 6.104**
BSI & China EPUI
BSI ⇏ China EPUI 3.196*
China EPUI ⇏ BSI 4.097**
Notes: 1. ⇏ means “does not Granger Cause”.
2. ***, **, * mean 1%, 5%, and 10% levels.
3. EPUI, CPI, PPI, HPPI, HLPI, CSI, BSI indicate separately Economy Policy Uncertainty Index, Consumer Price Index, Producer Price Index, Housing Purchase Price Index, Housing Lease Price Index, Construction Stock Index, Banking Stock Index.
Optimal lags for VECM are set to lag 1 through the Schwarz-Bayesian Information Criterion (SBIC) as shown in Table 5.
Table 5. Lag order selection.
lag SBIC HQIC AIC
0 -8.939 -9.033 -9.096
1 -32.611* -33.636 -34.330
2 -32.136 -34.092 -35.417
3 -31.269 -34.156 -36.113
4 -29.610 -33.428 -36.017
Notes: 1. * means the optimal lag order.
2. SBIC, AIC, HQIC denote respectively Schwarz-Bayesian Information Criterion, Hannan-Quinn Information Criterion, Akaike Information Criterion.
The results for VECM are shown in Table 6. Korea EPU index has a significant negative relationship to all Korean economic indices except PPI. On the other hand, Japan EPU index has a significant negative relationship only for CPI and PPI. Hong Kong EPU index has a significant negative relationship only with CSI. China EPU index has a positive relationship with only CSI among Korean economic indexes.
Table 6. Estimation results of VECM.
Korea EPUI Japan EPUI
Hong
Kong EPUI China EPUI CPI -0.001*
(0.001)
-0.002*
(0.001)
-0.001 (0.001)
0.001 (0.001) PPI -0.001
(0.001) -0.003*
(0.002) -0.001
(0.001) -0.001 (0.001) HPPI -0.002**
(0.001) 0.002
(0.001) -0.001
(0.001) 0.001 (0.001) HLPI -0.002**
(0.001)
-0.002 (0.002)
0.001 (0.001)
0.001 (0.001) CSI -0.044*
(0.025)
-0.045 (0.040)
-0.038*
(0.020)
0.033**
(0.017) BSI -0.058***
(0.022) 0.012
(0.036) -0.013
(0.018) 0.024 (0.015) Notes: 1. ***, **, * mean 1%, 5%, and 10% levels.
2. standard errors are in parentheses.
3.5. Impulse Responses
3.5.1. Impulse response of EPU index in Korea
After impact on Korea EPU index in Fig. 3, the CPI response curve initially falls to negative and reaches the lowest point in the first period. The decline in Korea EPU index stimulates CPI demand. The reaction from the second to the positive reaches the peak in the fourth period. The PPI has been declining negatively from the beginning and continues to have a downward curve. The HPPI declined after the shock of Korea EPU index, but after going over one period, it turned to positive, and it continued to rise. It can be seen that HLPI also moves to a trend of a type similar to HPPI. In the early period, it fell to the negative, and after the second period, it was converted to the positive and the gentle rise. CSI initially fell to negative, but before reaching the second stage, it was converted to positive and then increased as time went on. The BSI also fell in the early period but turned to positive in the second period and continued to rise moderately.
3.5.2. Impulse response of EPU index in Japan
Japan After the shock to EPU index in Fig. 3, the CPI response curve initially falls to negative and reaches the lowest point in the first period. After passing through the first period, it is converted to the echoes of the sheep, and the third is kept at the peak and then the gentle descending curve is drawn. The PPI initially falls to negative and reaches the lowest point in the first period. In the second phase, it switched to positive and peaked at the sixth stage and has a gentle descent curve. The HPPI has risen from its earliest to the positive, peaking at the first stage, and slowly repeating the rise and fall in the range of quantities. The HLPI has begun to be positive from the beginning and
continues to negative terri first stage an The BSI has to a steady do
3.5.3. Impu The CPI i converted to eventually co Fig. 3. The P fourth period gradual dow beginning an from the seco upward curve beginning and gradually rise beginning and
Note
rise in the po tory from the d has been d a negative re ownward reac ulse response nitially started
a negative v onverged into PPI starts to ris d, declines to wnward curve d declines fro ond period to t
e. The HLPI d falls sharply es and falls d starts to inc
e: The thick line Figure 3. Im
ositive direction beginning, bu owngrading to esponse curve ction curve.
of EPU index d with a pos alue in the el a positive am se in quantity, o negative in e. The HPP om the beginn the fourth perio
starts from th down to the th repeatedly. C rease in quan
e means the imp mpulse response
n. CSI has fa ut it has risen o the second from the beg
in Hong Kong sitive amount, leventh period mount at the e
reaches its p ninth, and h I starts from ning, and then
od and has a he beginning hird period, bu CSI starts from ntity until the s
pulse response.
e functions to E llen to
to the stage.
inning
g , then d, and end as eak in has a m the n rises
gentle to the ut then m the econd
per from dec
3 T third star dow tone and ear twe then per into risin shif
And the dotted PU index shock
iod. BSI initial m positive to clining to a gen 3.5.4. Impulse The CPI starts
d, peaks at the rts at negativ wnward in Fig.
e and then de d converges to ly period and elfth period. The
n dropped to iod, rising aga o positive perio ng from early o fting to negativ
line means 95%
ks of the Korea,
ly starts with a positive, rea ntle curve.
response of E at negative e e seventh, and ve and drop 3. The HPPI clines, then ris o zero. The HL then declines e CSI rose from
the first perio ain to the sec od in the four on, but it has ve, and then gr
% confidential int Japan, Hong Ko
a negative tone aching a pea
EPU index in C early, falls shar d then slowly de ps sharply an initially begins ses again from LPI starts from from the four m the beginnin od, and then cond period, a rth period. The
been falling in radually rising a
terval.
ong and China
e, then switch ak at 10th an
China rply, rises to t eclines. The P nd continuous s with a negati m the eighth to m negative in t rth period to t ng to the positiv
to the negativ and converting
e BSI has bee n the first perio
and falling.
es nd
he PPI sly ve ne he he ve, ve g it
en od,
50 Ji-Hong Jeon / Journal of Asian Finance, Economics and Business Vol 5 No 2 (2018) 43-52
4. Conclusions
4.1. Summary of results
In this study, we examine the impact of economic uncertainty in Korea, Japan, Hong Kong and China on the housing market in Korea from January 1999 to December 2016. In this study, uncertainty in economic policy is found in Baker et al. (2016), which is based on the EPU index of each country. The housing market in Korea uses HPPI and HLPI to know the home sale and lease price and analyses the overall housing market economy through the housing stock and financial stock index linked to house price index.
As the results of the Granger causality test, the Korea EPU index has a causal relationship valid for the rest of Korea's CPI, HPPI, HLPI, and BSI except PPI and CSI.
Japan EPU index has a causal relationship valid for Korea's HPPI, HLPI, and BSI. The Hong Kong EPU index has a causal relationship valid for all other Korean economic index variables except PPI. China EPU index has a causal relationship to all other economic index variables except CPI and PPI. This shows that all four Asian countries have a causal relationship valid for HPPI, HLPI, and BSI, which represent Korea's housing market.
In the result of VECM, Korea EPU index has a significant negative relation to all economic index except PPI. On the other hand, Japan EPU index has a significant negative relationship only for CPI and PPI. Hong Kong and China are found to have significant positive and negative relations with respect to CSI, and interesting results are obtained. We analyze the impact of the shocks proposed by Sims (1980) through economic policy uncertainties. Impulse response function shows that Korea EPU index has a significant negative response to all economic indices. On the other hand, EPU index in other countries are different.
4.2. Implications
Through this study, we examine the effect of economic uncertainty on Korea, Japan, Hong Kong, and China on the Korean housing economy. First of all, Korea's housing market is more affected by Korea than Japan, Hong Kong and China. It can be seen that the Korean housing market is more sensitive to policy changes than other countries in connection with the Korean government 's housing policy.
This study differs from the existing research as follows.
First, this study shows the economic policy uncertainty index of the Korea has the negative relationships on the housing market economy rather than other countries via VECM analysis. Second, this study has an important evidence of the spillover of several macroeconomic
indicators in Korea for the economic policy uncertainty index of the Asian four countries.
4.3. Limitations and future studies
This study can be extended to the US or European countries besides the Asian countries because it affects Korea 's housing economics on economic policy uncertainty only in four Asian countries. In addition, this study contributes to the Korean economy in that, if carefully observing economic uncertainty in Korea and other four Asian countries, the Korean economy as well as the housing market can be predicted more closely.
References
Antonakakis, N., & Floros, C. (2016). Dynamic interdependencies among the housing market, stock market, policy uncertainty and the macroeconomy in the United Kingdom. International Review of Financial Analysis, 44(1), 111-122.
Aoki, K., Proudman, J., & Vlieghe, G. (2004). House prices, consumption, and monetary policy: A financial accelerator approach. Journal of Financial Intermediation, 13(4), 414-435.
Backé, P., & Wójcik, C. (2008). Credit booms, monetary integration and the new neoclassical synthesis.
Journal of Banking & Finance, 32(3), 458-470.
Baker, S. R., Bloom, N., & Davis, S. J. (2016). Measuring economic policy uncertainty. Quarterly Journal of Economics, 131(4), 1593-1636.
Beltratti, A., & Morana, C. (2010). International house prices and macroeconomic fluctuations. Journal of Banking
& Finance, 34(3), 533-545.
Bittlingmayer, G. (1998). Output, stock volatility, and political uncertainty in a natural experiment: Germany.
Journal of Finance, 53(6), 2243-2257.
Bloom, N. (2009). The Impact of uncertainty shocks.
Econometrica, 77(3), 623-685.
Boutchkova, M., Doshi, H., Durnev, A., & Molchanov, A.
(2012). Precarious politics and return volatility.
Review of Financial Studies, 25(4), 1111-1154.
Buckley, R., & Ermisch, J. (1982). Government policy and house prices in the United Kingdom: an econometric analysis. Oxford Bulletin of Economics and Statistics, 44(4), 273-304.
Calcagno, R., Fornero, E., & Rossi, M. C. (2009). The effect of house prices on household consumption in Italy.
Journal of Real Estate Finance and Economics, 39(3), 284-300.
Campbell, J., & Cocco, J. (2007). How do house prices affect consumption? evidence from micro data.
Journal of Monetary Economics, 54(3), 591-621.
Chang, T., Chen, W., Gupta, R., & Nguyen, D. K. (2015).
Are stock prices related to the political uncertainty index in OECD countries? evidence from the bootstrap panel causality test. Economic Systems, 39(2), 288–300.
Chung, E., & Haurin, D. R. (2002). Housing choices and uncertainty: the impact of stochastic events. Journal of Urban Economics, 52(2), 193-216.
Döpke, J., & Pierdzioch, C. (2006). Politics and the stock market: evidence from Germany. European Journal of Political Economy, 22(4), 925-943.
Dougherty, A., & Order, R. V. (1982). Inflation, housing costs, and the consumer price index. American Economic Review, 72(1), 154-164.
Engle, R. F., & Granger, C. W. J. (1987). Co-integration and error correction: Representation, estimation, and testing. Econometrica, 55(2), 251-276.
Englund, P., & Ioannides, Y. M. (1997). House price dynamics: An international empirical perspective.
Journal of Housing Economics, 6(2), 119-136.
Granger, C. W. J. (1980). Testing for causality: a personal viewpoint. Journal of Economic Dynamics and Control, 2(4), 329-352.
Granger, C. W. J. (1981). Some properties of time series data and their use in econometric model specification.
Journal of Econometrics, 16(1), 121-130.
Granger, C. W. J., & Newbold, P. (1974). Spurious regression in econometrics. Journal of Econometrics, 2(1), 111-120.
Iacoviello, M., & Minetti, R. (2006). The credit channel of monetary policy: Evidence from the housing market.
Journal of Macroeconomics, 30(1), 69-96.
Johansen, S. (1988). Statistical analysis of cointegration vectors. Journal of Economic Dynamics and Control, 12(1), 231–254.
Jeon, J. (2017). The impact of economic policy uncertainty on commodity price in Korea, the U.S. and Japan.
Journal of Distribution Science, 13(1), 243-262.
Jeon, J., Lee, H., & Lee, C. (2017). Economic policy uncertainty and Korean economy: Focusing on distribution industry stock market. Journal of Distribution Science, 15(12), 41-51.
Jeong, D. (2017). Forecasting for a Credit Loan from Households in South Korea. International Journal of Industrial Distribution & Business, 8(4), 15-21.
Jian, G. (2012). An Empirical Analysis on Urban Consumption Structure in Shandong Province, China.
East Asian Journal of Business Management, 2(2), 23-26.
Julio, B., & Yook, Y. (2012). Political uncertainty and corporate investment cycles. Journal of Finance, 67(1), 45-83.
Mei, J., & Guo, L. (2004). Political uncertainty, financial crisis, and market volatility. European Financial Management, 10(4), 639–657.
Rahman, M. M. (2010). The Australian housing market- understanding the causes and effects of rising prices.
Policy Studies, 31(5), 577-590.
Sims, C. (1980). Macroeconomics and reality, Econometrica, 48(1), 1-48.
Su, D., Li, X., Lobont, O. R., & Zhao, Y. (2016). Economic policy uncertainty and housing returns in Germany:
evidence from a bootstrap rolling window. Journal of Economics and Business, 34(1), 43-61.
Wang, P., & Kim, J. (2014). The value of reverse mortgage loans: Case study of the Chinese market. Journal of Asian Finance, Economics and Business, 1(4), 5-13.
Yu, H. (2008). Government policies and housing price instability. Public Policy Review, 22(2), 74-115.
Yu, H., & Lee, S. (2010). Government housing policies and housing market instability in Korea. Habitat International, 34(2), 145-153.
Zhang, H., Li, S., & Kong, Y. (2016). Elasticity of demand for urban housing in western China Based on micro-data – A case study of Kunming. International Journal of Industrial Distribution & Business, 7(3), 27-36.