INTRODUCTION
Nonalcoholic fatty liver disease (NAFLD) is one of the most co- mmon causes of liver disease in the Western population and is
becoming more prevalent. The presentation of NAFLD varies from simple fatty liver to nonalcoholic steatohepatitis that po- tentially progress to cirrhosis. Several studies have indicated that NAFLD is closely associated with several metabolic disor- ders including obesity, diabetes mellitus, dyslipidemia, and hy- pertension,1-3 which have all been recognized as risk factors for cardiovascular disease, and a recent study associated NAFLD with coronary artery disease (CAD).4 Moreover, NAFLD is asso- ciated with greater overall mortality and independent predic- tors of the risk of future cardiovascular disease (CVD) events.5 There are few cross-sectional studies on the association be- tween NAFLD and CAD, and the studies that were performed evaluated only coronary calcification or the presence of coro- nary artery stenosis in individuals of clinically suspected CAD.4,6 The CAD risk of NAFLD is worth particular attention
Nonalcoholic Fatty Liver Disease Is Associated with the Presence and Morphology of Subclinical Coronary Atherosclerosis
Min Kyoung Kang1, Byeong Hun Kang2, and Jong Ho Kim1
1Emergency Care Center, Soonchunhyang University Cheonan Hospital, Cheonan;
2Department of Orthopaedic Surgery, Gyeongsang National University Hospital, Jinju, Korea.
Purpose: In this study, we aimed to evaluate whether nonalcoholic fatty liver disease (NAFLD) was associated with the presence and morphology of coronary atherosclerotic plaques shown by multidetector computed tomography (MDCT) in asymptomatic subjects without a history of cardiovascular disease.
Materials and Methods: We retrospectively enrolled 772 consecutive South Korean individuals who had undergone both dual- source 64-slice MDCT coronary angiography and hepatic ultrasonography during general routine health evaluations. The MDCT studies were assessed for the presence, morphology (calcified, mixed, and non-calcified), and severity of coronary plaques.
Results: Coronary atherosclerotic plaques were detected in 316 subjects (40.9%) by MDCT, and NAFLD was found in 346 subjects (44.8%) by hepatic ultrasonography. Subjects with NAFLD had higher prevalences of all types of atherosclerotic plaque and non- calcified, mixed, and calcified plaques than the subjects without NAFLD. However, the prevalence of significant stenosis did not dif- fer between groups. After adjusting for age, smoking status, diabetes mellitus, hypertension, dyslipidemia, and metabolic syndrome, NAFLD remained a significant predictor for all types of coronary atherosclerotic plaque [odds ratio (OR): 1.48; 95% confidence in- terval (CI): 1.05–2.08; p=0.025] in binary logistic analysis, as well as for calcified plaques (OR: 1.70; 95% CI: 1.07–2.70; p=0.025) in multinomial regression analysis.
Conclusion: Our study demonstrated that NAFLD was significantly associated with the presence and the calcified morphology of coronary atherosclerotic plaques detected by MDCT. Further prospective clinical studies are needed to clarify the exact physio- pathologic role of NAFLD in coronary atherosclerosis.
Key Words: Nonalcoholic fatty liver disease, subclinical coronary atherosclerosis, metabolic syndrome, multidetector computed tomography
Yonsei Med J 2015 Sep;56(5):1288-1295
http://dx.doi.org/10.3349/ymj.2015.56.5.1288 pISSN: 0513-5796 · eISSN: 1976-2437
Received: June 25, 2014 Revised: October 10, 2014 Accepted: October 17, 2014
Corresponding author: Dr. Jong Ho Kim, Emergency Care Center, Soonchunhyang University Cheonan Hospital, 31 Suncheonhyang 6-gil, Dongnam-gu, Cheonan 330- 721, Korea.
Tel: 82-41-570-3913, Fax: 82-41-570-3924, E-mail: [email protected]
•The authors have no financial conflicts of interest.
© Copyright: Yonsei University College of Medicine 2015
This is an Open Access article distributed under the terms of the Creative Com- mons Attribution Non-Commercial License (http://creativecommons.org/ licenses/
by-nc/3.0) which permits unrestricted non-commercial use, distribution, and repro- duction in any medium, provided the original work is properly cited.
to the screening and surveillance strategies from the perspec- tive of the increase in patients with NAFLD.
Atherosclerosis, an asymptomatic process that begins early in life, eventually leads to overt coronary heart disease (CHD).
Multidetector computed tomography (MDCT) coronary angi- ography is a non-invasive method that provides a direct ana- tomic assessment of coronary arteries to allow detailed exam- ination of coronary atherosclerosis, and it can also give add- itional information regarding plaque composition and the se- verity of coronary atherosclerosis.7-9
In the present study, we aimed to assess the relationship of NAFLD, as determined by ultrasonography, with subclinical coronary stenosis and plaque morphology, as detected by du- al-source 64-slice MDCT, in asymptomatic subjects without a history of CVD.
MATERIALS AND METHODS
Study subjects
A retrospective review was performed using data from 1034 self-referred subjects who had undergone both 64-slice MDCT coronary angiography and hepatic ultrasonography as part of a general routine health evaluation at CHA Bundang Medical Center between March 2007 and December 2010. Participants were excluded if they had a history of myocardial infarction or stroke (n=1), coronary artery bypass surgery (n=1), malignan- cy (n=1), positive hepatitis B surface antigen or anti-hepatitis C antibody (n=30), habitual consumption of >20 g/day of al- cohol (n=208), or insufficient medical records (n=21). Ulti- mately, 772 subjects were enrolled in this study. The Institu- tional Review Board of CHA Bundang Medical Center approved the study protocol.
Basic demographic data were acquired from a database maintained by the Health Promotion Center at CHA Bundang Medical Center. Medical history of myocardial infarction, an- gina, hypertension, stroke, diabetes mellitus, and tobacco use, as well as each patient’s current medication profile, was collect- ed from a systemized questionnaire prior to a general health examination. Body weight, height, waist circumference, and blood pressure were also measured during their visit. Hyper- tension was defined as a self-reported history of hypertension, the use of antihypertensive medication, or a blood pressure of
≥140/90 mm Hg. Total cholesterol, triglycerides, high-density lipoprotein (HDL) cholesterol, low-density lipoprotein (LDL) cholesterol, fasting plasma glucose, serum uric acid, alkaline phosphatase (ALP), aminotransferase, total bilirubin, and ga- mma glutamyl transferase (GGT) were measured after at least a 12-hour fasting period on the same day of the study. Diabetes was defined as a self-reported history of diabetes, the use of antidiabetic treatment, or a fasting plasma glucose level of ≥126 mg/dL. The mean age of the subjects was 49.2±9.8 years, and the mean body mass index (BMI) was 24.1±3.1 kg/m2. In addi-
tion, 68.0% of subjects were males, 215 (27.8%) were hyperten- sive, and 73 (9.5%) had diabetes. There were 202 current smok- ers (26.2%), of whom 97.5% were males.
Metabolic syndrome was defined based on the National Cholesterol Education Program Adult Treatment Panel Phase III (NCEP-ATP III) criteria, with a modification for the cutoff of waist circumference. Subjects with at least three of the follow- ing criteria were considered to have metabolic syndrome: 1) central obesity by waist circumference (>90 cm in men, >80 cm in women), 2) hypertriglyceridemia (≥150 mg/dL), 3) low HDL- cholesterol (<40 mg/dL in men, <50 mg/dL in women), 4) high blood pressure (≥130/85 mm Hg), and 5) elevated fasting plas- ma glucose (≥100 mg/dL). Framingham risk scores (FRS), as used by the National Cholesterol Education Program (NCEP) guidelines, were calculated, and the 10-year risks of coronary events were estimated.10 All subjects were assigned to three dif- ferent CHD risk groups according to the revised NCEP guide- lines: a high-risk CHD group (CHD equivalents or a 10-year risk
>20%), a moderate-risk group (more than two risk factors and a 10-year risk ≤20%), and a low-risk group (0 to 1 risk factors).
Hepatic ultrasonography
A liver ultrasound was performed to assess the presence and severity of NAFLD using a high-resolution B-mode ultrasound machine (LOGIQ S6; Siemens, Munich, Germany). The degree of steatosis was assessed semiquantitatively (absent, mild, moderate, or severe) on the basis of hepatorenal echogenicity contrast, liver brightness, deep attenuation, and vascular blur- ring.11,12
Multidetector computed tomography
Non-enhanced CT was performed to measure coronary artery calcium (CAC) score on a 64-slice MDCT scanner (Light-speed VCT, GE Healthcare Systems, Waukesha, WI, USA). The scan- ning parameters of CAC CT were prospective electocardiogra- phy (ECG) gating, 120 kV tube voltage, 200 mA tube current, 175 ms temporal resolution, and 3 mm slice thickness. Calcifi- cation in the coronary artery was deemed present if there was a high density corresponding to the coronary arterial wall of
>130 Hounsfield units (HU) using Agatston’s method. The presence or absence of descending thoracic aortic calcifica- tion was also analyzed using the same method. Z-axis cover- age of CAC CT was from the tracheal carina to the base of the heart. Contrast-enhanced coronary CTA was performed using variable kV and mA based on each patient’s BMI. Tube volt- age and current were 120 kV and 550 mA in patients with a high BMI (≥25 kg/m2) and 100 kV and 500 mA in patients with a low BMI (<25 kg/m2), respectively. Other scanning parame- ters for coronary CTA included 0.625 mm slice thickness, 32 cm field of view, 165 ms temporal resolution, 0.625 mm re- construction interval, and 7–11 s scanning time. Retrospec- tively-ECG-gated contrast enhancement was performed after intravenous injection of 50–80 mL Optiray (Ioversol 300 mg/
mL, Tyco Healthcare, Montreal, Canada). The volume of con- trast media was adapted to match each body weight with a constant dose of iodine per body weight (0.5 g iodine per kilo- gram). To achieve a constant injection duration of 30 seconds, the flow rate was adjusted accordingly. A saline chaser bolus of 50 mL was subsequently injected at the same flow rate. A trigger delay of 5 s and bolus tracking of the contrast material were used. Scanning commenced 5 s after the CT attenuation reached 100 HU in the ascending aorta. Tube current modu- lation was used in patients to reduce the radiation dose. Sub- jects with a heart rate >65 beats/min were given beta-blocker (Propranolol 40–80 mg, Hyundae Pharmaceutical Co., Seoul, Korea) before MDCT imaging. Each subject was also given ni-
troglycerin (0.6 mg, Myungmun Parmaceutical Co., Seoul, Korea) sublingually 1 min before MDCT.
MDCT coronary angiography images were analyzed on an Advantage Workstation 4.3 (GE Healthcare Systems) by two experienced radiologists who were unaware of the clinical in- formation. Each lesion was identified with a multiplanar re- construction technique and maximum intensity projections of short-axis, 2-chamber, and 4-chamber views. The contrast- enhanced portion of the coronary lumen was semi-automati- cally traced at the maximal stenotic site, and the degree of ste- nosis in the maximal stenotic site was compared with the average diameters of proximal and distal reference sites. Non- significant coronary atherosclerotic plaque was defined as le- Table 1. Clinical and Biochemical Characteristics of Subjects Having Normal Coronary Arteries and Non-Significant and Significant Stenosis of the Coronary Arteries
Normal coronary arteries Non-significant stenosis Significant stenosis p value
n (total=772) 456 240 76
Age (yrs) 45.8±8.4 52.9±9.2 58.3±9.1 <0.001
Gender: male, n (%) 280 (61.4) 184 (76.7) 61 (80.3) <0.001
Hypertension, n (%) 85 (18.6) 93 (38.8) 37 (48.7) <0.001
Diabetes mellitus, n (%) 21 (4.6) 34 (14.2) 18 (23.7) <0.001
Currently smoking (%) 97 (21.3) 76 (31.7) 29 (38.2) <0.001
Body mass index (kg/m2) 23.6±3.2 24.9±3.1 24.2±2.4 <0.001
Waist circumference (cm) 84.7±8.9 88.9±8.5 88.9±7.4 <0.001
Systolic blood pressure (mm Hg) 114.6±13.7 119.8±15.3 123.1±14.2 <0.001
Diastolic blood pressure (mm Hg) 71.7±11.5 75.8±12.3 75.8±11.1 <0.001
Fasting plasma glucose (mg/L) 95.3±14.0 101.7±19.5 108.1±32.1 <0.001
Uric acid (mg/dL) 5.2±1.4 5.4±1.3 5.6±1.4 0.018
Total cholesterol (mg/dL) 191.3±33.2 195.6±38.3 197.6±40.5 0.168
Triglycerides (mg/dL) 123.1±70.7 135.9±76.8 140.5±91.9 0.007
HDL cholesterol (mg/dL) 51.1±13.0 49.0±10.9 47.4±9.9 0.012
LDL cholesterol (mg/dL) 115.9±31.1 120.0±34.7 122.7±31.6 0.115
Total bilirubin 4.7±0.5 4.8±0.5 4.8±0.5 0.989
AST (IU/L) 21.7±7.9 23.9±10.0 23.1±7.5 0.005
ALT (IU/L) 25.6±15.9 30.6±19.8 25.0±10.4 <0.001
GGT (IU/L) 27.6±23.2 33.7±27.1 29.8±16.8 <0.001
ALP (IU/L) 160.4±42.4 171.2±46.9 170.2±43.9 0.005
10-yr CHD risk by Framingham risk scoring 5.1±5.8 9.2±7.2 11.1±6.7 <0.001
CHD risk groups by NCEP, n (%) <0.001
Low-risk group 279 (61.2) 80 (33.3) 14 (18.4)
Moderate-risk group 146 (32.0) 105 (43.8) 39 (51.3)
High-risk group 31 (6.8) 55 (22.9) 23 (31.3)
Coronary calcium score <0.001
0 447 (98.2) 85 (35.7) 16 (21.1)
1–100 8 (1.8) 128 (53.8) 35 (46.1)
>100 0 (0.0) 25 (10.5) 25 (32.9)
Metabolic syndrome, n (%) 94 (20.6) 81 (33.8) 32 (42.1) <0.001
NAFLD, n (%) 0.001
Mild 89 (19.5) 64 (26.7) 27 (35.5)
Moderate and severe 84 (18.4) 67 (27.9) 15 (19.7)
HDL, high-density lipoprotein; LDL, low-density lipoprotein; AST, aspartate aminotransferase; ALT, alanine aminotransferase; GGT, gamma glutamyl transferase;
ALP, alkaline phosphatase; CHD, coronary heart disease; NCEP, National Cholesterol Education Program; NAFLD, nonalcoholic fatty liver disease.
sions causing ≤50% luminal narrowing, and significant coro- nary atherosclerotic plaque was defined as lesions causing
>50% luminal narrowing.
We analyzed plaque characteristics according to the modi- fied American Heart Association classification.13 Plaques were defined as structures >1 mm2 within or adjacent to the vessel lumen, which could clearly be distinguished from the lumen and surrounding pericardial tissue. Plaques occupied by cal- cified tissue comprising more than 50% of the plaque area (de- nsity >130 HU in native scans) were classified as calcified, pla- ques with <50% calcium were classified as mixed, and plaques without any calcium were classified as non-calcified lesions.
Subjects were stratified into subgroups having primarily mixed plaque (defined as a mixed component >70% of all plaque ar-
ea), non-calcified plaque (defined as a non-calcified compo- nent >70% of all plaque area), and calcified plaque (defined as a calcified component >70% of all plaque area).
Coronary artery calcium scores (CACS) were measured with the scoring system previously described by Agatston, et al.14 Participants were categorized on the basis of the CACS in the following manner: no calcification, 0; mild calcification, 0.1 to 100; and moderate-to-severe calcification, >100.
Statistical analysis
Statistical analyses were performed using the Statistical Pack- age for the Social Sciences software (SPSS Inc., version 19.0;
Chicago, IL, USA). The categorical variables were reported as numbers with percentage, and the continuous variables were Table 2. Clinical and Biochemical Characteristics of Subjects Having Mixed, Non-Calcified, and Calcified Plaques
Calcified plaque Mixed plaque Non-calcified plaque p value
n (total=316) 122 82 112
Age (yrs) 55.4±9.8 55.8±10.1 51.6±8.1 0.001
Gender: male, n (%) 97 (79.5) 64 (78.0) 84 (75.0) 0.412
Hypertension, n (%) 55 (45.1) 37 (45.1) 38 (33.9) 0.087
Diabetes mellitus, n (%) 29 (23.8) 9 (11.0) 14 (12.5) 0.019
Currently smoking (%) 44 (36.1) 26 (31.7) 35 (31.3) 0.431
Body mass index (kg/m2) 24.9±2.9 24.6±2.7 24.6±3.1 0.710
Waist circumference (cm) 89.2±8.5 88.5±7.6 88.8±8.5 0.846
Systolic blood pressure (mm Hg) 121.9±14.6 124.9±15.4 116.0±14.2 <0.001
Diastolic blood pressure (mm Hg) 76.4±11.7 78.6±11.4 73.2±12.2 0.006
Fasting plasma glucose (mg/L) 106.3±3.7 99.5±16.0 102.7±25.6 0.125
Uric acid (mg/dL) 5.6±1.3 5.6±1.4 5.2±1.4 0.065
Total cholesterol (mg/dL) 192.8±36.1 199.3±41.4 197.2±39.8 0.464
Triglycerides (mg/dL) 135.3±72.9 139.8±90.7 136.8±81.2 0.926
HDL cholesterol (mg/dL) 48.7±10.7 48.4±12.0 48.8±9.6 0.963
LDL cholesterol (mg/dL) 118.1±32.1 122.8±35.6 121.8±34.9 0.565
Total bilirubin 0.82±0.35 0.83±0.33 0.82±0.38 0.974
AST (IU/L) 23.8±10.3 23.8±8.3 23.6±9.3 0.982
ALT (IU/L) 30.6±21.1 27.2±12.2 29.3±18.3 0.433
GGT (IU/L) 31.1±19.4 33.3±23.6 34.2±31.1 0.631
ALP (IU/L) 174.5±45.6 165.3±43.4 171.2±48.6 0.386
10-yr CHD risk by Framingham risk scoring 9.8±6.6 11.3±8.3 8.2±6.5 0.009
CHD risk groups by NCEP, n (%) 0.019
Low-risk group 32 (26.2) 21 (25.6) 41 (36.6)
Moderate-risk group 55 (45.1) 36 (43.9) 53 (47.3)
High-risk group 35 (28.7) 25 (30.5) 18 (16.1)
Coronary calcium score <0.001
0 7 (5.8) 1 (1.2) 93 (83.8)
1–100 83 (68.6) 64 (78.0) 16 (14.4)
>100 31 (25.6) 17 (20.7) 2 (1.8)
Metabolic syndrome, n (%) 47 (38.5) 32 (39.0) 34 (30.4) 0.199
NAFLD, n (%) 0.582
Mild 40 (32.8) 20 (24.4) 31 (27.7)
Moderate and severe 32 (26.2) 21 (25.6) 29 (25.9)
HDL, high-density lipoprotein; LDL, low-density lipoprotein; AST, aspartate aminotransferase; ALT, alanine aminotransferase; GGT, gamma glutamyl transferase;
ALP, alkaline phosphatase; CHD, coronary heart disease; NCEP, National Cholesterol Education Program; NAFLD, nonalcoholic fatty liver disease.
reported as the mean±standard deviation. Student’s t-test, the chi-square test, and ANOVA were used for assessing the inter- group comparison. Logistic regression analysis was performed as appropriate to decide the factors related to coronary athero- sclerosis, with consideration of cardiovascular risk factors such as increased age (men over 45 years old, women over 55 years old), tobacco use, hypertension, diabetes mellitus, high LDL cholesterol (>160 mg/dL in the low-risk group, >130 mg/dL in the moderate-risk group, and >100 mg/dL in the high-risk gro- up), low HDL-cholesterol (<40 mg/dL in men, <50 mg/dL in women), metabolic syndrome, and NAFLD. Each odds ratio (OR) was presented together with its 95% confidence interval (CI). A p-value of <0.05 was considered statistically significant.
RESULTS
Significant coronary plaques were detected in 76 subjects (9.8
%). The percentage of patients with non-significant plaques was 31.1% (n=240), and normal coronary arteries were found in 456 patients (59.1%). The baseline characteristics of subjects with normal coronary arteries, non-significant stenosis, and significant stenosis detected by MDCT are shown in Table 1.
The prevalence of hypertension (18.6%, 38.8%, and 48.7%, re- spectively; p<0.001), diabetes mellitus (4.6%, 14.2%, and 23.7%, respectively; p<0.001), metabolic syndrome (20.6%, 33.8%, and 42.1%, respectively; p<0.001), and NAFLD (37.9%, 54.6%, and 55.3%, respectively; p=0.001) increased significantly with the severity of coronary atherosclerosis. Significant differences be- tween groups were noted regarding the distribution of males and current smoking history, age, BMI, waist circumference, systolic blood pressure, diastolic blood pressure, fasting plas- ma glucose, serum uric acid, triglycerides, HDL cholesterol, aspartate aminotransferase (AST), alanine aminotransferase (ALT), GGT, ALP, and 10-year CHD risk by FRS. However, total cholesterol, LDL cholesterol, and total bilirubin did not change with the severity of coronary atherosclerosis.
Among 772 patients, 316 (40.9%) had atherosclerotic plaques in coronary arteries. Of them, 122 (15.8%) patients had calci- fied plaques, 82 (10.6%) had mixed plaques, and 112 (14.5%) had non-calcified plaques (Table 2). The prevalences of dia- betes, age, systolic/diastolic blood pressure, and 10-year CHD risk by FRS were different between groups. There was no signif- icant difference in the prevalence of NAFLD according to pla- que morphology between the primarily calcified, mixed, and non-calcified coronary atherosclerotic plaque groups (59.0%, 50.0%, and 53.6%, respectively; p=0.392).
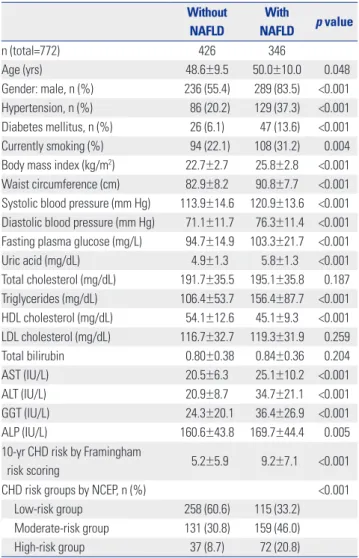
Table 3 shows the associations of NAFLD with clinical and biological variables in subjects. Age, gender distribution, the prevalences of hypertension and diabetes, smoking history, BMI, waist circumference, systolic/diastolic blood pressure, fasting plasma glucose, serum uric acid, triglyceride levels, HDL cholesterol, AST, ALT, GGT, ALP, and 10-year CHD risk by FRS
were significantly different between subjects with and without NAFLD. However, the levels of total cholesterol, LDL choles- terol, and total bilirubin were similar between the two groups.
Coronary atherosclerotic plaques were detected in 143 pa- tients (33.6%) among those without NAFLD and in 173 (50.0%) among those with NAFLD. NAFLD subjects had a higher prev- alence of calcified, mixed, and non-calcified plaque than the subjects without NAFLD. There was no significant difference in the prevalence of significantly-stenosed coronary arteries according to the presence of NAFLD (8.0% vs. 12.1%; p=0.054) (Table 4).
The results of binary logistic regression analysis to determine the presence of coronary atherosclerotic plaque are represent- ed in Table 5. Increased age (OR: 3.46; 95% CI: 2.48–4.84; p<
0.001), diabetes mellitus (OR: 2.33; 95% CI: 1.30–4.17; p=0.005), hypertension (OR: 1.89; 95% CI: 1.28–2.79; p=0.001), low HDL cholesterol (OR: 0.58; 95% CI: 0.38–0.89; p=0.013), and NAFLD Table 3. Clinical and Biochemical Characteristics among Those with and without NAFLD
Without NAFLD
With
NAFLD p value
n (total=772) 426 346
Age (yrs) 48.6±9.5 50.0±10.0 0.048
Gender: male, n (%) 236 (55.4) 289 (83.5) <0.001 Hypertension, n (%) 86 (20.2) 129 (37.3) <0.001 Diabetes mellitus, n (%) 26 (6.1) 47 (13.6) <0.001 Currently smoking (%) 94 (22.1) 108 (31.2) 0.004 Body mass index (kg/m2) 22.7±2.7 25.8±2.8 <0.001 Waist circumference (cm) 82.9±8.2 90.8±7.7 <0.001 Systolic blood pressure (mm Hg) 113.9±14.6 120.9±13.6 <0.001 Diastolic blood pressure (mm Hg) 71.1±11.7 76.3±11.4 <0.001 Fasting plasma glucose (mg/L) 94.7±14.9 103.3±21.7 <0.001
Uric acid (mg/dL) 4.9±1.3 5.8±1.3 <0.001
Total cholesterol (mg/dL) 191.7±35.5 195.1±35.8 0.187 Triglycerides (mg/dL) 106.4±53.7 156.4±87.7 <0.001 HDL cholesterol (mg/dL) 54.1±12.6 45.1±9.3 <0.001 LDL cholesterol (mg/dL) 116.7±32.7 119.3±31.9 0.259
Total bilirubin 0.80±0.38 0.84±0.36 0.204
AST (IU/L) 20.5±6.3 25.1±10.2 <0.001
ALT (IU/L) 20.9±8.7 34.7±21.1 <0.001
GGT (IU/L) 24.3±20.1 36.4±26.9 <0.001
ALP (IU/L) 160.6±43.8 169.7±44.4 0.005
10-yr CHD risk by Framingham
risk scoring 5.2±5.9 9.2±7.1 <0.001
CHD risk groups by NCEP, n (%) <0.001
Low-risk group 258 (60.6) 115 (33.2)
Moderate-risk group 131 (30.8) 159 (46.0)
High-risk group 37 (8.7) 72 (20.8)
HDL, high-density lipoprotein; LDL, low-density lipoprotein; AST, aspartate ami- notransferase; ALT, alanine aminotransferase; GGT, gamma glutamyl transfer- ase; ALP, alkaline phosphatase; CHD, coronary heart disease; NCEP, National Cholesterol Education Program; NAFLD, nonalcoholic fatty liver disease.
(OR: 1.48; 95% CI: 1.05–2.08; p=0.025) remained significant pre- dictors of the presence of coronary atherosclerotic plaque af- ter adjusting for major risk factors for cardiovascular disease.
In contrast, the other binary logistic regression analysis showed no association between NAFLD and the presence of signifi- cantly-stenosed coronary artery segments determined by MDCT coronary angiography; however, increased age (OR:
4.84; 95% CI: 2.48–9.44; p<0.001) and diabetes (OR: 2.07; 95%
CI: 1.09–3.94; p=0.027) remained significant predictors.
In the multinomial logistic regression analysis, increased age (OR: 2.23; 95% CI: 1.41–3.51; p=0.001), low HDL cholesterol (OR: 0.52; 95% CI: 0.29–0.92; p=0.026), and high LDL choles- terol (OR: 1.63; 95% CI: 1.01–2.64; p=0.046) seemed significant predictors of primarily non-calcified plaques after adjustment for other risk factors. NAFLD was not a significant predictor of non-calcified plaques in multinomial logistic regression (p=
0.053). Increased age (OR: 4.88; 95% CI: 2.74–8.70; p<0.001) and hypertension (OR: 2.24; 95% CI: 1.27–3.98; p=0.006) remained significant predictors of primarily mixed plaques. NAFLD was
not a significant predictor of mixed plaque in multinomial lo- gistic regression, with similar results for non-calcified plaque (p=0.691). In contrast to non-calcified and mixed plaques, cal- cified plaque appeared to be significantly predicted by NAFLD (OR: 1.70; 95% CI: 1.07–2.70; p=0.03). Increased age (OR: 4.47;
95% CI: 2.73–7.31; p<0.001), diabetes mellitus (OR: 3.60; 95%
CI: 1.85–7.04; p<0.001), and hypertension (OR: 2.04; 95% CI:
1.22–3.40; p=0.006) remained significant predictors of primar- ily calcified coronary plaque (Table 6).
DISCUSSION
To the best of our knowledge, our study is the first to report on the association of NAFLD with subclinical coronary stenosis and plaque morphology using MDCT coronary angiography in a large middle-aged sample of asymptomatic individuals with- out a history of CVD. Our results demonstrated that NAFLD was associated with the presence and calcific morphology of coronary atherosclerotic plaque.
Few studies have documented the independent relation be- tween NAFLD and cardiovascular disease.15,16 An association between NAFLD and inflammatory markers including tumor necrosis factor (TNF)-α, interleukin (IL)-6, and C-reactive pro- Table 4. Analysis of MDCT Coronary Angiography among Those with and
without NAFLD
MDCT coronary angiography Without NAFLD
With
NAFLD p value Any plaque, n (%) 143 (33.6) 173 (50.0) <0.001
Plaque subtypes, n (%) <0.001
Calcified plaque 50 (11.7) 72 (20.8)
Mixed plaque 41 (9.6) 41 (11.8)
Non-calcified plaque 52 (12.2) 60 (17.3)
Significant stenosis, n (%) 34 (8.0) 42 (12.1) 0.054 Number of significantly stenosed
vessels, n (%) 0.021
1 27 (6.3) 27 (7.8)
2–3 7 (1.6) 15 (4.3)
Coronary calcium score, n (%) 0.001
0 323 (76.2) 225 (65.1)
1–100 79 (18.6) 92 (26.7)
>100 22 (5.2) 28 (8.1)
MDCT, multidetector computed tomography; NAFLD, nonalcoholic fatty liver disease.
Table 5. Binary Logistic Regression Analysis for the Presence of Any Type of Atherosclerotic Plaque and Significant Stenosis of Coronary Arteries
Variable Any plaque Significant stenosis OR (95% CI) p value OR (95% CI) p value Increase age 3.46 (2.48–4.84) <0.001 4.84 (2.48–9.44) <0.001 Diabetes mellitus 2.33 (1.30–4.17) 0.005 2.07 (1.09–3.94) 0.027 Hypertension 1.89 (1.28–2.79) 0.001 1.66 (0.95–2.91) 0.078 Low HDL cholesterol 0.58 (0.38–0.89) 0.013 0.93 (0.49–1.76) 0.822 High LDL cholesterol 1.44 (1.00–2.07) 0.053 1.14 (0.68–1.93) 0.621 Smoking status 1.19 (0.83–1.72) 0.349 1.23 (0.73–2.09) 0.435 Metabolic syndrome 1.39 (0.86–2.22) 0.177 1.26 (0.64–2.46) 0.499 NAFLD 1.48 (1.05–2.08) 0.025 1.07 (0.73–2.09) 0.435 OR, odds ratio; CI, confidential interval; HDL, high-density lipoprotein; LDL, low-density lipoprotein; NAFLD, nonalcoholic fatty liver disease.
Table 6. Multinomial Logistic Regression Analysis for the Presence of Calcified, Mixed, and Non-Calcified Atherosclerotic Plaques
Variable Calcified plaque Mixed plaque Non-calcified plaque
OR (95% CI) p value OR (95% CI) p value OR (95% CI) p value
Increased age 4.47 (2.73–7.31) <0.001 4.88 (2.74–8.70) <0.001 2.23 (1.41–3.51) 0.001
Diabetes mellitus 3.60 (1.85–7.04) <0.001 1.37 (0.57–3.27) 0.486 1.88 (0.88–4.00) 0.103
Hypertension 2.04 (1.22–3.40) 0.006 2.24 (1.27–3.98) 0.006 1.53 (0.91–2.59) 0.111
Low HDL cholesterol 0.51 (0.29–0.93) 0.027 0.81 (0.43–1.53) 0.514 0.52 (0.29–0.92) 0.026
High LDL cholesterol 1.11 (0.68–1.82) 0.675 1.68 (0.98–2.86) 0.058 1.63 (1.01–2.64) 0.046
Smoking status 1.26 (0.78–2.04) 0.345 1.09 (0.62–1.90) 0.769 1.18 (0.73–1.92) 0.496
Metabolic syndrome 1.44 (0.77–2.67) 0.253 1.48 (0.71–2.87) 0.316 1.31 (0.70–2.45) 0.396
NAFLD 1.70 (1.07–2.70) 0.025 1.11 (0.62–1.90) 0.691 1.57 (1.00–2.48) 0.053
OR, odds ratio; CI, confidential interval; HDL, high-density lipoprotein; LDL, low-density lipoprotein; NAFLD, nonalcoholic fatty liver disease.
tein (CRP) was found, which indicates that NAFLD may con- tribute to the inflammatory CVD milieu, predisposing to ath- erosclerosis and CVD.17-19 In addition to a direct predisposition to atherosclerosis, cytokines may have an indirect effect as well, as cytokines may be involved in insulin resistance. The pleiotropic cytokine TNF-α interferes with the hepatic insulin receptor and the intrahepatocellular insulin signaling, causing both hepatic and systemic insulin resistance.20,21
Recent studies have demonstrated that NAFLD is correlated with circulatory endothelial dysfunction, which is accepted as an early process in the development of atherosclerosis.22,23 It has been shown that non-diabetic patients with NAFLD have a significant decrease in flow-mediated vasodilation of bra- chial arteries (a surrogate measure of endothelial dysfunction) when compared with matched healthy controls, and this de- crease correlated to histological features of NAFLD, indepen- dent of age, sex, BMI, homeostatic model assessment-insulin resistance (HOMA)-insulin resistance, and other metabolic syn- drome components.24 Further accumulating evidence also ex- ists demonstrating that patients with NAFLD had a marked increase in carotid artery intima-media thickness (IMT), a reli- able index of subclinical atherosclerosis.25-28 In our study, NAFLD was found to be associated with the presence of CAD, though not with the severity. Increased age and diabetes melli- tus appeared to be significant predictors of the severity of coro- nary atherosclerotic plaque after adjustment of other risk fac- tors. The present study investigated asymptomatic subjects without a history of CVD; therefore, most of the study popula- tion was extremely low-risk (63.9% CACS=0), and the majority of coronary atherosclerosis was insignificant coronary stenosis.
MDCT coronary angiography has a high diagnostic accura- cy in appropriate patients and has been proposed as an im- portant non-invasive modality for detecting CAD. The cumu- lative adverse cardiac events rates over 21 months in patients with normal coronary arteries, non-significant CAD, and sig- nificant CAD have been reported as 0.5%, 3.5%, and 16%, re- spectively.8 Beyond the degree of luminal narrowing of the coronary artery, MDCT coronary angiography can character- ize plaque composition, which can give valuable data about the various clinical manifestations of CAD. A recent study reported that younger age, hyperlipidemia, and a family history of CAD are all predictors of the extent of non-calcified plaque and that older age was significantly associated with the presence of mixed and calcified plaque.9 Our study revealed that, in addi- tion to older age, diabetes mellitus, high LDL cholesterol, and NAFLD were associated with the presence of calcified plaques according to the multivariate regression analysis. NAFLD was not associated with non-calcified or mixed plaques. However, calcified plaques do not represent the entire atherosclerotic burden of coronary arteries, and non-calcified plaques, indic- ative of lipid-rich and vulnerable plaques, are associated with acute coronary syndrome more than calcified plaques.7 In a prospective study by Wong, et al.,29 fatty liver was associated
with CAD independently in patients with clinical indications for coronary angiogram. However, in patients with CAD, fatty liver cannot predict adverse clinical outcomes such as cardio- vascular mortality, non-fatal myocardial infarction, and the need for further coronary intervention. Our study results were in line with such previous studies, revealing an independent association between NAFLD and CAD.
A number of limitations of this study must be acknowledged, including the cross-sectional observational design with the lack of randomization and the retrospective descriptive na- ture of the study. All participants underwent a single mea- surement of all values. Although hepatitis B and C viruses and suspicious alcoholic hepatitis were excluded, we did not com- pletely exclude other types of liver disease, such as autoim- mune hepatitis, although the prevalence is low in Korea. Due to racial differences between the prevalence, extent, and mor- phology of coronary atherosclerosis, these findings cannot be generalized to all populations. All participants took part in a general routine health evaluation, and MDCT coronary angi- ography is a costly examination. Hence, a selection bias could be inherent.
In conclusion, our study revealed that NAFLD was associat- ed with both the presence and the calcified-plaque morpholo- gy of subclinical coronary atherosclerosis detected by MDCT.
Thus, in addition to traditional risk factors of CAD and subclin- ical atherosclerosis, NAFLD seems to be independently asso- ciated with the presence of coronary atherosclerotic plaque.
Moreover, NAFLD is associated with calcific coronary plaque, which is an independent predictor of CAD and cardiovascular outcome. Further prospective clinical studies are needed to clarify the exact physiopathologic role of NAFLD in coronary atherosclerosis.
REFERENCES
1. Hsiao TJ, Chen JC, Wang JD. Insulin resistance and ferritin as ma- jor determinants of nonalcoholic fatty liver disease in apparently healthy obese patients. Int J Obes Relat Metab Disord 2004;28:167- 72.
2. Suzuki A, Angulo P, Lymp J, St Sauver J, Muto A, Okada T, et al.
Chronological development of elevated aminotransferases in a nonalcoholic population. Hepatology 2005;41:64-71.
3. Bedogni G, Miglioli L, Masutti F, Tiribelli C, Marchesini G, Bellen- tani S. Prevalence of and risk factors for nonalcoholic fatty liver disease: the Dionysos nutrition and liver study. Hepatology 2005;
42:44-52.
4. Chen CH, Nien CK, Yang CC, Yeh YH. Association between non- alcoholic fatty liver disease and coronary artery calcification. Dig Dis Sci 2010;55:1752-60.
5. Adams LA, Lymp JF, St Sauver J, Sanderson SO, Lindor KD, Feld- stein A, et al. The natural history of nonalcoholic fatty liver disease:
a population-based cohort study. Gastroenterology 2005;129:113- 21.
6. Adibi P, Sadeghi M, Mahsa M, Rozati G, Mohseni M. Prediction of coronary atherosclerotic disease with liver transaminase level. Liv- er Int 2007;27:895-900.
7. Hoffmann U, Moselewski F, Nieman K, Jang IK, Ferencik M, Rah- man AM, et al. Noninvasive assessment of plaque morphology and composition in culprit and stable lesions in acute coronary syn- drome and stable lesions in stable angina by multidetector com- puted tomography. J Am Coll Cardiol 2006;47:1655-62.
8. Abdulla J, Asferg C, Kofoed KF. Prognostic value of absence or pres- ence of coronary artery disease determined by 64-slice computed tomography coronary angiography a systematic review and meta- analysis. Int J Cardiovasc Imaging 2011;27:413-20.
9. Bamberg F, Dannemann N, Shapiro MD, Seneviratne SK, Feren- cik M, Butler J, et al. Association between cardiovascular risk pro- files and the presence and extent of different types of coronary ath- erosclerotic plaque as detected by multidetector computed tomography. Arterioscler Thromb Vasc Biol 2008;28:568-74.
10. National Cholesterol Education Program (NCEP) Expert Panel on Detection, Evaluation, and Treatment of High Blood Cholesterol in Adults (Adult Treatment Panel III). Third Report of the National Cholesterol Education Program (NCEP) Expert Panel on Detection, Evaluation, and Treatment of High Blood Cholesterol in Adults (Adult Treatment Panel III) final report. Circulation 2002;106:3143- 421.
11. Osawa H, Mori Y. Sonographic diagnosis of fatty liver using a his- togram technique that compares liver and renal cortical echo am- plitudes. J Clin Ultrasound 1996;24:25-9.
12. el-Hassan AY, Ibrahim EM, al-Mulhim FA, Nabhan AA, Chammas MY. Fatty infiltration of the liver: analysis of prevalence, radiologi- cal and clinical features and influence on patient management. Br J Radiol 1992;65:774-8.
13. Austen WG, Edwards JE, Frye RL, Gensini GG, Gott VL, Griffith LS, et al. A reporting system on patients evaluated for coronary artery disease. Report of the Ad Hoc Committee for Grading of Coronary Artery Disease, Council on Cardiovascular Surgery, American Heart Association. Circulation 1975;51(4 Suppl):5-40.
14. Agatston AS, Janowitz WR, Hildner FJ, Zusmer NR, Viamonte M Jr, Detrano R. Quantification of coronary artery calcium using ul- trafast computed tomography. J Am Coll Cardiol 1990;15:827-32.
15. Ekstedt M, Franzén LE, Mathiesen UL, Thorelius L, Holmqvist M, Bodemar G, et al. Long-term follow-up of patients with NAFLD and elevated liver enzymes. Hepatology 2006;44:865-73.
16. Hamaguchi M, Kojima T, Takeda N, Nagata C, Takeda J, Sarui H, et al. Nonalcoholic fatty liver disease is a novel predictor of car- diovascular disease. World J Gastroenterol 2007;13:1579-84.
17. Pearson TA, Mensah GA, Alexander RW, Anderson JL, Cannon RO
3rd, Criqui M, et al. Markers of inflammation and cardiovascular disease: application to clinical and public health practice: a state- ment for healthcare professionals from the Centers for Disease Control and Prevention and the American Heart Association. Cir- culation 2003;107:499-511.
18. Pai JK, Pischon T, Ma J, Manson JE, Hankinson SE, Joshipura K, et al. Inflammatory markers and the risk of coronary heart disease in men and women. N Engl J Med 2004;351:2599-610.
19. Lizardi-Cervera J, Chavez-Tapia NC, Pérez-Bautista O, Ramos MH, Uribe M. Association among C-reactive protein, Fatty liver disease, and cardiovascular risk. Dig Dis Sci 2007;52:2375-9.
20. Rydén M, Arner P. Tumour necrosis factor-alpha in human adipose tissue--from signalling mechanisms to clinical implications. J In- tern Med 2007;262:431-8.
21. Gupta D, Varma S, Khandelwal RL. Long-term effects of tumor ne- crosis factor-alpha treatment on insulin signaling pathway in HepG2 cells and HepG2 cells overexpressing constitutively active Akt/PKB. J Cell Biochem 2007;100:593-607.
22. Corti R, Fuster V, Badimon JJ. Pathogenetic concepts of acute cor- onary syndromes. J Am Coll Cardiol 2003;41(4 Suppl S):7S-14S.
23. Davignon J, Ganz P. Role of endothelial dysfunction in atheroscle- rosis. Circulation 2004;109(23 Suppl 1):III27-32.
24. Villanova N, Moscatiello S, Ramilli S, Bugianesi E, Magalotti D, Vanni E, et al. Endothelial dysfunction and cardiovascular risk pro- file in nonalcoholic fatty liver disease. Hepatology 2005;42:473-80.
25. Targher G, Bertolini L, Padovani R, Zenari L, Zoppini G, Falezza G.
Relation of nonalcoholic hepatic steatosis to early carotid athero- sclerosis in healthy men: role of visceral fat accumulation. Diabe- tes Care 2004;27:2498-500.
26. Brea A, Mosquera D, Martín E, Arizti A, Cordero JL, Ros E. Nonal- coholic fatty liver disease is associated with carotid atherosclerosis:
a case-control study. Arterioscler Thromb Vasc Biol 2005;25:1045- 50.
27. Targher G, Bertolini L, Padovani R, Poli F, Scala L, Zenari L, et al.
Non-alcoholic fatty liver disease is associated with carotid artery wall thickness in diet-controlled type 2 diabetic patients. J Endo- crinol Invest 2006;29:55-60.
28. Fracanzani AL, Burdick L, Raselli S, Pedotti P, Grigore L, Santorelli G, et al. Carotid artery intima-media thickness in nonalcoholic fat- ty liver disease. Am J Med 2008;121:72-8.
29. Wong VW, Wong GL, Yip GW, Lo AO, Limquiaco J, Chu WC, et al.
Coronary artery disease and cardiovascular outcomes in patients with non-alcoholic fatty liver disease. Gut 2011;60:1721-7.