D I A B E T E S & M E T A B O L I S M J O U R N A L
This is an Open Access article distributed under the terms of the Creative Commons At- tribution Non-Commercial License (http://creativecommons.org/licenses/by-nc/3.0/) which permits unrestricted non-commercial use, distribution, and reproduction in any medium, provided the original work is properly cited.
Increased Selenoprotein P Levels in Subjects with
Visceral Obesity and Nonalcoholic Fatty Liver Disease
Hae Yoon Choi1, Soon Young Hwang2, Chang Hee Lee3, Ho Cheol Hong1, Sae Jeong Yang1, Hye Jin Yoo1, Ji A Seo1, Sin Gon Kim1, Nan Hee Kim1, Sei Hyun Baik1, Dong Seop Choi1, Kyung Mook Choi1
1Division of Endocrinology and Metabolism, Department of Internal Medicine, 2Department of Biostatistics, Korea University College of Medicine,
3Department of Radiology, Korea University Guro Hospital, Korea University College of Medicine, Seoul, Korea
Background: Selenoprotein P (SeP) has recently been reported as a novel hepatokine that regulates insulin resistance and sys- temic energy metabolism in rodents and humans. We explored the associations among SeP, visceral obesity, and nonalcoholic fatty liver disease (NAFLD).
Methods: We examined serum SeP concentrations in subjects with increased visceral fat area (VFA) or liver fat accumulation measured with computed tomography. Our study subjects included 120 nondiabetic individuals selected from participants of the Korean Sarcopenic Obesity Study. In addition, we evaluated the relationship between SeP and cardiometabolic risk factors, in- cluding homeostasis model of insulin resistance (HOMA-IR), high sensitivity C-reactive protein (hsCRP), adiponectin values, and brachial-ankle pulse wave velocity (baPWV).
Results: Subjects with NAFLD showed increased levels of HOMA-IR, hsCRP, VFA, and several components of metabolic syn- drome and decreased levels of adiponectin and high density lipoprotein cholesterol than those of controls. Serum SeP levels were positively correlated with VFA, hsCRP, and baPWV and negatively correlated with the liver attenuation index. Not only subjects with visceral obesity but also those with NAFLD exhibited significantly increased SeP levels (P<0.001). In multiple logistic re- gression analysis, the subjects in the highest SeP tertile showed a higher risk for NAFLD than those in the lowest SeP tertile, even after adjusting for potential confounding factors (odds ratio, 7.48; 95% confidence interval, 1.72 to 32.60; P=0.007).
Conclusion: Circulating SeP levels were increased in subjects with NAFLD as well as in those with visceral obesity and may be a novel biomarker for NAFLD.
Keywords: Hepatokine; Insulin resistance; Non-alcoholic fatty liver disease; Obesity; Selenoprotein P
Corresponding author: Kyung Mook Choi
Division of Endocrinology and Metabolism, Department of Internal Medicine, Korea University Guro Hospital, Korea University College of Medicine, 148 Gurodong-ro, Guro-gu, Seoul 152-703, Korea
E-mail: [email protected]
INTRODUCTION
Nonalcoholic fatty liver disease (NAFLD), a disease spectrum that includes simple steatosis, nonalcoholic steatohepatitis (NASH) and cirrhosis, has been increasingly recognized as the hepatic manifestation of metabolic syndrome [1]. Visceral obesity is an essential component of metabolic syndrome and a risk factor for type 2 diabetes and cardiovascular diseases [2].
Furthermore, increased visceral fat induces systemic low- grade inflammation, contributing to the development of insu-
lin resistance in humans and mice [3]. Both inflammation and insulin resistance are considered to be pivotal pathogenic mechanisms of NAFLD, as well as metabolic syndrome, type 2 diabetes, and atherosclerosis [4].
There is mounting evidence implicating adipokines secret- ed from adipose tissue in the pathogenesis and progression of NAFLD, in addition to the development of insulin resistance and inflammation [5]. In previous studies, including one by the current authors, decreased circulating adiponectin levels have been found in subjects with NAFLD and appear to be in- http://dx.doi.org/10.4093/dmj.2013.37.1.63
pISSN 2233-6079 · eISSN 2233-6087
versely related to hepatic insulin resistance, hepatic fat con- tent, and degree of liver inflammation [6,7]. Furthermore, we recently found that retinol binding protein 4, a novel adipo- kine associated with insulin resistance, appears to be signifi- cantly associated with NAFLD [8]. Analogous to adipose tis- sue, it is hypothesized that the liver may regulate systemic en- ergy metabolism through production of secretory proteins known as hepatokines. In fact, several previous studies have demonstrated that hepatokines, such as fetuin-A and fibro- blast growth factor 21 (FGF21), are associated with NAFLD.
Stefan et al. [9] showed that high fetuin-A levels are associated with insulin resistance in humans and are elevated in subjects with fat accumulation in the liver. Moreover, Dushay et al. [10]
reported that FGF21 values correlate with body mass index (BMI) and may be a novel biomarker for NAFLD.
Selenoprotein P (SeP) is a secretory protein primarily pro- duced and released by the liver [11]. Recently, Misu et al. [12]
found that hepatic SeP mRNA expression was increased in subjects with type 2 diabetes. Furthermore, administration of SeP aggravated insulin resistance in both hepatocytes and my- ocytes. Conversely, both genetic deletion and RNA interfer- ence-mediated knockdown of SeP improved insulin sensitivity and glucose tolerance in mice. Therefore, they concluded that SeP may be a promising target for the treatment of insulin re- sistance-associated diseases [12]. In our recent study, we also found that circulating SeP concentrations were elevated ac- cording to glucose metabolism dysregulation and were related to various cardiometabolic parameters including insulin resis- tance, inflammation, and atherosclerosis [13]. On the other hand, Zhang and Chen [14] recently demonstrated that SeP has a major role in adipocyte differentiation through the regu- lation of oxidative stress and inflammatory response. Although previous studies have shown a close relationship among insu- lin resistance, inflammation, and NAFLD, as far as we know, there is no previous report evaluating the association between SeP and NAFLD.
In the present study, we examined serum SeP levels in sub- jects with increased visceral fat area (VFA) or liver fat accu- mulation measured with computed tomography (CT). Our study participants were nondiabetic Korean subjects selected from an ongoing prospective observational cohort study. Fur- thermore, we evaluated the relationship between SeP levels and cardiometabolic risk factors, including homeostasis mod- el of insulin resistance (HOMA-IR) values, high sensitivity C- reactive protein (hsCRP) levels, adiponectin concentrations,
and arterial stiffness measured with brachial-ankle pulse wave velocity (baPWV).
METHODS
Subjects and data collection
Study subjects were selected from the participants of the Kore- an Sarcopenic Obesity Study (KSOS), an ongoing epidemio- logic study supported by the Korea Science and Engineering Foundation (KOSEF). This prospective observational cohort study was designed to examine the prevalence of sarcopenia and sarcopenic obesity in Korean adults with or without dia- betes and to evaluate their effects on metabolic disorders and health outcomes; details have been previously published [15,16]. Participants were enrolled in the KSOS cohort be- tween September 2007 and August 2009, and a follow-up sur- vey was conducted thereafter. Study participants included 446 well-functioning, community-dwelling, healthy volunteers without diabetes recruited from residents of Seoul, Korea and 428 diabetic patients being treated at the Diabetes Center of Korea University Guro Hospital. No participants had a history of cardiovascular disease (myocardial infarction, unstable an- gina, stroke, or cardiovascular revascularization), stage 2 hy- pertension (resting blood pressure, ≥160/100 mm Hg), malig- nancy, or severe renal or hepatic disease. Subjects taking med- ications that might affect body weight or body composition were excluded. For this study, we excluded diabetic subjects to eliminate possible confounding effects because a previous study reported increased SeP concentrations in diabetic sub- jects [12]. In addition, the following exclusion criteria were also used: alcohol consumption >20 g/day in men and >10 g/
day in women, a positive test for hepatitis B surface antigen or hepatitis C antibody, and use of herbal medications within the previous 6 months. Among the nondiabetic subjects, 76 sub- jects had NAFLD by applying our definition. Finally, 60 sub- jects with NAFLD and 60 age- and sex-matched controls were selected from the nondiabetic KSOS participants using the baseline data for abdominal CT and other epidemiological characteristics. All participants provided written informed consent, and the Korea University Institutional Review Board, in accordance with the Declaration of Helsinki of the World Medical Association, approved the study protocol.
Anthropometric and laboratory measurements
We calculated BMI as weight/height2 (kg/m2), and waist cir-
cumference was measured at the midpoint between the lower border of the rib cage and iliac crest. All blood samples were obtained in the morning following an 8-hour overnight fast and were immediately stored at -70°C for subsequent assays.
Serum triglyceride and high density lipoprotein cholesterol (HDL-C) levels were determined enzymatically using a chem- istry analyzer (Hitachi 747; Hitachi, Tokyo, Japan). Low densi- ty lipoprotein cholesterol (LDL-C) concentrations were esti- mated using the Friedewald formula, and a glucose oxidase method was employed to measure plasma glucose levels. Lev- els of hsCRP and serum insulin were measured with two dif- ferent electrochemiluminescence immunoassays (Daiichi Pure Chemicals Co., Tokyo, Japan; Roche Diagnostics, Basel, Swit- zerland). The homeostasis model assessment estimate of insu- lin resistance (HOMA-IR) was calculated from plasma insulin and glucose values. Serum adiponectin levels were measured with an enzyme linked immunosorbent assay (ELISA, Mesdia, Seoul, Korea), and the intra-assay and inter-assay coefficients of variation (CV) were 5.0% in both cases. Serum SeP levels were determined using a commercially available human ELI- SA kit (USCN Life Science, Wuhan, China) with an intra-assay CV of 6.7% and an inter-assay CV of 4.7%.
CT
Abdominal VFA and total abdominal fat area were measured via CT scan without an intravenous contrast agent (Brilliance 64; Philips Medical Systems, Cleveland, OH, USA). With the subject in the supine position, a 3-mm CT slice scan was ac- quired at the L4 to L5 level to measure visceral fat and total abdominal fat areas. The cross-sectional surface areas (in cm2) of different abdominal fat compartments were calculated from this slice using commercially available CT software (Rapidia 2.8; INFINITT, Seoul, Korea). We were able to determine adi- pose tissue area electronically by setting the attenuation values for a region of interest within the range of -190 to -30 Houn- sfield units (HU). The VFA was quantified by measuring the intra-abdominal cavity at the internal aspect of the abdominal and oblique muscle walls surrounding the cavity and the pos- terior aspect of the vertebral body. Subcutaneous fat area (SCFA) was calculated by subtracting VFA from total fat area. Visceral obesity was defined as a VFA of more than 100 cm2 [17].
Definition of NAFLD
NAFLD was diagnosed using an unenhanced CT, read by one experienced radiologist who was blinded to the anthropomet-
ric and laboratory data. Hepatic attenuation was measured by means of a random selection of three circular regions of inter- est (ROI) on five transverse sections. To provide an internal control, mean splenic attenuation was also calculated by aver- aging two random ROI values for the splenic attenuation mea- surement on transverse section levels. The liver attenuation index (LAI), derived from the difference between the mean hepatic and splenic attenuation, was used as a parameter for the diagnosis of NAFLD. Histologic confirmation of NAFLD requires a minimum of 5% steatosis [18]. Limanond et al. [19]
documented that the degree of steatosis correlated very well with the LAI (r=0.92), and that an LAI <5 HU correctly pre- dicted >5% steatosis. Therefore, NAFLD in the present study was defined a value of LAI <5 HU. We recently reported the cutoff points of abdominal obesity indices in screening for NAFLD defined using this criterion [20].
Pulse wave velocity
The following variables were measured with a Colin waveform analyzer (model BP-203RPE II; Colin, Komaki, Japan). Ex- tremity blood pressure was measured with the oscillometric method, and ankle–brachial pressure index (ABI) was auto- matically calculated. Right brachial–ankle pulse wave velocity (rt. baPWV: right upper arm–right ankle), left brachial–ankle pulse wave velocity (lt. baPWV: right upper arm–left ankle), and mean baPWV were also measured and calculated. The reproducibility of this method was reported in our previous study [21].
Statistical analysis
Data are expressed as mean±standard deviation, median (in- terquartile range), or as percentages. Differences between groups were tested using an independent two-sample t-test or the Mann–Whitney U test for continuous variables, and the Pearson chi-squared test was used to test for differences in the distribution of categorical variables. Differences between ter- tile groups were tested using the one-way analysis of variance (ANOVA) test, Kruskal-Wallis’ H-test for continuous variables, and Fisher’s exact test or Pearson’s chi-squared test for categor- ical variables. Spearman rank correlation tests were performed to determine the relationships between serum SeP levels and other variables. Odds ratios (OR) (95% confidence interval [CI]) predicting NAFLD based on SeP tertiles, were obtained from logistic regression models after controlling for potential covariates, such as age, sex, BMI, smoking status, blood pres-
sure, triglyceride, HDL-C, adiponectin, hsCRP, and HOMA- IR levels. Data were analyzed using SPSS for Windows version 12.0 (SPSS Inc., Chicago, IL, USA) and SAS for Windows ver- sion 9.0 (SAS Institute Inc., Cary, NC, USA). A P value of less than 0.05 indicated statistical significance.
RESULTS
Clinical and laboratory characteristics of the participants The clinical and metabolic characteristics of the participants are summarized in Table 1. Although age and sex distributions did not differ between groups, subjects with NAFLD had sig- nificantly higher BMI, waist circumference, systolic blood pres- sure, total cholesterol, triglycerides, aspartate aminotransfer- ase, alanine aminotransferase, HOMA-IR, hsCRP, VFA, and SCFA values and lower HDL-C and adiponectin levels than those of the control group.
Clinical and laboratory parameters according to SeP tertile Table 2 presents the clinical and laboratory variables stratified by SeP level tertile. BMI, waist circumference, systolic blood pressure, triglycerides, HOMA-IR, hsCRP, baPWV, VFA, and SCFA levels increased significantly with increasing SeP levels.
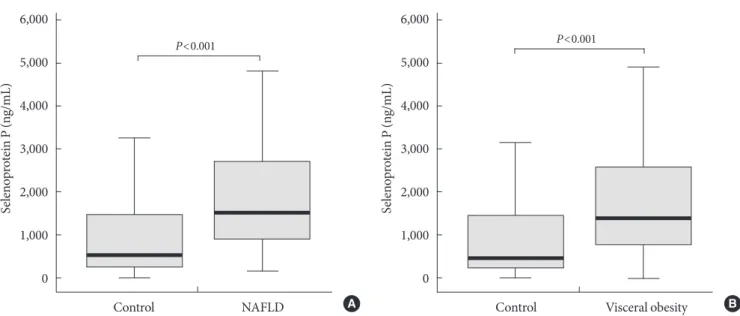
Interestingly, subjects with NAFLD (P<0.001), as well as those with visceral obesity (P<0.001) exhibited increased SeP con- centrations compared to the control group (Fig. 1).
Correlation between SeP level and cardiometabolic risk factors
Circulating SeP levels showed a significant positive correlation with VFA measured with abdominal CT (r=0.338, P<0.001) and a negative correlation with LAI (r=-0.333, P<0.001), which inversely reflects hepatic fat accumulation. Further- more, SeP concentrations revealed a significant positive corre- lation with both hsCRP levels (r=0.749, P<0.001) and baP- WV (r=0.262, P=0.004).
Multiple logistic regression analysis of the association between SeP and NAFLD
Multiple logistic regression analysis was performed using NAFLD as a dependent variable and SeP as an independent variable (Table 3). In the unadjusted model, subjects in the highest SeP tertile showed a higher risk of NAFLD compared to those in the lowest SeP tertile (OR, 10.55; 95% CI, 3.73 to 29.84; P<0.001). Furthermore, multivariate analysis revealed
that the association between NAFLD and SeP levels remained significant even after adjusting for potential confounders such as age, sex, BMI, current smoking status, blood pressure, tri- glycerides, HDL-C, hsCRP, adiponectin, and HOMA-IR val- Table 1. Anthropometric and metabolic characteristics of study subjects
Variable Control
(n=60) NAFLD
(n=60) P value
Age, yr 47.0±13.0 49.1±13.1 0.374
Sex, M/F 29/31 30/30 0.855
No. of tobacco smokers (%) 27 (45.0) 20 (33.3) 0.289
BMI, kg/m2 24.0±3.2 26.8±2.9 <0.001
Waist circumference, cm 83.5±8.8 91.2±6.9 <0.001
SBP, mm Hg 119.5±11.9 124.6±13.0 0.028
DBP, mm Hg 78.8±9.3 81.8±10.8 0.109
Total cholesterol, mg/dL 181.7±29.5 198.3±39.7 0.011
LDL-C, mg/dL 103.3±24.3 112.1±34.4 0.109
HDL-C, mg/dL 55.3±14.6 48.3±12.3 0.005
Triglyceride, mg/dL 95.5
(70.0-137.5) 143.0
(105.3-244.5) <0.001
AST, IU/L 19.0
(16.0-23.0) 24.0
(18.3-31.8) <0.001
ALT, IU/L 17.5
(14.0-22.0) 24.0
(7.3-41.5) <0.001
FPG, mg/dL 97.9±16.0 99.0±15.4 0.706
HOMA-IR 1.63
(1.15-2.95) 2.78
(1.79-4.01) <0.001 Selenoprotein P, ng/mL 530.4
(246.2-1478.2) 1,509.3
(899.0-2773.2) <0.001
hsCRP, mg/L 0.33
(0.14-1.54) 0.76
(0.40-1.66) 0.013 Adiponectin, µg/mL 5.66
(3.20-7.96) 3.37
(2.31-4.85) <0.001 baPWV, cm/sec 1,298.5±219.3 1,364.4±238.8 0.118 Visceral fat area, cm2 105.6±53.9 153.7±55.9 <0.001 Subcutaneous fat area, cm2 155.8±69.3 206.9±75.7 <0.001 Values are presented as mean±standard deviation, median (inter- quartile range), or number (%). P values were calculated using an in- dependent two-sample t-test or the Mann–Whitney U test.
NAFLD, nonalcoholic fatty liver disease; BMI, body mass index; SBP, systolic blood pressure; DBP, diastolic blood pressure; LDL-C, low density lipoprotein cholesterol; HDL-C, high density lipoprotein cholesterol; AST, aspartate aminotransferase; ALT, alanine amino- transferase; FPG, fasting plasma glucose; HOMA-IR, homeostasis model assessment of insulin resistance; hsCRP, high sensitivity C-re- active protein; baPWV, brachial-ankle pulse wave velocity.
ues (OR, 7.48; 95% CI, 1.72 to 32.60, highest vs. lowest SeP tertile; P=0.007).
DISCUSSION
The present study demonstrates that circulating SeP concen- trations appear to be significantly increased in subjects with visceral obesity. In addition, SeP levels appear to be signifi- cantly correlated with cardiometabolic risk factors, such as waist circumference, VFA, HOMA-IR, hsCRP, and baPWV values of arterial stiffness. Furthermore, subjects in the highest SeP tertile showed a 7.5 times greater risk of NAFLD than those in the lowest SeP tertile, even after adjustments for age,
sex, BMI, and other confounding factors.
NAFLD is now the leading cause of liver disease in devel- oped countries, with an estimated prevalence of 20% to 35%
in the general population [22]. NAFLD is a strong predictor of NASH and also predicts liver cirrhosis, end-stage liver disease, and hepatocellular carcinoma [23]. The development of NAFLD is closely related to visceral obesity, insulin resistance, and other components of metabolic syndrome [22]. Pathogen- esis of NAFLD was traditionally explained using the “two-hit theory,” [24] whereby the primary insult was accompanied by fat accumulation in hepatocytes and increased oxidative stress.
These occurrences lead to inflammation, which induces the second “hit” in the progression to NASH or liver cirrhosis [24].
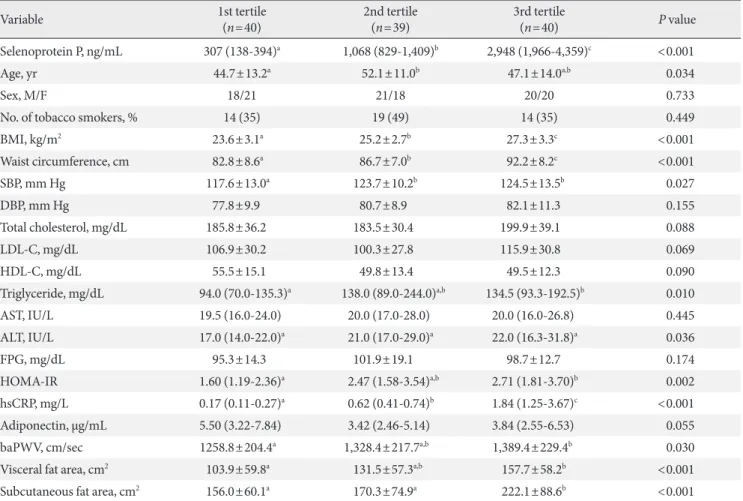
Table 2. Clinical variables stratified by selenoprotein P tertile
Variable 1st tertile
(n=40) 2nd tertile
(n=39) 3rd tertile
(n=40) P value
Selenoprotein P, ng/mL 307 (138-394)a 1,068 (829-1,409)b 2,948 (1,966-4,359)c <0.001
Age, yr 44.7±13.2a 52.1±11.0b 47.1±14.0a,b 0.034
Sex, M/F 18/21 21/18 20/20 0.733
No. of tobacco smokers, % 14 (35) 19 (49) 14 (35) 0.449
BMI, kg/m2 23.6±3.1a 25.2±2.7b 27.3±3.3c <0.001
Waist circumference, cm 82.8±8.6a 86.7±7.0b 92.2±8.2c <0.001
SBP, mm Hg 117.6±13.0a 123.7±10.2b 124.5±13.5b 0.027
DBP, mm Hg 77.8±9.9 80.7±8.9 82.1±11.3 0.155
Total cholesterol, mg/dL 185.8±36.2 183.5±30.4 199.9±39.1 0.088
LDL-C, mg/dL 106.9±30.2 100.3±27.8 115.9±30.8 0.069
HDL-C, mg/dL 55.5±15.1 49.8±13.4 49.5±12.3 0.090
Triglyceride, mg/dL 94.0 (70.0-135.3)a 138.0 (89.0-244.0)a,b 134.5 (93.3-192.5)b 0.010
AST, IU/L 19.5 (16.0-24.0) 20.0 (17.0-28.0) 20.0 (16.0-26.8) 0.445
ALT, IU/L 17.0 (14.0-22.0)a 21.0 (17.0-29.0)a 22.0 (16.3-31.8)a 0.036
FPG, mg/dL 95.3±14.3 101.9±19.1 98.7±12.7 0.174
HOMA-IR 1.60 (1.19-2.36)a 2.47 (1.58-3.54)a,b 2.71 (1.81-3.70)b 0.002
hsCRP, mg/L 0.17 (0.11-0.27)a 0.62 (0.41-0.74)b 1.84 (1.25-3.67)c <0.001
Adiponectin, µg/mL 5.50 (3.22-7.84) 3.42 (2.46-5.14) 3.84 (2.55-6.53) 0.055
baPWV, cm/sec 1258.8±204.4a 1,328.4±217.7a,b 1,389.4±229.4b 0.030
Visceral fat area, cm2 103.9±59.8a 131.5±57.3a,b 157.7±58.2b <0.001
Subcutaneous fat area, cm2 156.0±60.1a 170.3±74.9a 222.1±88.6b <0.001
Values are presented as mean±standard deviation, median (interquartile range), or number (%). P values represent overall differences across groups as determined by (nonparametric) ANOVA for continuous variables and Fisher’s exact test or Pearson’s chi-squared test for categorical variables.
BMI, body mass index; SBP, systolic blood pressure; DBP, diastolic blood pressure; LDL-C, low density lipoprotein cholesterol; HDL-C, high density lipoprotein cholesterol; AST, aspartate aminotransferase; ALT, alanine aminotransferase; FPG, fasting plasma glucose; HOMA-IR, ho- meostasis model assessment of insulin resistance; hsCRP, high sensitivity C-reactive protein; baPWV, brachial-ankle pulse wave velocity.
a,b,cSame letters indicate no statistical significance based on Tukey’s HSD post-hoc test and the Bonferroni correction.
Recent studies have revealed the role of hepatokines, novel factors secreted from the liver under excess fat accumulation, that are involved in the regulation of systemic energy metabo- lism [23]. Fat accumulation in the liver induces the production of the glycoprotein fetuin-A, which aggravates insulin resis- tance, represses adiponectin production, and induces subclini- cal inflammation [9,25]. Furthermore, Stefan et al. [9] report- ed that plasma fetuin-A levels are elevated in subjects with fat accumulation in the liver. Reinehr and Roth [26] also ob- served that fetuin-A levels were higher in children with NAFLD and were related to insulin resistance and to features of metabolic syndrome. On the other hand, FGF21 is a hepatic protein that plays a critical role in systemic metabolism, and circulating FGF21 levels are increased in subjects with obesity,
diabetes, or metabolic syndrome [27]. Yilmaz et al. [28] re- ported that serum FGF21 levels are increased in subjects with NAFLD regardless of potential confounders.
Misu et al. [12] recently reported that hepatic SeP mRNA expression was significantly upregulated in subjects with type 2 diabetes according to serial analysis of gene expression and DNA chip methods. Treatment with SeP impaired insulin sig- naling in hepatocytes and myocytes both in vitro and in vivo.
Moreover, knockdown of SeP in the liver or SeP-deficient mice led to improved glucose tolerance and insulin resistance. As a mechanism, they found that the metabolic actions of SeP were mediated by inactivation of adenosine monophosphate-acti- vated protein kinase. Therefore, they concluded that the liver- derived secretory protein SeP may be a target for the treatment Fig. 1. Serum selenoprotein P (SeP) concentrations in control subjects and those with (A) nonalcoholic fatty liver disease (NAFLD) and (B) visceral obesity.
Control NAFLD
P<0.001
Selenoprotein P (ng/mL)
6,000 5,000 4,000 3,000 2,000 1,000
0
Control Visceral obesity P<0.001
Selenoprotein P (ng/mL)
6,000 5,000 4,000 3,000 2,000 1,000
0
A B
Table 3. Multiple logistic regression analysis with nonalcoholic fatty liver disease as a dependent variable and selenoprotein P as an independent variable
T1 T2 (OR, 95% CI) P value T3 (OR, 95% CI) P value
Unadjusted 1.00 5.75 (2.11-15.69) 0.001 10.55 (3.73-29.84) <0.001
Model 1 1.00 5.56 (1.98-15.57) 0.001 10.48 (3.69-29.75) <0.001
Model 2 1.00 5.54 (1.76-16.76) 0.003 5.68 (1.78-18.10) 0.003
Model 3 1.00 4.78 (1.42-16.10) 0.011 5.23 (1.52-18.03) 0.009
Model 4 1.00 6.30 (1.51-26.28) 0.012 7.48 (1.72-32.60) 0.007
Model 1: adjusted for age, sex; Model 2: adjusted for age, sex, body mass index (BMI), and smoking status; Model 3: adjusted for age, sex, BMI, smoking status, systolic blood pressure (SBP), diastolic blood pressure (DBP), triglycerides, and high density lipoprotein cholesterol (HDL-C) values; Model 4: adjusted for age, sex, BMI, smoking status, SBP, DBP, triglycerides, HDL-C, high sensitivity C-reactive protein, adiponectin, and homeostasis model assessment of insulin resistance values.
OR, odds ratio; CI, confidence interval.
of insulin-resistance-associated diseases, including type 2 dia- betes [12]. In this study, we found for the first time that novel hepatokine SeP concentrations were significantly correlated with LAI and were increased in subjects with NAFDL regard- less of potential confounding factors. LAI is an objective pa- rameter that has a very close quantitative correlation with his- tologic steatosis [19]. In our previous study, LAI showed a cor- relation with various anthropometric and metabolic parame- ters associated with metabolic syndrome [20].
Recent studies using proton magnetic resonance spectros- copy have shown that hepatic lipid content is directly correlat- ed with visceral fat [29]. In this study, SeP concentration was significantly associated with VFA, and subjects with visceral obesity showed increased circulating SeP levels compared to controls. The strong correlation of VFA with liver fat may be attributable to dysregulated adipokine production via a re- duced production of adiponectin and increased productions of tumor necrosis factor-α and interleukin-6 [23]. In the pres- ent study, adiponectin concentrations were significantly de- creased in subjects with NAFLD compared to the levels in the controls, a finding that is compatible with previous studies.
However, the correlation between circulating adiponectin and SeP levels was not significant in our study subjects (r=-0.226, P=0.085). Further studies may be needed to elucidate the rela- tionship and interactions between SeP and adiponectin.
Recently, NAFLD has emerged as an independent risk fac- tor for cardiovascular disease. Several studies have reported increased carotid intima-media thickness and carotid plaque in subjects with NAFLD [30]. The present study demonstrated that circulating SeP levels appear to be significantly associated with arterial stiffness, as well as hepatic fat accumulation, in subjects without cardiovascular disease. Arterial stiffness mea- sured with baPWV is a useful marker for the assessment of in- creased cardiovascular disease risk. Many previous studies have reported that arterial stiffness appears to be an indepen- dent risk factor for cardiovascular disease and subsequent mortality [31]. Previously, we observed that baPWV is closely associated with inflammatory markers as well as cardiometa- bolic risk factors of metabolic syndrome [32,33]. Moreover, the present study showed a close correlation between SeP and hsCRP levels (r=0.749, P<0.001), which has emerged as the most powerful inflammatory marker of future cardiovascular risk [34]. Considering the close relationship between SeP and cardiovascular risk factors, such as inflammation, type 2 dia- betes and visceral obesity, these results may support the role of
SeP in the linkage between NAFLD and atherosclerosis.
Our study has several limitations to be considered. First, it was performed using baseline data from an ongoing prospec- tive cohort study; therefore, it is not possible to define causali- ty. We are planning to perform a follow-up survey to explore the longitudinal effects of SeP on NAFLD in Korean adults.
Also, the number of study participants was relatively small.
Another limitation of our study was that we did not perform liver biopsies for the diagnosis of NAFLD. Although liver bi- opsy is regarded as a gold standard for the diagnosis of NAFLD, it is invasive and associated with morbidities and rare cases of mortality [22]. Furthermore, as histological lesions of NASH are not evenly distributed in the liver, the inherent sampling error of liver biopsies may result in substantial mis- diagnosis and staging inaccuracies [35].
The present study also has several advantages. Using pre- defined inclusion and exclusion criteria, we enrolled age- and sex-matched individuals from the subjects of a prudently de- signed cohort study. Also, we used abdominal CT, which is known as the most accurate method for measuring visceral fat. In addition, a diagnosis of NAFLD was defined based on an objective method of averaging LAI in multiple points of liver parenchyma [19].
In conclusion, the present study demonstrated that novel hepatokine SeP concentrations were increased in subjects with visceral obesity. In addition, circulating SeP levels appear to be significantly associated with cardiovascular risk factors, in- cluding subclinical inflammation and arterial stiffness. Fur- thermore, SeP concentrations were shown to be significantly correlated with LAI and independently associated with NAFLD, even after adjusting for potential confounding fac- tors. These results may warrant further investigation of this novel hepatokine in insulin resistance-related disorders, in- cluding metabolic liver diseases.
CONFLICTS OF INTEREST
No potential conflict of interest relevant to this article was re- ported.
ACKNOWLEDGMENTS
Dr. Kyung Mook Choi was supported by the Mid-Career Re- searcher Program through an NRF grant funded by the Minis- try of Education, Science, and Technology, Republic of Korea
(No. R01-2007-000-20546-0). Dr. Kyung Mook Choi and Dr.
Sei Hyun Baik were supported by the Brain Korea 21 Project of the Ministry of Education and Human Resources Develop- ment, Republic of Korea (A102065-1011-1070100).
REFERENCES
1. Angulo P. Nonalcoholic fatty liver disease. N Engl J Med 2002;
346:1221-31.
2. Boyko EJ, Fujimoto WY, Leonetti DL, Newell-Morris L. Vis- ceral adiposity and risk of type 2 diabetes: a prospective study among Japanese Americans. Diabetes Care 2000;23:465-71.
3. Furukawa S, Fujita T, Shimabukuro M, Iwaki M, Yamada Y, Nakajima Y, Nakayama O, Makishima M, Matsuda M, Shimo- mura I. Increased oxidative stress in obesity and its impact on metabolic syndrome. J Clin Invest 2004;114:1752-61.
4. Leclercq IA, Da Silva Morais A, Schroyen B, Van Hul N, Geerts A. Insulin resistance in hepatocytes and sinusoidal liver cells:
mechanisms and consequences. J Hepatol 2007;47:142-56.
5. Marra F, Bertolani C. Adipokines in liver diseases. Hepatology 2009;50:957-69.
6. Vanni E, Bugianesi E, Kotronen A, De Minicis S, Yki-Jarvinen H, Svegliati-Baroni G. From the metabolic syndrome to NAFLD or vice versa? Dig Liver Dis 2010;42:320-30.
7. Kim SG, Kim HY, Seo JA, Lee KW, Oh JH, Kim NH, Choi KM, Baik SH, Choi DS. Relationship between serum adiponectin concentration, pulse wave velocity and nonalcoholic fatty liver disease. Eur J Endocrinol 2005;152:225-31.
8. Seo JA, Kim NH, Park SY, Kim HY, Ryu OH, Lee KW, Lee J, Kim DL, Choi KM, Baik SH, Choi DS, Kim SG. Serum retinol- binding protein 4 levels are elevated in non-alcoholic fatty liver disease. Clin Endocrinol (Oxf) 2008;68:555-60.
9. Stefan N, Hennige AM, Staiger H, Machann J, Schick F, Krober SM, Machicao F, Fritsche A, Haring HU. Alpha2-Heremans- Schmid glycoprotein/fetuin-A is associated with insulin resis- tance and fat accumulation in the liver in humans. Diabetes Care 2006;29:853-7.
10. Dushay J, Chui PC, Gopalakrishnan GS, Varela-Rey M, Craw- ley M, Fisher FM, Badman MK, Martinez-Chantar ML, Mara- tos-Flier E. Increased fibroblast growth factor 21 in obesity and nonalcoholic fatty liver disease. Gastroenterology 2010;
139:456-63.
11. Burk RF, Hill KE. Selenoprotein P: an extracellular protein with unique physical characteristics and a role in selenium homeostasis. Annu Rev Nutr 2005;25:215-35.
12. Misu H, Takamura T, Takayama H, Hayashi H, Matsuzawa- Nagata N, Kurita S, Ishikura K, Ando H, Takeshita Y, Ota T, Sakurai M, Yamashita T, Mizukoshi E, Honda M, Miyamoto K, Kubota T, Kubota N, Kadowaki T, Kim HJ, Lee IK, Minokoshi Y, Saito Y, Takahashi K, Yamada Y, Takakura N, Kaneko S. A liver-derived secretory protein, selenoprotein P, causes insulin resistance. Cell Metab 2010;12:483-95.
13. Yang SJ, Hwang SY, Choi HY, Yoo HJ, Seo JA, Kim SG, Kim NH, Baik SH, Choi DS, Choi KM. Serum selenoprotein P lev- els in patients with type 2 diabetes and prediabetes: implica- tions for insulin resistance, inflammation, and atherosclerosis.
J Clin Endocrinol Metab 2011;96:E1325-9.
14. Zhang Y, Chen X. Reducing selenoprotein P expression sup- presses adipocyte differentiation as a result of increased pread- ipocyte inflammation. Am J Physiol Endocrinol Metab 2011;
300:E77-85.
15. Kim TN, Yang SJ, Yoo HJ, Lim KI, Kang HJ, Song W, Seo JA, Kim SG, Kim NH, Baik SH, Choi DS, Choi KM. Prevalence of sarcopenia and sarcopenic obesity in Korean adults: the Kore- an sarcopenic obesity study. Int J Obes (Lond) 2009;33:885-92.
16. Kim TN, Park MS, Yang SJ, Yoo HJ, Kang HJ, Song W, Seo JA, Kim SG, Kim NH, Baik SH, Choi DS, Choi KM. Prevalence and determinant factors of sarcopenia in patients with type 2 diabetes: the Korean Sarcopenic Obesity Study (KSOS). Dia- betes Care 2010;33:1497-9.
17. Examination Committee of Criteria for ‘Obesity Disease’ in Ja- pan; Japan Society for the Study of Obesity. New criteria for
‘obesity disease’ in Japan. Circ J 2002;66:987-92.
18. Hubscher SG. Histological assessment of non-alcoholic fatty liver disease. Histopathology 2006;49:450-65.
19. Limanond P, Raman SS, Lassman C, Sayre J, Ghobrial RM, Busuttil RW, Saab S, Lu DS. Macrovesicular hepatic steatosis in living related liver donors: correlation between CT and histo- logic findings. Radiology 2004;230:276-80.
20. Yoo HJ, Park MS, Lee CH, Yang SJ, Kim TN, Lim KI, Kang HJ, Song W, Yeon JE, Baik SH, Choi DS, Choi KM. Cutoff points of abdominal obesity indices in screening for non-alcoholic fatty liver disease in Asians. Liver Int 2010;30:1189-96.
21. Kim SM, Lee J, Ryu OH, Lee KW, Kim HY, Seo JA, Kim SG, Kim NH, Baik SH, Choi DS, Choi KM. Serum osteoprotegerin levels are associated with inflammation and pulse wave veloci- ty. Clin Endocrinol (Oxf) 2005;63:594-8.
22. Moore JB. Non-alcoholic fatty liver disease: the hepatic conse- quence of obesity and the metabolic syndrome. Proc Nutr Soc 2010;69:211-20.
23. Kantartzis K, Schick F, Haring HU, Stefan N. Environmental and genetic determinants of fatty liver in humans. Dig Dis 2010;
28:169-78.
24. Day CP, James OF. Steatohepatitis: a tale of two “hits”? Gastro- enterology 1998;114:842-5.
25. Hennige AM, Staiger H, Wicke C, Machicao F, Fritsche A, Haring HU, Stefan N. Fetuin-A induces cytokine expression and suppresses adiponectin production. PLoS One 2008;3:
e1765.
26. Reinehr T, Roth CL. Fetuin-A and its relation to metabolic syndrome and fatty liver disease in obese children before and after weight loss. J Clin Endocrinol Metab 2008;93:4479-85.
27. Zhang X, Yeung DC, Karpisek M, Stejskal D, Zhou ZG, Liu F, Wong RL, Chow WS, Tso AW, Lam KS, Xu A. Serum FGF21 levels are increased in obesity and are independently associat- ed with the metabolic syndrome in humans. Diabetes 2008;57:
1246-53.
28. Yilmaz Y, Eren F, Yonal O, Kurt R, Aktas B, Celikel CA, Ozdo- gan O, Imeryuz N, Kalayci C, Avsar E. Increased serum FGF21 levels in patients with nonalcoholic fatty liver disease. Eur J Clin Invest 2010;40:887-92.
29. Guerrero R, Vega GL, Grundy SM, Browning JD. Ethnic dif- ferences in hepatic steatosis: an insulin resistance paradox?
Hepatology 2009;49:791-801.
30. Fracanzani AL, Valenti L, Bugianesi E, Andreoletti M, Colli A, Vanni E, Bertelli C, Fatta E, Bignamini D, Marchesini G, Far- gion S. Risk of severe liver disease in nonalcoholic fatty liver disease with normal aminotransferase levels: a role for insulin resistance and diabetes. Hepatology 2008;48:792-8.
31. Zieman SJ, Melenovsky V, Kass DA. Mechanisms, pathophysi- ology, and therapy of arterial stiffness. Arterioscler Thromb Vasc Biol 2005;25:932-43.
32. Choi KM, Lee KW, Seo JA, Oh JH, Kim SG, Kim NH, Choi DS, Baik SH. Relationship between brachial-ankle pulse wave velocity and cardiovascular risk factors of the metabolic syn- drome. Diabetes Res Clin Pract 2004;66:57-61.
33. Choi KM, Yoo HJ, Kim HY, Lee KW, Seo JA, Kim SG, Kim NH, Choi DS, Baik SH. Association between endogenous se- cretory RAGE, inflammatory markers and arterial stiffness. Int J Cardiol 2009;132:96-101.
34. Blake GJ, Ridker PM. Novel clinical markers of vascular wall inflammation. Circ Res 2001;89:763-71.
35. Ratziu V, Charlotte F, Heurtier A, Gombert S, Giral P, Bruckert E, Grimaldi A, Capron F, Poynard T; LIDO Study Group. Sam- pling variability of liver biopsy in nonalcoholic fatty liver dis- ease. Gastroenterology 2005;128:1898-906.