Noninvasive Evaluation of Nonalcoholic Fatty Liver Disease
Dae Ho Lee
Department of Internal Medicine, Gachon University Gil Medical Center, Gachon University College of Medicine, Incheon, Korea
Nonalcoholic fatty liver disease (NAFLD) is the most prevalent liver diseases and can progress to advanced fibrosis and end-stage liver disease. Thus, intensive research has been performed to develop noninvasive methods for the diagnosis of nonalcoholic steato- hepatitis (NASH) and fibrosis. Currently, no single noninvasive tool covers all of the stages of pathologies and conditions of NAFLD, and the cost and feasibility of known techniques are also important issues. Blood biomarkers for NAFLD may be useful to select subjects who need ultrasonography (US) screening for NAFLD, and noninvasive tools for assessing fibrosis may be helpful to exclude the probability of significant fibrosis and to predict advanced fibrosis, thus guiding the decision of whether to perform liver biopsy in patients with NAFLD. Among various methods, magnetic resonance-based methods have been shown to perform better than other methods in assessing steatosis as well as in detecting hepatic fibrosis. Many genetic markers are associated with the devel- opment and progression of NAFLD. Further well-designed studies are needed to determine which biomarker panels, imaging stud- ies, genetic marker panels, or combinations thereof perform well for diagnosing NAFLD, differentiating NASH and fibrosis, and following-up NAFLD, respectively.
Keywords: Evaluation; Non-alcoholic fatty liver disease; Liver steatosis; Fibrosis; Biomarkers
INTRODUCTION
In parallel with increasing prevalence rates of obesity, metabolic syndrome, and diabetes, the prevalence of nonalcoholic fatty liver disease (NAFLD) has been increasing continuously [1].
Between 20% and 40% of the adult population is affected by NAFLD [2]. In patients with type 2 diabetes mellitus (T2DM), the NAFLD prevalence ranges from 70% to 95%, while the rate is extremely high in morbid obesity, at up to 98% [2]. In the general Korean population, the NAFLD prevalence ranges from 16.1% to 25.25% [3,4]. The global prevalence of nonalcoholic steatohepatitis (NASH) is between 1.5% and 6.5% [2]. Howev-
er, the case definition based on abnormal aminotransferase lev- els or histological findings can be inaccurate, because a signifi- cant proportion of NAFLD subjects have normal liver enzymes and liver biopsy is performed only in selected subjects [1,5].
Thus, the prevalence of NASH could be as high as 12%, de- pending on the study design and population [6].
THE DEFINITION OF NAFLD
NALFD encompasses a spectrum of diseases ranging from sim- ple steatosis (or nonalcoholic fatty liver [NAFL]) through NASH, to fibrosis and ultimately cirrhosis. Although steatosis
Received: 30 March 2020, Revised: 19 May 2020, Accepted: 22 May 2020 Corresponding author: Dae Ho Lee
Department of Internal Medicine, Gachon University Gil Medical Center, Gachon University College of Medicine, 21 Namdong-daero 774beon-gil, Namdong-gu, Incheon 21565, Korea
Tel: +82-32-458-2733, Fax: +82-32-468-5836, E-mail: [email protected]
Copyright © 2020 Korean Endocrine Society
This is an Open Access article distributed under the terms of the Creative Com- mons Attribution Non-Commercial License (https://creativecommons.org/
licenses/by-nc/4.0/) which permits unrestricted non-commercial use, distribu- tion, and reproduction in any medium, provided the original work is properly cited.
www.e-enm.org
can be defined by various clinically available diagnostic tools, it can be numerically and strictly defined by assessing liver fat: ≥ 5% of fat-containing hepatocytes assessed by light microscopy;
proton density fat fraction (PDFF) ≥5% by magnetic resonance imaging (MRI), or >5.5% by proton magnetic resonance spec- troscopy (1H-MRS) [7,8]. The histological findings of NAFL demonstrate hepatic steatosis without evidence of hepatocellular injury (e.g., ballooning of hepatocytes), and NAFL usually fol- lows a benign clinical course. Conversely, the histological find- ings of NASH are characterized by the presence of hepatic ste- atosis and inflammation with distinctive hepatocyte injury (e.g., ballooning degeneration), and NASH is considered to be a po- tentially health-threatening disease that may progress to cirrho- sis in 9% to 22% of patients and to hepatocellular carcinoma (HCC) as a complication [9,10]. The definitive diagnosis of NASH requires a liver biopsy.
IMPLICATIONS OF INTRAHEPATIC TRIGLYCERIDE CONTENT
The threshold level of intrahepatic triglyceride (TG) content for the definition of NAFLD was based on a relatively small study [11]. Interestingly, an elegant study evaluated metabolic and histologic implications of intrahepatic TG content in NAFLD [12]. The study found that there was a clear threshold of intrahe- patic TG content (6%±2%), after which metabolic changes, such as muscle insulin resistance (IR), hypertriglyceridemia, and decreased plasma high density lipoprotein cholesterol were already fully established (Table 1) [8,12-14]. This suggests that the definition of NAFLD by using MRI may underestimate the
prevalence of fatty liver. In line with this view, a study reported that a cutoff value of 3% on MRI-PDFF may identify more sub- jects with biopsy-proven steatosis [15]. However, currently available and easy-to-perform US-based methods are very in- sensitive to detect such levels of steatosis [16]. Further, more accurate quantification of hepatic fat content by 1H-MRS or other magnetic resonance (MR)-based techniques does not pre- dict the severity of histology [12,17]. Although liver biopsy pro- vides an accurate diagnosis in approximately 90% of patients with unexplained abnormalities revealed by liver function tests [18], not all subjects with NAFLD could be evaluated by histo- logic study. Thus, noninvasive tools for screening, diagnosing, and staging steatosis, NASH, and fibrosis in NAFLD and for assessing the progression or regression of the disease are of par- amount importance to both patients and their physicians. The evaluation of patients with NAFLD should be performed with consideration of metabolic and cardiovascular (CV) risk pro- files as well as liver injuries including, in particular, hepatic fi- brosis [19,20].
THE PROGRESSION OF NAFLD AND THE PROGNOSIS IN PATIENTS WITH NAFLD
In two previous studies that followed patients with NAFLD for a median of more than 15 years, the major causes of mortality were CV diseases (approximately 30%), extrahepatic malignan- cies (approximately 19%), and liver-related complications (15%
to 19%) [9,21]. Although liver-related mortality could be higher in patients with NASH compared to those without NASH (sim- ple steatosis with or without nonspecific inflammation) with a
Table 1. Metabolic and Clinical Implications of Intrahepatic TG Content in Nonalcoholic Fatty Liver Disease [8,12-14]
Intrahepatic TG content Metabolic and histologic implications
>1.5% Decrease in the suppression of endogenous glucose production (on euglycemic clamp study)
Up to 4.2% Steep decrease in skeletal muscle glucose disposal (on euglycemic clamp study) and then reached a plateau
≥5% (5.56%) Steatosis defined
≥6.6% Increase in the severity of inflammation
Up to 8.1%
Up to 8.8% TG increase and then reached a plateau HDL-C decrease and then reached a plateau
Linearly correlated with Plasma insulin (decrease in insulin clearance), ALT, AST, adipose tissue insulin resistance At 6%±2% Metabolic changes are already fully established
12.4%
≥12.5% NASH diagnosed with a greater sensitivity
US positivity increases at optimal sensitivity
TG, triglyceride; HDL-C, high-density lipoprotein cholesterol; ALT, alanine aminotransferase; AST, aspartate aminotransferase; NASH, nonalcoholic steatohepatitis; US, ultrasonography.
longer follow-up [22], there has been a lack of evidence for ad- ditional differential risk of all-cause mortality between sub- groups of NAFLD patients with simple steatosis or NASH [9, 21-23]. Hepatic fibrosis is a key independent predictor that is associated with all-cause and CV mortality and mortality due to cirrhosis, HCC, and infectious diseases in patients with NAFLD [22-27]. However, the NAFLD activity score (NAS) for NASH was not shown to predict progression of fibrosis or mortality [24,25]. Thus, after the diagnosis of NAFLD, the stage of fibro- sis should be assessed appropriately [24]. In addition to fibrosis, diabetes and smoking, and absence of statin use are associated with an increase in mortality, highlighting the need for compre- hensive approaches in patients with NAFLD [25]. Collectively, at least 30% to 40% of patients with NAFLD require intensive observation and comprehensive measures to inhibit or regress the disease process [9,28].
LIMITATIONS OF LIVER BIOPSY
Liver biopsy may provide an accurate diagnosis in approxi- mately 90% of patients with unexplained abnormalities revealed by liver function tests [18]. However, liver biopsy represents only approximately 1/50,000 of the organ and has its own inher- ent limitations, such as sampling errors or bias [29]. In fact, ste- atosis and fibrosis are not uniformly distributed among the seg- ments of the liver [29,30]. Moreover, the progression of inflam- mation and fibrosis in NAFLD is a dynamic process for which liver biopsy may have limitations to follow all the stages of pro- gression of this highly prevalent disease [31].
Noninvasive tools for fibrosis staging have not yet been per- fected for therapeutic or other decisions but may be helpful for excluding the probability of significant fibrosis and for predict- ing advanced fibrosis, thus guiding the decision of whether or not to perform liver biopsy in a patient with NAFLD [32].
THE DIAGNOSIS AND EVALUATION OF NAFLD
Earlier studies reported that alanine aminotransferase (ALT) levels were elevated in 2.8% of the general population [33] and that 46.1% of asymptomatic subjects with elevated serum levels of hepatic enzymes were shown to have NAFLD on liver biop- sy [21]. For subjects at risk, the major important processes in the diagnosis and assessment of NAFLD are (1) to determine the existence of hepatic steatosis, either by imaging or histolo- gy; (2) to exclude secondary causes of fatty liver; and (3) to as-
sess NAFLD severity by establishing the presence of moderate- to-severe fibrosis (fibrosis stage of at least F2) [16]. Before making the diagnosis of NAFLD, secondary causes of hepatic fat accumulation and significant alcohol consumption (≥21 standard drinks/week for men and ≥14 standard drinks/week for women) need to be excluded [7]. Alcohol consumption over a 2-year time frame needs to be surveyed in detail using validat- ed questionnaires [7]. However, it is noteworthy that there is also synergy between alcohol intake and obesity or genetic risk factors of NAFLD progression for any given level of alcohol in- take [8]. Even in patients whose alcohol consumption level is low, meeting the diagnostic criteria of NAFLD, small amounts of alcohol intake may affect outcomes in NAFLD, which war- rants further study [7,34]. After performing a history and exami- nation, subsequent investigations should establish whether the patient has NAFLD or another liver condition.
A consensus regarding initial blood tests for NAFLD has not been reached among guidelines [35]. The decision on the extent of liver blood tests and interpretation of the results should be determined in a clinical context. In adults, initial screening tests may include abdominal US, hepatitis B surface antigen, hepati- tis C antibody (with follow-on polymerase chain reaction if positive), anti-mitochondrial antibody, anti-smooth muscle anti- body, antinuclear antibody, serum immunoglobulins, and simul- taneous serum ferritin and transferrin saturation [35].
Although ALT levels have been shown to be the best single biochemical correlate of hepatic steatosis, liver enzyme levels can be normal in up to 50% to 79% of patients with NAFLD, fluctuating, or elevated in patients with NAFLD [8,36]. There have been suggestions that the current upper limit of normal (ULN) for ALT may be too high [37,38], and a recent guidance recommended an ALT of >30 U/L as being significant for males and >25 U/L significant for females [39]. A slight eleva- tion of serum ferritin level (e.g., >1.5 ULN) generally reflects hepatic steatosis or secondary hemosiderosis rather than other liver diseases [40]. In many NAFLD patients, elevated ferritin may reflect a subclinical inflammatory state, rather than iron overload [31]. Similar to this observation, an R2* value on MRI (as an indicator of iron content) in its normal or minimally ele- vated range correlated more strongly with PDFF on MRI than the actual grade of hepatic iron content in patients with NAFLD [41]. Furthermore, low titers of autoimmune antibodies (in the absence of concomitant autoimmune hepatitis) are common and of no apparent clinical consequence [40].
Additionally, further clinical approaches to evaluate the pres- ence of commonly associated comorbidities, such as obesity, di-
www.e-enm.org
abetes, metabolic syndrome, hypertension, dyslipidemia, poly- cystic ovary syndrome, and obstructive sleep apnea, should also be performed [40].
NONINVASIVE STUDIES TO ASSESS HEPATIC STEATOSIS AND FIBROSIS
Blood markers of hepatic steatosis
Currently, no single biomarker is definitively diagnostic for NAFLD. Alternatively, noninvasive blood biomarkers for NAFLD may be useful for selecting subjects who need US screening for NAFLD. Clinical scores that have been developed to predict NAFL have included various clinical and laboratory parameters (Table 2) [29,42-48]. A previous study, where US, SteatoTest, and liver biopsy were performed together in 304 pa- tients, showed that concordance between steatosis diagnosed at both US examination and biopsy, was lower (kappa coeffi- cient=0.32±0.05) than the concordance between SteatoTest (at 0.50 cutoff) and biopsy (kappa=0.44±0.06; P=0.02) [45], in-
dicating both US and blood biomarker have low sensitivity in identifying steatosis. Furthermore, many different scoring sys- tems have been constructed based on specific populations or ethnic groups and have not been thoroughly validated across different ethnic populations. Thus, scoring systems may not be used for the diagnosis of NAFLD and decision-making process during the management of NAFLD prior to further validation [46]. Rather, these scoring systems may be useful for initial screening to select subjects who need a specific evaluation and for an epidemiologic prediction for NAFLD and/or cardiometa- bolic risk in population studies [44]. Further well-designed stud- ies are needed to determine which biomarker panels perform better as an initial noninvasive tool for NAFLD screening. In addition, it has not yet been determined if liver fat scores are ac- ceptable for monitoring patents during interventions aiming to reduce liver fat. A study showed that changes in fatty liver index and NAFLD liver fat score induced by a low-carb diet for 12 months did not correlated with changes of intrahepatic TG con- tent after the dietary intervention [49].
Table 2. Noninvasive Blood Biomarkers for the Prediction of Steatosis
Blood markers/Indices Components or equations AUROC/Cutoffs Study population (no. of
participants)/diagnostic tools Fatty liver index [42] e0.953×ln(TG)+0.139×BMI+0.718×ln(GGT)+0.053×WC−15.745/
[1+e0.953×ln(TG)+0.139×BMI+0.718×ln(GGT)+0.053×
WC−15.745]×100
0.79–0.85
Low cutoff: <30 (to rule out NAFLD) High cutoff: ≥60
Italian (n=496)/US
-Alcohol intake was not associated with fatty liver index
Hepatic steatosis index
[46] 8×(ALT/AST ratio)+BMI (+2, if female;
+2, if DM) 0.72–0.82
Cutoffs: <30 to rule out (sensitivity 92.5%)
: >36 to detect (specificity 92.4%)
Korean (n=10,724)/US
-Developed by using routine health check-up data from a university hospital healthcare center Lipid accumulation
product (LAP) [44,47][WC (cm)–65 (male) or –58 (female)]×[TG
(mmol/L)] 0.72–0.83
Cutoffs: ln(LAP): 4.14–4.45 NHANES III (development, n=9,180), Italian (evaluation, n=588)/US (in evaluation study) -Originally developed as an index of
cardiometabolic risk.
NAFLD liver fat score
[43] –2.89+1.18×MS (yes: 1, no: 0)+0.45×T2DM (yes: 2, No: 0)+0.15×fasting insulin in mU/
L+0.04×fasting AST in U/L–0.94×AST/ALT
0.78–0.87
Cutoff: –0.640 (86% sensitive, 71%
specific)
Finnish (n=470)/1H-MRS
NAFL screening score
[48] Age, FPG, BMI, TG, ALT/AST, uric acid 0.83–0.86
Cutoffs: >32 (male) or >29 (female) Chinese (n=48,489)/US
-Developed by using health check-up data from two hospitals
SteatoTest [45] ALT, ≥2-macroglobulin, apolipoprotein A1, haptoglobin, total bilirubin, GGT, total cholesterol, TG, glucose, age, gender, and BMI
0.72–0.86
Cutoffs: 0.3 (91% sensitivity) : 0.70 (89% specificity)
Caucasians (n=2,272)/liver biopsy -Not specific for NAFLD -Model equation was not presented.
AUROC, area under the receiver operating characteristic curve; TG, triglyceride; BMI, body mass index; GGT, γ-glutamyltransferase; WC, waist circum- ference; NAFLD, nonalcoholic fatty liver disease; US, ultrasonography; ALT, alanine aminotransferase; AST, aspartate aminotransferase; DM, diabetes mellitus; HDL-C, high-density lipoprotein cholesterol; NHANES III, the third National Health and Nutrition Examination Survey; MS, metabolic syn- drome; T2DM, type 2 diabetes mellitus; 1H-MRS, proton magnetic resonance spectroscopy; NAFL, nonalcoholic fatty liver; FPG, fasting plasma glucose.
IMAGING STUDIES
Currently, US, computed tomography (CT), MRI, 1H-MRS, and vibration-controlled transient elastography (VCTE) are relative- ly familiar imaging tools to study NAFLD depending on the center or clinic.
Ultrasonography and computed tomography
Although US generally has interobserver variability and limited sensitivity to detect mild (<20%) steatosis [16], it is the recom- mended first line screening method for patients with T2DM by the European NAFLD guidelines [34]. The sensitivity of liver US for the diagnosis of steatosis may be improved by the care- ful combination of different echographic parameters during the examination; with technical improvements in US equipment, optimum sensitivity could be achieved at a liver fat content of
≥12.5% (sensitivity of approximately 80% to 85%) [13,50].
The effect of liver fat content on examination is more pro- nounced when small amounts of fat are observed, as a previous study reported that liver US was only 12% sensitive to a 5% to 9% hepatic fat content in contrast to 80% sensitive to a ≥30%
liver fat content [51].
The radiodensity of water is 0 Hounsfield unit (HU) by defi- nition and air is defined as –1,000 HUs [16]. In non-contrast CT, normal liver parenchyma and fat are approximately 50 to 60 HUs and –20 to –100 HUs, respectively. Due to inconsisten- cy in HU calibration by external factors, ‘fat-free spleen’ can be used as an internal reference [16]. Hepatic HU less than 40 has been suggested as a cutoff value for steatosis (>30%) [52], and liver HU–spleen HU value less than –9 to –10 can be used as a reference to detect steatosis [16,52-54]. Similar to US, CT has limited sensitivity to detect mild steatosis (<30% liver fat). Ra- diation exposure is an additional drawback of CT scanning [16,52].
In addition, even though US and CT are fairly reliable in the condition of >30% liver fat, assessment of dynamic changes in liver fat is not reliable [40].
Vibration-controlled transient elastography and other methods
Elastography is a set of techniques by which tissue stiffness is estimated as a physical property termed the Young’s modulus [55]. VCTE measures the speed of a mechanically induced shear wave across the liver using pulse-echo ultrasonic acquisi- tions to obtain a liver stiffness measurement (LSM), as a marker of hepatic fibrosis, and ultrasonic energy loss as the sound wave
passes through the liver to derive the controlled attenuation pa- rameter (CAP), as a marker of hepatic steatosis. VCTE mea- sures approximately a 1 cm diameter to 4 cm length region of tissue, which is 100 times larger than that evaluated with liver biopsy [55]. The velocity of shear wave, which is perpendicular to the direction of pulse wave propagation, is proportional to liver stiffness, with quantitative results available as the algebra- ically derived Young’s modulus in kPa [55]. VCTE is an easy- to-perform tool to obtain both LSM and CAP values using an M (3.5 MHz, at 2.5 to 6.5 cm-depth), or in case of morbid obe- sity, XL (2.5 MHz, at 3.5 to 7.5 cm-depth) ultrasound probe.
LSM and CAP values range from 1.5 to 75 kPa and from 100 to 400 dB/m, respectively. The result of VCTE is obtained as a median of at least 10 measurements. Although the interquartile range (IQR) of the measurements less than 30% of the median is acceptable, an IQR median ratio ≤10% is the best predictor of accuracy [56]. CAP cutoffs for the diagnosis of steatosis have been variably reported from 248 to 288 dB/m that have wide range of sensitivity and specificity [57,58], as LSM cutoffs (≥
8.2 to 9.6 kPa) for advanced fibrosis have also been variably re- ported [13,57,59]. Very low values of LSM (e.g., <5.6 kPa, or
<6.5 kPa combined with a result from other non-invasive tests) suggest an exclusion of moderate fibrosis [60]. A recent excel- lent review summarized the performance of VCTE for the iden- tification of stages of fibrosis (Table 3) [56].
Although LSM and CAP values are relatively reliable and well-validated, these parameters are affected by various patient factors, especially body mass index (BMI), which may lead to an overestimation [61,62]. With the availability of the XL probe,
Table 3. Different VCTE-CAP and -LSM Cutoff Values for Dis- tinct Grades of Steatosis and Fibrosis in Patients with NAFLD [56]
Parameter Grades Cutoffs Sensitivity, % Specificity,
% CAP
(for steatosis), dB/m
S ≥1 (≥10%a) S ≥2 (≥33%a) S ≥3 (≥66%a)
214–289 255–311 281–310
64–91 57–96 64–100
64–94 62–94 53–92 LSM
(for fibrosis), kPa
F ≥2 F ≥3 F ≥4
6.2–11 8–12 9.5–20
62–90 84–100 90–100
74–100 83–97 75.9–98.4 The values are for the M probe. The cutoff values cannot be applied for the XL probe.
VCTE, vibration-controlled transient elastography; CAP, controlled at- tenuation parameter; LSM, liver stiffness measurement; NAFLD, non- alcoholic fatty liver disease.
a% of hepatocytes with fat.
www.e-enm.org
which has been proven for use in patients with morbid obesity, the failure rate of VCTE for obtaining the LSM and CAP values was reported to be less than 5%, while a significant disagree- ment was observed between the first and second readings for LSM and CAP when obtained back to back, at 18% and 11%, respectively [63]. However, the assessment of dynamic change with either VCTE-CAP or VCTE-LSM is not reliable [40].
VCTE data are not reliable under conditions in which a rapidly developing mass effect inside the liver will increase the intrahe- patic pressure and thereby reduce the liver elasticity: right-sided (global) congestive heart failure, acute inflammation and/or edema of the liver, and extrahepatic cholestasis [56]. In addi- tion, regarding food intake, a minimum 2-hour fast is currently recommended prior to the examination [56]. Because LSM does not represent absolute level of liver fibrosis, the results should also be interpreted with other clinical results (e.g., physical ex- amination, laboratory tests, and imaging methods) [56].
Shear wave elastography (SWE, or supersonic shear imaging) and acoustic radiation force impulse (ARFI) are additional methods that are integrated into conventional US devices to measure LSM, which allows US evaluation of the liver (e.g., screening for HCC) during the same session [29]. Although
SWE was shown to perform better than ARFI in differentiating
≥F2 fibrosis in patients with NAFLD, the three methods (VCTE, SWE, and ARFI) showed similar performances in dif- ferentiating ≥F3 stage of fibrosis and suffered from significant rate of failures or unreliable results [52,59].
Magnetic resonance-based techniques
1H-MRS has been a gold standard for the MR-based quantifica- tion of hepatic TG content in a size of 2×2×2 or 3×3×3 cm3 spectroscopic volume of interest, with high sensitivity and spec- ificity, but it remains primarily a research tool due to its low availability and limited clinical application [11,52]. Compared with liver biopsy (50 to 100 mg of sample size), a much larger volume of liver tissue is assessed using 1H-MRS, minimizing the likelihood of sampling error [11]. In the Dallas Heart Study, where the 1H-MRS method was used to measure hepatic TG content, the reproducibility of the procedure was validated by showing that duplicate hepatic TG measurements were highly correlated (r=0.99, P<0.001) and that the coefficient of varia- tion between measurements was low (8.5%) [11]. Essentially, in
1H-MRS for hepatic TG measurement, signals from protons as- sociated with TG are identified primarily by their resonance fre-
Chemical shift (ppm) Normal liver
Peak #1 (5.3 ppm)
Peak #1 (5.3 ppm) Peak #5
(1.3 ppm)
Water (4.7 ppm) Water
(4.7 ppm)
Chemical shift (ppm) Fatty liver
6.0 5.5 5.0 4.5 4.0 3.5 3.0 2.5 2.0 1.5 1.0 0.5 0 6.0 5.5 5.0 4.5 4.0 3.5 3.0 2.5 2.0 1.5 1.0 0.5 0
Fig. 1. Diagrams of spectrum obtained by hepatic proton magnetic resonance spectroscopy (1H-MRS). Proton spectra obtained from normal (A) and fatty (B) livers show resonance peaks from water and triglyceride (TG), with boxes highlighting the dominant lipid peaks from the resonance of methyl (-CH3) protons and methylene (-(CH2)n-) in the TG molecule along the frequency domain. ppm, parts per million.
A B
-CH3
-(CH2)n-
quencies (i.e., their position in the spectrum, x-axis) and are ex- pressed as a shift in frequency (in parts per million relative to signals from protons associated with water) (Fig. 1) [64]. Addi- tionally, the signal intensity of the metabolite (i.e., water or TG) peak (the amplitude measured along the y-axis) and the line width provide the “area” under a particular metabolite peak, which can be used to quantify the amount of observed metabo- lite within the sampled voxel of tissue (Fig. 1) [64]. The signal fat fraction (FF) is given as the fat signal (F) divided by the sum of the water (W) and fat signals [FF=F/(W+F)] [52].
In contrast to the measurement of differences in water and TG peaks on a resonance frequency domain by MRS, MRI uses fre- quency variation for spatial localization of the signal to a voxel to create a cross-sectional image [64]. Thus, advanced MRI can quantify hepatic steatosis by measuring the PDFF, which is the fraction of MRI-visible protons bound to fat divided by all pro- tons bound to fat and water in the whole liver (Fig. 2). Chemical shift imaging is applied to separate the liver signal into its water and fat signal components by acquiring gradient echoes at ap-
propriately spaced echo times [65,66].
The accuracy of MRI-PDFF was assessed through linear re- gression with MRS-PDFF, TG extraction, and histology in an elegant study by using ex vivo human livers [30], where MRI- PDFF showed an excellent correlation with MRS-PDFF (r=0.984) and strong correlation with histology (r=0.850) and tissue TG extraction (r=0.871). Furthermore, MRI-PDFF is not significantly affected by body factors, co-existing hepatic con- ditions, or technical factors [65]. Intraobserver agreement, in- terobserver agreement, and repeatability showed significantly smaller variance for MRI-PDFF than for histologic steatosis grading [30]. As the standard deviations of repeated MRI-PDFF measures have consistently been far less than 1%, MRI-PDFF can reliably detect longitudinal changes as small as 2 or less percentage points [65]. In line with this view, a clinical study showed that, longitudinally, patients who had a decrease or in- crease of MRI-PDFF ≥1% (confirmed by MRS-PDFF) showed a significant parallel decrease or increase in their body weight and serum aminotransferase levels at week 24 [67]. Such a
Fig. 2. Hepatic magnetic resonance imaging (MRI)-proton density fat fraction (PDFF). Liver MRI-PDFF study in a patient with nonalco- holic fatty liver disease (NAFLD) showing. (A, B) T1-weighted magnetic resonance images showing the automatic capturing of the liver and (C) the summary of results that shows PDFF of the whole liver (13.2%) as well as R2* value (as a marker for liver iron content). R2*
values of <126 S-1 are normal at 3T scanner examination [41].
B C
A
www.e-enm.org
small change in liver fat content could not be quantified with histology [67]. In a secondary analysis of a clinical trial involv- ing patients with biopsy-proven NASH, histologic responders (≥2-point reduction in NAS, without any worsening of fibrosis on liver biopsy) had a proportional reduction in the MRI-PDFF of 29.3% from baseline which was statistically significant when compared with histologic nonresponders [68]. In contrast to 1H- MRS and liver biopsy [30,64], MRI-PDFF is therefore a robust, quantitative, non-invasive, MRI-based technique that can be used to diagnose steatosis exactly at whatever the grade of the state for the entire liver; thereby, overcoming the heterogeneity of fat deposition and is useful for clinical trials [52,67,69-71].
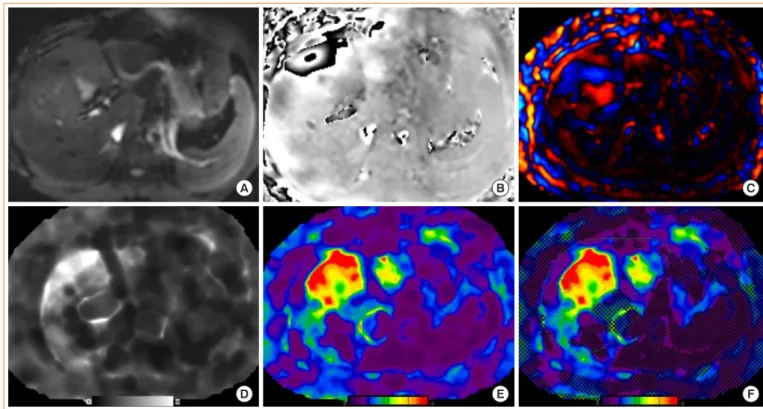
As an MR-based technique to measure parenchymal rigidity, after applying low-frequency vibrations to the abdominal wall, magnetic resonance elastography (MRE) tracks propagating shear waves by acquiring images with wave motion-sensitized phase-contrast sequences and processing raw images (i.e., mag- nitude and phase images) to “wave images” and then to “elasto- gram.” The cross-sectional elastogram images reflect the stiff- ness generated from the wave propagation information [72].
Technically, an MRE protocol can be performed with most MR scanners by adding hardware to generate mechanical waves and
adding specific software for acquisition and processing (Fig. 3) [65]. Because the waves can be visualized and analyzed deep into the liver, MRE evaluates much larger volumes of total liver (approximately 5%) than liver biopsy and can be performed in conjunction with conventional MRI [73].
Normal liver parenchyma has shear stiffness values less than 3 kPa [72]. Most studies have demonstrated that MRE has a high diagnostic accuracy, with AUC ≥0.90 for identifying ad- vanced fibrosis (F ≥3) and with MRE cutoff values ranging from 3.64 to 4.15 kPa [65,74-76]. Additionally, diagnostic accu- racy is not affected by patient body factors or disease states.
Thus, MRE is highly accurate for detecting hepatic fibrosis and the results are not influenced by patient demographics, making assessments reproducible across key sub-populations. In addi- tion, the inter-observer agreement for staging fibrosis is nearly perfect and higher than that seen with histopathology [65,75,76].
A 15% increase in MRE-LSM may be associated with histo- logic fibrosis progression and progression from early fibrosis to advanced fibrosis [73]. However, the cutoff value for percent change in MRE to define the improvement of fibrosis requires further studies; it seems that more than a 20% to 25% difference is required to be confident considering the repeatability coeffi-
Fig. 3. Hepatic magnetic resonance elastography (MRE). Liver MRE study in a patient with nonalcoholic fatty liver disease showing: (A) magnitude image, (B) phase contrast, (C) wave image, (D, E) gray and color scale stiffness maps (elastograms), and (F) color stiffness map with overlayed confidence map.
D A
E B
F C
cient of MRE-LSM [77,78]. Of note is that acute hepatic in- flammation may cause a false elevation of VCTE-LSM and MRE-LSM values without presence of fibrosis [72]. Fatty change in the liver does not affect MRE-LSM, whereas MRE- LSM does increase if simple steatosis progresses to inflamma- tion (NASH), even before the onset of fibrosis [72]. Although MRE may be helpful for the early differentiation of NASH from simple steatosis because significant proportion of patients with NASH have fibrosis or are going to progress to fibrosis, cur- rently MRE is not indicated for the diagnosis of NASH. How- ever, this view should not be rigid, because simple steatosis as well as NASH can progress to liver fibrosis [79,80]. Therefore, after the diagnosis of NAFLD, the ideal approach would be to try to detect and stage liver fibrosis even in the absence of NASH [52].
Many studies have directly compared and demonstrated that the performance of MRE and MRI-PDFF is better than that of VCTE-LSM and VCTE-CAP, respectively, in diagnosing fibro- sis and steatosis in NAFLD patients [81]. Furthermore, both MRI-PDFF and MRE as composite biomarkers have been part- ly validated in clinical trials [68,82].
As in VCTE, MRE needs to be performed in a fasting state, at least for 2 hours, because increased postprandial portal blood flow may cause a dynamic increase in liver stiffness in patients with liver disease, potentially leading to an overestimation of the extent of fibrosis [29,72].
Other imaging methods
In addition to SWE and ARFI, which are currently unpopular, perfusion CT, MRI using Gadoxetic acid or ultrasmall super- paramagnetic iron oxide particles as a contrast agent, MRI tar- geting myeloperoxidase and others have been studied to differ- entiate NASH or fibrosis [29,52].
BLOOD MARKERS OR CLINICAL SCORING SYSTEMS FOR HEPATIC FIBROSIS
ASSESSMENT
In patients with NAFLD, the severity of hepatic fibrosis is the most powerful determinant of long-term outcomes, including mortality [24]; thus, the assessment of fibrosis is essential to managing patients with NAFLD. Several prediction scores have been developed and validated to identify or exclude advanced fibrosis (≥F3). First-line testing should use either FIB-4 index or the NAFLD fibrosis score (NFS). The AST to platelet ratio index (APRI) has a relatively low sensitivity [29], but in our ex-
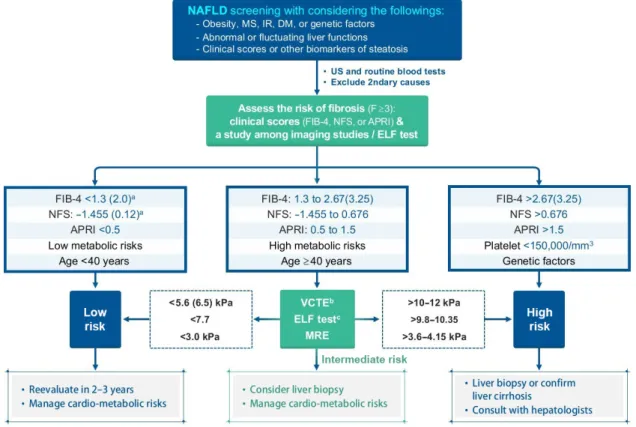
perience, it has a comparable performance to that of FIB-4 (un- published observation). Using these scoring systems, a signifi- cant proportion of patients at low risk of fibrosis could avoid an unnecessary liver biopsy [29]. Those patients with indetermi- nate FIB-4 (1.3 to 2.67) or NFS scores (–1.455 to 0.676) may comprise up to 30% of patients with NAFLD [83], requiring one of the second-line tests in a context-dependent manner, such as VCTE, serum enhanced liver fibrosis (ELF) score, or MRE.
The ELF score is a surrogate index based on an extracellular matrix panel consisting of plasma concentrations of hyaluronic acid, tissue inhibitor of metalloproteinase 1, and procollagen type III amino-terminal peptide [84] However, the ELF test seems to need further validation, even though European guide- lines recommend [34]. Patients with high FIB-4 (>2.67) or NFS (>0.676) values should be considered for referral to a specialist, irrespective of second-line tests [35] (Fig. 4). Thus, the use of these scores in combination with imaging studies seems to be more reasonable. Cytokeratin 18 fragments are created during cell death or apoptosis, and have been suggested as a NASH biomarker. However, the cytokeratin 18 fragment test did not outperform AST measurement in discriminating NASH from simple steatosis [85]. Although the combination of cytokeratin 18 with other parameters may improve the performance, this method requires further validation [29].
GENETIC VARIANTS
Variable prevalence of NAFLD and phenotypic expression of severity among populations, familial clustering, and twin stud- ies indicate that there are genetic factors associated with NAFLD [40,86]. It was reported that genetic factors account for approximately 50% of the interindividual differences in the prevalence of NASH with cirrhosis in a twin study [87].
Genome-wide association studies have revealed many genes associated with NAFLD, and functional studies on those genes have added much knowledge on the pathogenesis of NAFLD and complex pathophysiologic pathways related with the dis- ease, as a recent review provided systematic and detailed infor- mation on those genetic markers [86]. Among several genetic risk factors, single nucleotide polymorphisms (SNPs) in patatin- like phospholipase domain–containing 3 (PNPLA3) (rs738409 c.444 C>G, p.I148M), transmembrane 6 superfamily, member 2 (TM6SF2) (rs58542926 c.449 C>T, p.E167K), and membrane bound O-acyltransferase domain containing 7/transmembrane channel-like 4 (MBOAT7/TMC4) (rs641738 C>T) have been relatively well validated to promote the development of NAFLD
www.e-enm.org
and its progression (i.e., cirrhosis, HCC, or both) [88-92].
PNPLA3 encodes adiponutrin, a TG lipase that regulates both TG and retinoid metabolism and is mainly expressed in the liv- er, retina, skin, and adipose tissue [86]. The prevalence of the PNPLA3 I148M variant differs among ethnic groups ranging from 17% to 49%, and is generally correlated with that for NASH and its sequelae [86,90,93]. As such, a relatively high frequency of SNP in PNPLA3 risk allele has been reported in in Mexico, Japan, and Korea [40,94].
The variant is resistant to proteasomal degradation by evading ubiquitylation and accumulates on lipid droplets, which inter- feres with lipolysis and causes a change in phospholipid remod- eling [95]. The PNPLA3 SNP rs738409 is strongly associated with hepatic steatosis, steatohepatitis, fibrosis, and HCC, inde- pendent of the presence of T2DM and obesity [92,96]. Rather, obesity increases steatosis, liver cirrhosis, and HCC in carriers of the PNPLA3 I148M variant [86,97]. In patients with non- obese NAFLD, the variant of PNPLA3 is more prevalent and is associated with NAFLD regression [86]. In addition, a recent
phenome-wide association study showed that the variant of PNPLA3 is also associated with increased risk of T2DM and decreased risks of acne, gout, and gallstones [98].
TM6SF2 is involved in the secretion of apolipoprotein B-con- taining lipoproteins from hepatocytes, and TM6SF2 protein ex- pression is markedly decreased in the livers of patients with NAFLD compared to control subjects [86,99]. In contrast to PNPLA3, the expression of which is induced by carbohydrates and free fatty acids via sterol response element binding protein 1c, there is no interaction of TM6SF2 expression and dietary factors [86]. The SNP rs58542926 C>T in TM6SF2 is less prevalent (approximately 7%) than the PNPLA3 variant and re- sults in a loss-of-function mutation. It induces a higher liver TG content and lower circulating lipoproteins, but with preserved insulin sensitivity with regard to lipolysis and hepatic glucose production, and a lack of hypertriglyceridemia despite clearly increased hepatic fat content [86,100]. As with PNPLA3, the TM6SF2 minor (T) allele is associated with greater hepatic ste- atosis, more severe NASH and greater hepatic fibrosis/cirrhosis;
Fig. 4. Algorithm for nonalcoholic fatty liver disease (NAFLD) evaluation. Calculations: NFS=−1.675+0.037×age (yr)+0.094×BMI (kg/
m2)+1.13×IFG/DM (yes=1, no=0)+0.99×AST/ALT ratio–0.013×platelet (×109/L)–0.66×albumin (g/dL); FIB-4=(age×AST)/[PLT(×
109/L)×(√ALT)]; APRI=[AST (IU/L)/ULN/PLT(×109/L)]×100. MS, metabolic syndrome; IR, insulin resistance; DM, diabetes mellitus;
US, ultrasonography; FIB-4, fibrosis-4; NFS, NAFLD Fibrosis Score; APRI, AST to platelet ratio index; ELF, enhanced liver fibrosis; VCTE, vibration-controlled transient elastography; MRE, magnetic resonance elastography. aHigher cutoffs for patients aged >65 years; bAffected by body factors and suggested cutoff values have been variable; cFurther validation is required.
intriguingly, the more common major (C) allele is associated with the promotion of very low-density lipoprotein excretion, conferring an increased risk of dyslipidemia and CV disease [91,101]. In line with this, in a large exome-wide association study of plasma lipids in more than 300,000 individuals, the PNPLA3 I148M and TM6SF2 E167K variants were strongly as- sociated with hepatic steatosis and progression to NASH, cir- rhosis, and HCC, but also with lower blood TG and cholesterol concentrations and protection from coronary artery disease [86,92].
The SNP rs641738 C>T near MBOAT7 has been shown to impact inflammation and fibrosis in patients with alcoholic cir- rhosis, NAFLD, chronic hepatitis C, and chronic hepatitis B [102-105]. The rs641738 variant, which encodes p.G17E in TMC4, is associated with suppression of MBOAT7 at the mRNA and protein levels [86]. The MBOAT7/TMC4 rs641738 T allele has been shown to be associated with an increased risk of steatosis and histologic liver damage in NAFLD (i.e., higher severity of necro-inflammation and fibrosis) independent of obesity [104]. The variant may also predispose patients to HCC in patients without cirrhosis [91,106]. The MBOAT7 gene en- codes lysophosphatidylinositol (LPI) acyltransferase 1, known as LPIAT1 or MBOAT7, which selectively uses LPI and arachi- donoyl-CoA to form 2-arachidonoyl phosphatidylinositol (PI) [107,108]. Consistent with this function, lipidome changes in the plasma and liver of patients with NAFLD have been report- ed: decreases in plasma levels of PI (36:4), PI (38:3), and PI (38:5) and decreases in hepatic concentrations of PI (36:4) and PI (38:3) in proportion to the number of MBOAT7 variant al- leles [104,109]. LPIAT1 contributes to the regulation of free ar- achidonic acid in the cell through the remodeling of phospholip- ids [110]. MBOAT7 deficiency is thus predicted to increase free polyunsaturated fatty acids and their pro-inflammatory eico- sanoid lipids [106,111].
Glucokinase regulatory protein (GKRP), encoded by GCKR, is expressed only in the liver and regulates the partitioning of glucokinase between the cytosol and nucleus; thus it is involved in hepatic glucose uptake [112]. In the nucleus of hepatocyte, GKRP forms an inhibitory complex with glucokinase, the en- zyme responsible for regulating the uptake and storage of di- etary glucose [112]. Formation of the inhibitory complex is dis- rupted by glucose or fructose 1-phsophate after meals, resulting in translocation of glucokinase from the hepatocyte nucleus to the cytoplasm where it can drive glucose metabolism to glyco- gen synthesis and de novo lipogenesis. In contrast, fructose 6-phosphate (F6P), a by-product of gluconeogenesis and glyco-
genolysis, enhances the formation of an inhibitory complex be- tween the enzyme and the regulatory protein, thus promoting nuclear retention and inactivation of glucokinase during fasting periods [112]. The P446L (rs1260326 C>T) variant of GCKR, encodes a loss-of-function protein that is unable to inhibit glu- cokinase in response to F6P [86]. Thus, the P446L variant of GCKR is associated with increased hepatic glucose uptake, which in turn may contribute to increased production of malo- nyl-CoA and de novo lipogenesis, increased glycolytic pathway activity, and concomitantly decreased serum glucose and insulin levels [86,113]. The GCKR P446L variant is also associated with an increased risk of NASH progression, fibrosis, and NASH-HCC in NAFLD patients as well as elevated serum TG levels [114,115].
Nutritional factors are very important even when considering genetic factors, as adiposity has been shown to amplify the ef- fect of the NAFLD risk alleles in PNPLA3, TM6SF2, and GCKR [97,113]. Interestingly, in an Italian cohort study that evaluated the relationship between HCC risk and the total num- ber of risk alleles, including PNPLA3 I148M, TM6SF2 E167K, and MBOAT7 rs641738 T, there was a significant association between the number of risk alleles and HCC [106].
In addition, several protective variants have also been reported [114]. In particular, SNPs (rs72613567, rs62305723, and rs 6834314) in HSD17B13, a gene that encodes the hepatic lipid droplet protein 17β-hydroxysteroid dehydrogenase type 13, were reported to be associated with decreased inflammation, balloon- ing, fibrosis, and liver enzyme levels in patients with NAFLD [116,117].
Recently, HSD17B13 was identified as a lipid droplet enzyme retinol dehydrogenase, highlighting the importance of retinoid homeostasis in NAFLD and its progression [117]. The splice variant rs72613567:TA produces a truncated, nonfunctional protein that is associated with lower odds of various liver dis- eases and HCC [116]. It was also found that the isoform encod- ed by the protective allele is catalytically defective against es- tradiol [116].
Lean NAFLD may have clinical characteristics and distinct course of progression: low BMI and lower level of IR, but faster fibrosis progression [31]. Although the cost of genotyping sin- gle gene variants is decreasing, and the knowledge about the role of genetic impact on the progression and development of NAFLD has been expanded, the use of genetic markers in the diagnosis and follow-up of NAFLD is not recommended in cur- rent guidelines. However, whether specific genetic markers are useful for the identification of subgroups with NAFLD at high
www.e-enm.org
risk of aggressive progression to cirrhosis and/or HCC needs to be studied.
CONCLUSIONS
Noninvasive biomarker panels are easy to use as initial screen- ing test to rule out or rule in proceeding with imaging studies or liver biopsy. However, limited numbers of such tests have been validated and recommended in guidelines, for example, FIB-4 and NFS. Therefore, an imaging study, favorably US, may be considered under the current guidelines. However, MR-based techniques have more acceptable performance than others, al- though MRE-based fibrosis assessment and follow-up of the patients with fibrosis need to be further validated in the future.
In the meantime, it is recommended to combine noninvasive blood biomarker panels or clinical scoring systems with imag- ing tools that afford clinics the ability to diagnose and/or follow- up fibrosis to avoid unnecessary liver biopsies.
CONFLICTS OF INTEREST
No potential conflict of interest relevant to this article was re- ported.
ACKNOWLEDGMENTS
This research was supported by a grant from the Korea Health Technology R&D Project through the Korea Health Industry Development Institute (KHIDI) funded by the Ministry of Health and Welfare, Republic of Korea (grant numbers: HI14C1135).
ORCID
Dae Ho Lee https://orcid.org/0000-0002-8832-3052
REFERENCES
1. Allen AM, Therneau TM, Larson JJ, Coward A, Somers VK, Kamath PS. Nonalcoholic fatty liver disease incidence and impact on metabolic burden and death: a 20 year-com- munity study. Hepatology 2018;67:1726-36.
2. Younossi ZM, Koenig AB, Abdelatif D, Fazel Y, Henry L, Wymer M. Global epidemiology of nonalcoholic fatty liver disease-Meta-analytic assessment of prevalence, incidence, and outcomes. Hepatology 2016;64:73-84.
3. Park SH, Jeon WK, Kim SH, Kim HJ, Park DI, Cho YK, et
al. Prevalence and risk factors of non-alcoholic fatty liver disease among Korean adults. J Gastroenterol Hepatol 2006;21(1 Pt 1):138-43.
4. Jeong EH, Jun DW, Cho YK, Choe YG, Ryu S, Lee SM, et al. Regional prevalence of non-alcoholic fatty liver disease in Seoul and Gyeonggi-do, Korea. Clin Mol Hepatol 2013;
19:266-72.
5. Portillo-Sanchez P, Bril F, Maximos M, Lomonaco R, Bier- nacki D, Orsak B, et al. High prevalence of nonalcoholic fatty liver disease in patients with type 2 diabetes mellitus and normal plasma aminotransferase levels. J Clin Endocri- nol Metab 2015;100:2231-8.
6. Williams CD, Stengel J, Asike MI, Torres DM, Shaw J, Contreras M, et al. Prevalence of nonalcoholic fatty liver disease and nonalcoholic steatohepatitis among a largely middle-aged population utilizing ultrasound and liver biop- sy: a prospective study. Gastroenterology 2011;140:124-31.
7. Chalasani N, Younossi Z, Lavine JE, Charlton M, Cusi K, Rinella M, et al. The diagnosis and management of nonal- coholic fatty liver disease: practice guidance from the American Association for the Study of Liver Diseases.
Hepatology 2018;67:328-57.
8. Browning JD, Szczepaniak LS, Dobbins R, Nuremberg P, Horton JD, Cohen JC, et al. Prevalence of hepatic steatosis in an urban population in the United States: impact of eth- nicity. Hepatology 2004;40:1387-95.
9. Ekstedt M, Franzen LE, Mathiesen UL, Thorelius L, Hol- mqvist M, Bodemar G, et al. Long-term follow-up of pa- tients with NAFLD and elevated liver enzymes. Hepatolo- gy 2006;44:865-73.
10. Athyros VG, Alexandrides TK, Bilianou H, Cholongitas E, Doumas M, Ganotakis ES, et al. The use of statins alone, or in combination with pioglitazone and other drugs, for the treatment of non-alcoholic fatty liver disease/non-alcoholic steatohepatitis and related cardiovascular risk. An Expert Panel Statement. Metabolism 2017;71:17-32.
11. Szczepaniak LS, Nurenberg P, Leonard D, Browning JD, Reingold JS, Grundy S, et al. Magnetic resonance spectros- copy to measure hepatic triglyceride content: prevalence of hepatic steatosis in the general population. Am J Physiol Endocrinol Metab 2005;288:E462-8.
12. Bril F, Barb D, Portillo-Sanchez P, Biernacki D, Lomonaco R, Suman A, et al. Metabolic and histological implications of intrahepatic triglyceride content in nonalcoholic fatty liver disease. Hepatology 2017;65:1132-44.
13. Stefan N, Haring HU, Cusi K. Non-alcoholic fatty liver dis-
ease: causes, diagnosis, cardiometabolic consequences, and treatment strategies. Lancet Diabetes Endocrinol 2019;7:
313-24.
14. Wildman-Tobriner B, Middleton MM, Moylan CA, Rossi S, Flores O, Chang ZA, et al. Association between magnetic resonance imaging-proton density fat fraction and liver his- tology features in patients with nonalcoholic fatty liver dis- ease or nonalcoholic steatohepatitis. Gastroenterology 2018;
155:1428-35.
15. Nasr P, Forsgren MF, Ignatova S, Dahlstrom N, Cedersund G, Leinhard OD, et al. Using a 3% proton density fat frac- tion as a cut-off value increases sensitivity of detection of hepatic steatosis, based on results from histopathology analysis. Gastroenterology 2017;153:53-5.
16. Lee YH, Cho Y, Lee BW, Park CY, Lee DH, Cha BS, et al.
Nonalcoholic fatty liver disease in diabetes. Part I: epidemi- ology and diagnosis. Diabetes Metab J 2019;43:31-45.
17. Permutt Z, Le TA, Peterson MR, Seki E, Brenner DA, Sir- lin C, et al. Correlation between liver histology and novel magnetic resonance imaging in adult patients with non-al- coholic fatty liver disease: MRI accurately quantifies he- patic steatosis in NAFLD. Aliment Pharmacol Ther 2012;
36:22-9.
18. Bravo AA, Sheth SG, Chopra S. Liver biopsy. N Engl J Med 2001;344:495-500.
19. Wong VW, Chalasani N. Not routine screening, but vigi- lance for chronic liver disease in patients with type 2 diabe- tes. J Hepatol 2016;64:1211-3.
20. Corey KE, Klebanoff MJ, Tramontano AC, Chung RT, Hur C. Screening for nonalcoholic steatohepatitis in individuals with type 2 diabetes: a cost-effectiveness analysis. Dig Dis Sci 2016;61:2108-17.
21. Soderberg C, Stal P, Askling J, Glaumann H, Lindberg G, Marmur J, et al. Decreased survival of subjects with elevat- ed liver function tests during a 28-year follow-up. Hepatol- ogy 2010;51:595-602.
22. Rafiq N, Bai C, Fang Y, Srishord M, McCullough A, Gram- lich T, et al. Long-term follow-up of patients with nonalco- holic fatty liver. Clin Gastroenterol Hepatol 2009;7:234-8.
23. Taylor RS, Taylor RJ, Bayliss S, Hagstrom H, Nasr P, Schattenberg JM, et al. Association between fibrosis stage and outcomes of patients with nonalcoholic fatty liver dis- ease: a systematic review and meta-analysis. Gastroenterol- ogy 2020;158:1611-25.
24. Ekstedt M, Hagstrom H, Nasr P, Fredrikson M, Stal P, Ke- chagias S, et al. Fibrosis stage is the strongest predictor for
disease-specific mortality in NAFLD after up to 33 years of follow-up. Hepatology 2015;61:1547-54.
25. Angulo P, Kleiner DE, Dam-Larsen S, Adams LA, Bjorns- son ES, Charatcharoenwitthaya P, et al. Liver fibrosis, but no other histologic features, is associated with long-term outcomes of patients with nonalcoholic fatty liver disease.
Gastroenterology 2015;149:389-97.
26. Hagstrom H, Nasr P, Ekstedt M, Hammar U, Stal P, Hult- crantz R, et al. Fibrosis stage but not NASH predicts mor- tality and time to development of severe liver disease in bi- opsy-proven NAFLD. J Hepatol 2017;67:1265-73.
27. Hagstrom H, Nasr P, Ekstedt M, Hammar U, Stal P, Hult- crantz R, et al. Risk for development of severe liver disease in lean patients with nonalcoholic fatty liver disease: a long- term follow-up study. Hepatol Commun 2017;2:48-57.
28. Grgurevic I, Podrug K, Mikolasevic I, Kukla M, Madir A, Tsochatzis EA. Natural history of nonalcoholic fatty liver disease: implications for clinical practice and an individual- ized approach. Can J Gastroenterol Hepatol 2020;2020:
9181368.
29. Zhou JH, Cai JJ, She ZG, Li HL. Noninvasive evaluation of nonalcoholic fatty liver disease: current evidence and practice. World J Gastroenterol 2019;25:1307-26.
30. Bannas P, Kramer H, Hernando D, Agni R, Cunningham AM, Mandal R, et al. Quantitative magnetic resonance im- aging of hepatic steatosis: validation in ex vivo human liv- ers. Hepatology 2015;62:1444-55.
31. Kechagias S, Nasr P, Blomdahl J, Ekstedt M. Established and emerging factors affecting the progression of nonalco- holic fatty liver disease. Metabolism 2020 Feb 14 [Epub].
https://doi.org/10.1016/j.metabol.2020.154183.
32. Gunn NT, Shiffman ML. The use of liver biopsy in nonal- coholic fatty liver disease: when to biopsy and in whom.
Clin Liver Dis 2018;22:109-19.
33. Ludwig J, Viggiano TR, McGill DB, Oh BJ. Nonalcoholic steatohepatitis: Mayo Clinic experiences with a hitherto un- named disease. Mayo Clin Proc 1980;55:434-8.
34. European Association for the Study of the Liver (EASL);
European Association for the Study of Diabetes (EASD);
European Association for the Study of Obesity (EASO).
EASL-EASD-EASO clinical practice guidelines for the management of non-alcoholic fatty liver disease. Diabeto- logia 2016;59:1121-40.
35. Newsome PN, Cramb R, Davison SM, Dillon JF, Foulerton M, Godfrey EM, et al. Guidelines on the management of abnormal liver blood tests. Gut 2018;67:6-19.
www.e-enm.org
36. Bhatia LS, Curzen NP, Calder PC, Byrne CD. Non-alcohol- ic fatty liver disease: a new and important cardiovascular risk factor? Eur Heart J 2012;33:1190-200.
37. Prati D, Colli A, Conte D, Colombo M. Spectrum of NAFLD and diagnostic implications of the proposed new normal range for serum ALT in obese women. Hepatology 2005;42:1460-1.
38. Kwo PY, Cohen SM, Lim JK. ACG clinical guideline:
evaluation of abnormal liver chemistries. Am J Gastroen- terol 2017;112:18-35.
39. Terrault NA, Lok ASF, McMahon BJ, Chang KM, Hwang JP, Jonas MM, et al. Update on prevention, diagnosis, and treatment of chronic hepatitis B: AASLD 2018 hepatitis B guidance. Hepatology 2018;67:1560-99.
40. Cotter TG, Rinella M. Nonalcoholic fatty liver disease 2020:
the state of the disease. Gastroenterology 2020;158:1851-64.
41. Bashir MR, Wolfson T, Gamst AC, Fowler KJ, Ohliger M, Shah SN, et al. Hepatic R2* is more strongly associated with proton density fat fraction than histologic liver iron scores in patients with nonalcoholic fatty liver disease. J Magn Reson Imaging 2019;49:1456-66.
42. Bedogni G, Bellentani S, Miglioli L, Masutti F, Passalac- qua M, Castiglione A, et al. The fatty liver index: a simple and accurate predictor of hepatic steatosis in the general population. BMC Gastroenterol 2006;6:33.
43. Kotronen A, Peltonen M, Hakkarainen A, Sevastianova K, Bergholm R, Johansson LM, et al. Prediction of non-alco- holic fatty liver disease and liver fat using metabolic and genetic factors. Gastroenterology 2009;137:865-72.
44. Bedogni G, Kahn HS, Bellentani S, Tiribelli C. A simple index of lipid overaccumulation is a good marker of liver steatosis. BMC Gastroenterol 2010;10:98.
45. Poynard T, Ratziu V, Naveau S, Thabut D, Charlotte F, Messous D, et al. The diagnostic value of biomarkers (Stea- toTest) for the prediction of liver steatosis. Comp Hepatol 2005;4:10.
46. Lee JH, Kim D, Kim HJ, Lee CH, Yang JI, Kim W, et al.
Hepatic steatosis index: a simple screening tool reflecting nonalcoholic fatty liver disease. Dig Liver Dis 2010;42:503- 8.
47. Kahn HS. The “lipid accumulation product” performs bet- ter than the body mass index for recognizing cardiovascular risk: a population-based comparison. BMC Cardiovasc Disord 2005;5:26.
48. Zhou YJ, Zhou YF, Zheng JN, Liu WY, Van Poucke S, Zou TT, et al. NAFL screening score: a basic score identifying
ultrasound-diagnosed non-alcoholic fatty liver. Clin Chim Acta 2017;475:44-50.
49. Kabisch S, Bather S, Dambeck U, Kemper M, Gerbracht C, Honsek C, et al. Liver fat scores moderately reflect inter- ventional changes in liver fat content by a low-fat diet but not by a low-carb diet. Nutrients 2018;10:157.
50. Bril F, Ortiz-Lopez C, Lomonaco R, Orsak B, Freckleton M, Chintapalli K, et al. Clinical value of liver ultrasound for the diagnosis of nonalcoholic fatty liver disease in over- weight and obese patients. Liver Int 2015;35:2139-46.
51. Ryan CK, Johnson LA, Germin BI, Marcos A. One hun- dred consecutive hepatic biopsies in the workup of living donors for right lobe liver transplantation. Liver Transpl 2002;8:1114-22.
52. Chartampilas E. Imaging of nonalcoholic fatty liver disease and its clinical utility. Hormones (Athens) 2018;17:69-81.
53. Piekarski J, Goldberg HI, Royal SA, Axel L, Moss AA.
Difference between liver and spleen CT numbers in the normal adult: its usefulness in predicting the presence of diffuse liver disease. Radiology 1980;137:727-9.
54. Park SH, Kim PN, Kim KW, Lee SW, Yoon SE, Park SW, et al. Macrovesicular hepatic steatosis in living liver do- nors: use of CT for quantitative and qualitative assessment.
Radiology 2006;239:105-12.
55. Ozturk A, Grajo JR, Dhyani M, Anthony BW, Samir AE.
Principles of ultrasound elastography. Abdom Radiol (NY) 2018;43:773-85.
56. Mikolasevic I, Orlic L, Franjic N, Hauser G, Stimac D, Milic S. Transient elastography (FibroScan(®)) with con- trolled attenuation parameter in the assessment of liver ste- atosis and fibrosis in patients with nonalcoholic fatty liver disease: where do we stand? World J Gastroenterol 2016;
22:7236-51.
57. Caussy C, Alquiraish MH, Nguyen P, Hernandez C, Cepin S, Fortney LE, et al. Optimal threshold of controlled attenu- ation parameter with MRI-PDFF as the gold standard for the detection of hepatic steatosis. Hepatology 2018;67:
1348-59.
58. Karlas T, Petroff D, Sasso M, Fan JG, Mi YQ, de Ledingh- en V, et al. Individual patient data meta-analysis of con- trolled attenuation parameter (CAP) technology for assess- ing steatosis. J Hepatol 2017;66:1022-30.
59. Cassinotto C, Boursier J, de Ledinghen V, Lebigot J, Lapuyade B, Cales P, et al. Liver stiffness in nonalcoholic fatty liver disease: a comparison of supersonic shear imag- ing, FibroScan, and ARFI with liver biopsy. Hepatology
2016;63:1817-27.
60. Siddiqui MS, Vuppalanchi R, Van Natta ML, Hallinan E, Kowdley KV, Abdelmalek M, et al. Vibration-controlled transient elastography to assess fibrosis and steatosis in pa- tients with nonalcoholic fatty liver disease. Clin Gastroen- terol Hepatol 2019;17:156-63.
61. Petta S, Ciminnisi S, Di Marco V, Cabibi D, Camma C, Li- cata A, et al. Sarcopenia is associated with severe liver fi- brosis in patients with non-alcoholic fatty liver disease. Ali- ment Pharmacol Ther 2017;45:510-8.
62. Shen F, Zheng RD, Shi JP, Mi YQ, Chen GF, Hu X, et al.
Impact of skin capsular distance on the performance of controlled attenuation parameter in patients with chronic liver disease. Liver Int 2015;35:2392-400.
63. Vuppalanchi R, Siddiqui MS, Van Natta ML, Hallinan E, Brandman D, Kowdley K, et al. Performance characteris- tics of vibration-controlled transient elastography for evalu- ation of nonalcoholic fatty liver disease. Hepatology 2018;
67:134-44.
64. Qayyum A. MR spectroscopy of the liver: principles and clinical applications. Radiographics 2009;29:1653-64.
65. Dulai PS, Sirlin CB, Loomba R. MRI and MRE for non-in- vasive quantitative assessment of hepatic steatosis and fi- brosis in NAFLD and NASH: clinical trials to clinical prac- tice. J Hepatol 2016;65:1006-16.
66. Lee SS, Park SH. Radiologic evaluation of nonalcoholic fatty liver disease. World J Gastroenterol 2014;20:7392- 402.
67. Noureddin M, Lam J, Peterson MR, Middleton M, Hamil- ton G, Le TA, et al. Utility of magnetic resonance imaging versus histology for quantifying changes in liver fat in non- alcoholic fatty liver disease trials. Hepatology 2013;58:
1930-40.
68. Patel J, Bettencourt R, Cui J, Salotti J, Hooker J, Bhatt A, et al. Association of noninvasive quantitative decline in liver fat content on MRI with histologic response in nonalcohol- ic steatohepatitis. Therap Adv Gastroenterol 2016;9:692- 701.
69. Le TA, Chen J, Changchien C, Peterson MR, Kono Y, Pat- ton H, et al. Effect of colesevelam on liver fat quantified by magnetic resonance in nonalcoholic steatohepatitis: a ran- domized controlled trial. Version 2. Hepatology 2012;56:
922-32.
70. Capitan V, Petit JM, Aho S, Lefevre PH, Favelier S, Loff- roy R, et al. Macroscopic heterogeneity of liver fat: an MR- based study in type-2 diabetic patients. Eur Radiol 2012;22:
2161-8.
71. Kim KY, Song JS, Kannengiesser S, Han YM. Hepatic fat quantification using the proton density fat fraction (PDFF):
utility of free-drawn-PDFF with a large coverage area. Ra- diol Med 2015;120:1083-93.
72. Venkatesh SK, Yin M, Ehman RL. Magnetic resonance elastography of liver: technique, analysis, and clinical ap- plications. J Magn Reson Imaging 2013;37:544-55.
73. Ajmera VH, Liu A, Singh S, Yachoa G, Ramey M, Bharga- va M, et al. Clinical utility of an increase in magnetic reso- nance elastography in predicting fibrosis progression in nonalcoholic fatty liver disease. Hepatology 2020;71:849- 60.
74. Singh S, Venkatesh SK, Loomba R, Wang Z, Sirlin C, Chen J, et al. Magnetic resonance elastography for staging liver fibrosis in non-alcoholic fatty liver disease: a diagnostic ac- curacy systematic review and individual participant data pooled analysis. Eur Radiol 2016;26:1431-40.
75. Kim D, Kim WR, Talwalkar JA, Kim HJ, Ehman RL. Ad- vanced fibrosis in nonalcoholic fatty liver disease: noninva- sive assessment with MR elastography. Radiology 2013;
268:411-9.
76. Loomba R, Wolfson T, Ang B, Hooker J, Behling C, Peter- son M, et al. Magnetic resonance elastography predicts ad- vanced fibrosis in patients with nonalcoholic fatty liver dis- ease: a prospective study. Version 2. Hepatology 2014;60:
1920-8.
77. Jayakumar S, Middleton MS, Lawitz EJ, Mantry PS, Caldwell SH, Arnold H, et al. Longitudinal correlations be- tween MRE, MRI-PDFF, and liver histology in patients with non-alcoholic steatohepatitis: analysis of data from a phase II trial of selonsertib. J Hepatol 2019;70:133-41.
78. Serai SD, Obuchowski NA, Venkatesh SK, Sirlin CB, Mill- er FH, Ashton E, et al. Repeatability of MR elastography of liver: a meta-analysis. Radiology 2017;285:92-100.
79. Pais R, Charlotte F, Fedchuk L, Bedossa P, Lebray P, Poy- nard T, et al. A systematic review of follow-up biopsies re- veals disease progression in patients with non-alcoholic fat- ty liver. J Hepatol 2013;59:550-6.
80. Singh S, Allen AM, Wang Z, Prokop LJ, Murad MH, Loomba R. Fibrosis progression in nonalcoholic fatty liver vs nonalcoholic steatohepatitis: a systematic review and meta-analysis of paired-biopsy studies. Clin Gastroenterol Hepatol 2015;13:643-54.
81. Imajo K, Kessoku T, Honda Y, Tomeno W, Ogawa Y, Mawatari H, et al. Magnetic resonance imaging more accu-
![Table 1. Metabolic and Clinical Implications of Intrahepatic TG Content in Nonalcoholic Fatty Liver Disease [8,12-14]](https://thumb-ap.123doks.com/thumbv2/123dokinfo/5225074.124624/2.892.75.820.828.1059/table-metabolic-clinical-implications-intrahepatic-content-nonalcoholic-disease.webp)

![Table 3. Different VCTE-CAP and -LSM Cutoff Values for Dis- Dis-tinct Grades of Steatosis and Fibrosis in Patients with NAFLD [56]](https://thumb-ap.123doks.com/thumbv2/123dokinfo/5225074.124624/5.892.465.823.842.993/table-different-cutoff-values-grades-steatosis-fibrosis-patients.webp)