Background and Purpose Optical coherence tomography (OCT) and visual evoked poten- tials (VEPs) can be used to detect optic neuritis (ON). However, the comparative sensitivities of OCT and VEPs for detecting ON in neuromyelitis optica spectrum disorder (NMOSD) are un- clear, and so we assessed these sensitivities.
Methods This cross-sectional study included 73 patients with aquaporin-4 antibody-seropos- itive NMOSD, and 101 eyes with ON. The clinical characteristics, visual acuity (VA), Expanded Disability Status Scale (EDSS) scores, OCT peripapillary retinal nerve fiber layer (RNFL) thick- ness, and VEPs of the patients were evaluated.
Results OCT and VEPs were abnormal in 68% and 73% of eyes with a history of ON, respec- tively, and in 2% and 9% of eyes without ON. Test sensitivities were influenced by the number of ON episodes: the OCT RNFL thickness and VEPs were abnormal in 50% and 67% of the eyes with first-ever ON episode, respectively (p=0.041), with the combination of both tests de- tecting abnormalities in up to 75% of the eyes. The sensitivities of the OCT RNFL thickness and VEPs increased to 95% and 83%, respectively, after the second or subsequent ON episode (p=0.06), with the combination of both tests detecting abnormalities in 95% of cases. The OCT RNFL thickness and VEP latency/amplitude were correlated with EDSS scores and VA.
Conclusions VEPs were superior for detecting subclinical or first-ever ON, while OCT was better for detecting eyes with multiple ON episodes. The correlations of OCT and VEPs with clin- ical disability measures indicate that these tests are potential markers of the disease burden in NMOSD.
Key Words neuromyelitis optica, neuromyelitis optica spectrum disorder, optical coherence tomography, visual evoked potentials, optic neuritis.
Optical Coherence Tomography versus Visual Evoked Potentials for Detecting Visual Pathway Abnormalities in Patients with Neuromyelitis Optica Spectrum Disorder
INTRODUCTION
Optic neuritis (ON) is a common feature of multiple sclerosis (MS) and neuromyelitis opti- ca spectrum disorder (NMOSD). ON in NMOSD leads to greater axonal injury and more- severe visual impairment than ON in MS.1 ON is a core clinical characteristic in the revised diagnostic criteria for NMOSD and has been added as one of the five critical lesions in the recently revised diagnostic criteria for MS.2,3 Detecting ON has become increasingly impor- tant for diagnosing both MS and NMOSD.2,3
Optical coherence tomography (OCT) and visual evoked potentials (VEPs) have been used to assess visual pathways in patients with ON.4,5 OCT can be used to noninvasively measure the thickness of the retinal nerve fiber layer (RNFL), which is composed of unmy- elinated optic nerve axons. OCT is advantageous because it has a high resolution (8–10 μm) Nam-Hee Kima
Ho Jin Kimb Cheol-Yong Parkc Kyoung Sook Jeongd Joong-Yang Choe
a Departments of Neurology,
c Ophthalmology, and dOccupational and Environmental Medicine,
Dongguk University Ilsan Hospital, Goyang, Korea
b Department of Neurology, Research Institute and Hospital of National Cancer Center, Goyang, Korea
e Department of Neurology, Ilsan Paik Hospital, Inje University College of Medicine, Goyang, Korea
pISSN 1738-6586 / eISSN 2005-5013 / J Clin Neurol 2018;14(2):200-205 / https://doi.org/10.3988/jcn.2018.14.2.200
Received August 22, 2017 Revised November 21, 2017 Accepted November 24, 2017 Correspondence Joong-Yang Cho, MD, PhD Department of Neurology, Ilsan Paik Hospital, Inje University College of Medicine, 170 Juhwa-ro, Ilsanseo-gu, Goyang 10380, Korea Tel +82-31-910-7929
Fax +82-31-910-7368
E-mail [email protected]
cc This is an Open Access article distributed under the terms of the Creative Commons Attribution Non-Com- mercial License (http://creativecommons.org/licenses/by-nc/4.0) which permits unrestricted non-commercial use, distribution, and reproduction in any medium, provided the original work is properly cited.
JCN
Open Access ORIGINAL ARTICLEKim NH et al.
JCN
and good reproducibility.6,7 A thin RNFL determined using OCT is considered indicative of axonal damage of the optic nerve,6 which is more severe in NMOSD than in MS.1,5,8 Full- field VEP waveforms with preserved amplitude but delayed latency—which are suggestive of optic nerve demyelination—
are typical features in MS.4,9-11 However, studies of VEP wave- forms in NMOSD have produced conflicting results. One study found that waveforms with reduced amplitude but pre- served latency (suggestive of optic nerve axonal damage) are typical in NMOSD,12 while another study found that, as in MS, those exhibiting delayed latency are common in NMOSD.13 Additional studies are thus required to clarify the typical VEP patterns in NMOSD.
While many studies have evaluated the pathophysiology and clinical severity of MS or NMOSD using OCT and VEPs, few studies have examined the other potential clinical appli- cations of these two techniques, particularly in patients with NMOSD. Moreover, little is known about the sensitivities of these techniques for detecting visual pathway abnormalities in NMOSD, and studies investigating the comparative sensi- tivities of OCT and VEPs for detecting ON have produced conflicting results. One study showed that VEPs were superi- or to OCT for detecting clinical and subclinical ON in mixed demyelinating diseases (mainly MS),4 but another study found that VEPs exhibited similar sensitivity to OCT for de- tecting clinical ON in MS.9 We therefore evaluated the com- parative sensitivities of OCT and VEPs with the aim of de- termining the relative usefulness of these two techniques as markers of the disease burden in NMOSD.
METHODS
Patients
All patients testing positive for the antibody to aquaporin-4 were enrolled regardless of past clinical episodes of ON. Pa- tients who had an episode of ON within the last 6 months were excluded to minimize the effect of optic disc swelling by acute ON.14 Subjects were also excluded from the analysis if they had a history of glaucoma, diabetes, or retinal disease, which may affect OCT measurements. All patients under- went a full ophthalmologic assessment including a visual acuity (VA) test, color vision test, slit-lamp biomicroscopy, and fundus examination. This cross-sectional study was ap- proved by the local Human Research Protection Office/Insti- tutional Review Board (IRB No. 2009-36), and all subjects provided written informed consent.
Evaluations
The best-corrected VA was measured using a retroilluminat- ed Snellen chart. VA was measured on a decimal scale but
then transformed into the logarithm of the minimum angle of resolution (logMAR) for the statistical analysis.
OCT was used to measure the peripapillary RNFL thick- ness with the aid of the Stratus OCT-3 device with version 4.0 software (Carl Zeiss Meditec, Dublin, CA, USA). Fast RNFL thickness protocols were used. Scans were accepted for the anal- ysis if they met the criteria of good-quality scans defined in the Stratus OCT-3 user manual, including signal strengths of 7 or higher (on a score with a maximum of 10), correct center- ing, and uniform brightness. Abnormal thinning of the RNFL was detected via comparisons with reference values provided in the built-in Zeiss Stratus OCT database. Values that were two standard deviations below the normal mean were consid- ered to indicate abnormal thinning. The data were stratified by age.
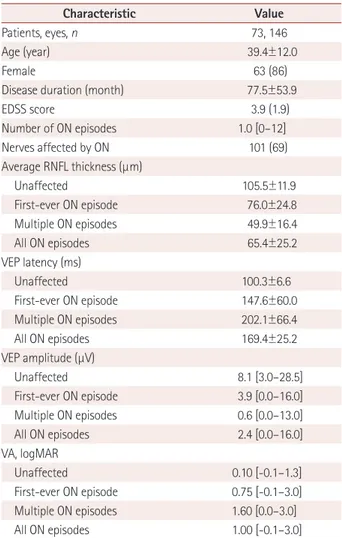
Table 1. Demographic and clinical characteristics of the patients
Characteristic Value
Patients, eyes, n 73, 146
Age (year) 39.4±12.0
Female 63 (86)
Disease duration (month) 77.5±53.9
EDSS score 3.9 (1.9)
Number of ON episodes 1.0 [0–12]
Nerves affected by ON 101 (69)
Average RNFL thickness (μm)
Unaffected 105.5±11.9
First-ever ON episode 76.0±24.8
Multiple ON episodes 49.9±16.4
All ON episodes 65.4±25.2
VEP latency (ms)
Unaffected 100.3±6.6
First-ever ON episode 147.6±60.0
Multiple ON episodes 202.1±66.4
All ON episodes 169.4±25.2
VEP amplitude (μV)
Unaffected 8.1 [3.0–28.5]
First-ever ON episode 3.9 [0.0–16.0]
Multiple ON episodes 0.6 [0.0–13.0]
All ON episodes 2.4 [0.0–16.0]
VA, logMAR
Unaffected 0.10 [-0.1–1.3]
First-ever ON episode 0.75 [-0.1–3.0]
Multiple ON episodes 1.60 [0.0–3.0]
All ON episodes 1.00 [-0.1–3.0]
We classified eyes into unaffected (n=45), first-ever ON episode (n=60), and multiple ON episodes (n=41).
Data are mean±standard-deviation, n (%), or median [range] values (ex- cept where indicated).
EDSS: Expanded Disability Status Scale, logMAR: logarithm of the mini- mum angle of resolution, ON: optic neuritis, RNFL: retinal nerve fiber layer, VA: visual acuity, VEP: visual evoked potential.
OCT versus VEP in Patients with NMOSD
JCN
VEPs induced by a pattern reversal (with a visual angle of 30 minutes of arc) were recorded over electrode Oz of the in- ternational 10-20 system, with Cz as the reference. The laten- cy and amplitude of the P100 component were measured. A prolonged absolute latency (normal limit: 111.53 ms), large interside difference in latency (normal limit: 5.75 ms), or ab- sence of the P100 component was considered abnormal. If the waveform was absent owing to ON-related poor vision, a value of 250 ms was used since this represents the most-prolonged waveform obtainable with the measuring device used.
Statistical analysis
All statistical analyses were performed using SPSS (version 20, IBM Corp., Armonk, NY, USA). The McNemar test was used to compare whether dichotomized proportions were equivalent. Correlation analyses were performed using the parametric Pearson’s coefficient (r). The cutoff for statistical significance was set at p<0.05.
RESULTS
Clinical characteristics
Data from 73 patients with NMOSD (43 patients had bilater- al ON and 15 patients had unilateral ON) were analyzed. Of the 146 eyes, 101 were affected by ON (60 eyes with a single ON episode and 41 eyes with multiple ON episodes) and 45
were unaffected by ON. The demographic and clinical char- acteristics of the patients are presented in Table 1.
Sensitivities of OCT and VEPs
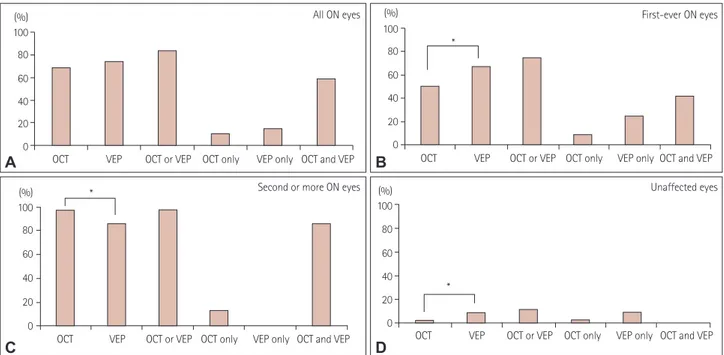
The findings of OCT and VEP examinations were abnormal in 68% and 73% of the 101 eyes with a history of ON, respec- tively (McNemar test, p=0.42). Of the 101 eyes affected by ON, 10 (10%) were identified by OCT alone, 15 (15%) were identified by VEPs alone, and 59 (58%) were identified by applying both techniques together. The combination of these two techniques detected abnormalities in 83% of the eyes and significantly improved the sensitivity relative to using ei- ther technique alone (p<0.01, Fig. 1).
The sensitivity of each technique was dependent on the number of ON episodes. After a single ON episode (n=60), VEPs were more sensitive than OCT, with abnormalities de- tected in 67% versus 50% of eyes, respectively (McNemar test, p=0.041). Abnormalities were detected in 5 eyes (8%) by OCT alone, 15 eyes (25%) by VEPs alone, and 25 eyes (42%) by both techniques. The combination of VEPs and OCT detect- ed abnormalities in 75% of eyes and improved the sensitivity relative to OCT alone (McNemar test, p<0.01) or VEPs alone (McNemar test, p=0.06) (Fig. 1).
After multiple ON episodes (n=41), 95% and 83% of eyes had abnormal OCT and VEP results, respectively, indicating that OCT seemed to be superior to VEPs in detecting abnor-
Fig. 1. Percentages of abnormal tests in all 101 eyes with a history of ON (A), in 60 eyes with first-ever ON (B), in 41 eyes with multiple ON epi- sodes (C), and in 45 unaffected eyes (D). Abnormal findings in VEP tests were more frequent in eyes with subclinical or first-ever ON, while abnor- mal findings in OCT tests were more frequent in eyes with multiple ON episodes. OCT or VEP, eyes with at least one abnormal OCT or VEP finding;
OCT only, eyes with abnormal OCT and normal VEP findings; VEP only, eyes with abnormal VEP and normal OCT findings; OCT and VEP, eyes with abnormal OCT and abnormal VEP findings. *p<0.05. OCT: optical coherence tomography, ON: optical neuritis, VEP: visual evoked potential.
(%) 100 80 60 40 20 0 OCT VEP OCT or VEP OCT only VEP only OCT and VEP (%)
100 80 60 40 20 0
OCT VEP OCT or VEP OCT only VEP only OCT and VEP
*
OCT VEP OCT or VEP OCT only VEP only OCT and VEP (%)
100 80 60 40 20 0
*
OCT VEP OCT or VEP OCT only VEP only OCT and VEP
*
A
C
B
D
(%) 100 80 60 40 20 0 All ON eyes
Second or more ON eyes
First-ever ON eyes
Unaffected eyes
Kim NH et al.
JCN
malities (McNemar test, p=0.06). Abnormalities were detect- ed in 5 eyes (12%) by OCT alone, in no eyes by VEPs alone, and in 34 eyes (83%) by both techniques. Ninety-five percent of eyes with multiple ON episodes had an abnormality in ei- ther OCT or VEPs, which was better than VEPs alone (McNe- mar test, p=0.06) and did not differ from the sensitivity for OCT alone (Fig. 1).
Five (11%) of the 45 eyes without a history of ON had ab- normalities in either VEPs or OCT. One eye (2%) was iden- tified by OCT alone and four eyes (9%) were identified by VEPs alone (Fig. 1). VEPs seemed to be superior for detecting subclinical ON, although no significant difference was noted (McNemar test, p=0.38) due to an insufficient number of
eyes with subclinical ON.
Correlations
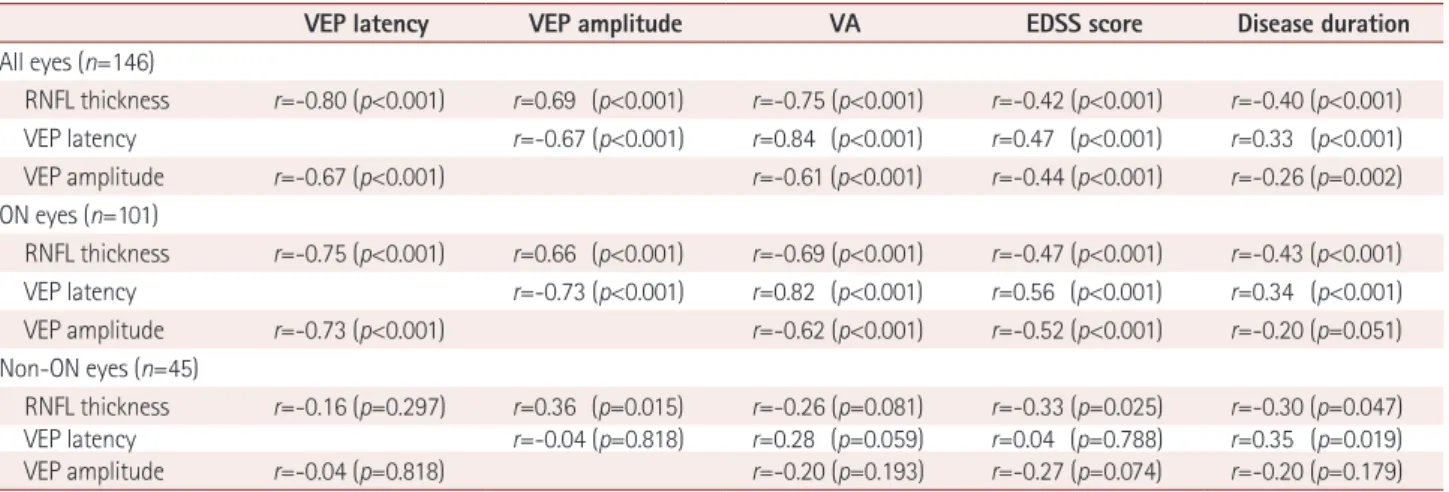
When evaluating all 146 eyes, the RNFL thickness was strong- ly and linearly correlated with VEP latency and amplitude (Table 2, Fig. 2). The RNFL thickness, VEP latency, and VEP amplitude were each significantly correlated with VA, Ex- panded Disability Status Scale (EDSS) score, and disease du- ration.
In eyes with a history of ON (n=101), the RNFL thickness was significantly correlated with VEP latency and amplitude.
In addition, the RNFL thickness, VEP latency, and VEP am- plitude were significantly correlated with VA, EDSS score, Table 2. Correlations among RNFL thickness, VEP amplitude, VEP latency, VA, EDSS score, and disease duration
VEP latency VEP amplitude VA EDSS score Disease duration
All eyes (n=146)
RNFL thickness r=-0.80 (p<0.001) r=0.69 (p<0.001) r=-0.75 (p<0.001) r=-0.42 (p<0.001) r=-0.40 (p<0.001) VEP latency r=-0.67 (p<0.001) r=0.84 (p<0.001) r=0.47 (p<0.001) r=0.33 (p<0.001) VEP amplitude r=-0.67 (p<0.001) r=-0.61 (p<0.001) r=-0.44 (p<0.001) r=-0.26 (p=0.002) ON eyes (n=101)
RNFL thickness r=-0.75 (p<0.001) r=0.66 (p<0.001) r=-0.69 (p<0.001) r=-0.47 (p<0.001) r=-0.43 (p<0.001) VEP latency r=-0.73 (p<0.001) r=0.82 (p<0.001) r=0.56 (p<0.001) r=0.34 (p<0.001) VEP amplitude r=-0.73 (p<0.001) r=-0.62 (p<0.001) r=-0.52 (p<0.001) r=-0.20 (p=0.051) Non-ON eyes (n=45)
RNFL thickness r=-0.16 (p=0.297) r=0.36 (p=0.015) r=-0.26 (p=0.081) r=-0.33 (p=0.025) r=-0.30 (p=0.047)
VEP latency r=-0.04 (p=0.818) r=0.28 (p=0.059) r=0.04 (p=0.788) r=0.35 (p=0.019)
VEP amplitude r=-0.04 (p=0.818) r=-0.20 (p=0.193) r=-0.27 (p=0.074) r=-0.20 (p=0.179)
r=Pearson’s r.
EDSS: Expanded Disability Status Scale, RNFL: retinal nerve fiber layer, VA: visual acuity, VEP: visual evoked potential.
r=0.69 p<0.001
0 20 40 60 80 100 120 140 RNFL thickness (μm)
30
25
20
15
10
5
0
VEP amplitude (μV)
r=-0.80 p<0.001
0 20 40 60 80 100 120 140 RNFL thickness (μm)
300
250
200
150
100
50
0
VEP latency (ms)
A B
Fig. 2. Correlations (in all eyes) between the RNFL thickness and VEP latency (r=–0.80, p<0.001) (A) and between the RNFL thickness and VEP am- plitude (r=0.69, p<0.001) (B). RNFL: retinal nerve fiber layer, VEP: visual evoked potential.
OCT versus VEP in Patients with NMOSD
JCN
and disease duration (Table 2).
In eyes without a history of ON (n=45), the RNFL thick- ness was significantly correlated with VEP amplitude, EDSS score, and disease duration. When using VEPs, a significant correlation was only observed between VEP latency and dis- ease duration (Table 2).
DISCUSSION
This study investigated the utility and limitations of OCT and VEPs for detecting ON in NMOSD. VEPs appeared to be more sensitive for subclinical and first-ever ON, while OCT was more sensitive in eyes with multiple ON episodes.
OCT can potentially be used to detect ON and assess the risk of future visual disability as a marker of axonal damage in the brain.4-6,8 The sensitivity of OCT for detecting abnor- malities in eyes with a clinical ON episode was 60% in a study of 65 patients with demyelinating diseases (including 40 patients with MS and 20 with neuromyelitis optica) and 68% in a study of 40 patients with MS.4,9 In our study of 73 patients with NMOSD, the overall sensitivity of OCT for de- tecting abnormalities after a clinical ON episode was 68%, which is consistent with the above-mentioned sensitivities in MS. However, the sensitivity of OCT was 50% in eyes with first-ever ON and 95% in eyes with multiple ON. Our normal OCT findings in about half of the eyes with first-ever ON sug- gest that optic nerve damage caused by a single ON episode is not sufficient to result in an abnormally thin RNFL. Abnor- mal OCT results were observed in most eyes with multiple ON episodes, which might be attributable to the RNFL being thinned to below the normal range owing to the accumula- tion of axonal damage induced by repeated ON. Therefore, the sensitivity of OCT appears to be affected by the number of ON episodes rather than by the disease type (i.e., MS ver- sus NMOSD).
A VEP evaluation is currently the standard method used to confirm the presence of clinical and subclinical ON.15 The sensitivity of VEPs after an ON episode is reported to be range from 60% to 87% regardless of the type of demyelinating dis- ease.4,12,15 In the present study, the VEPs were abnormal in 73% of eyes of patients with NMOSD and a history of ON (67% in eyes with first-ever ON and 83% in eyes with multi- ple ON episodes). Although the sensitivity of the VEP eval- uations increased with the number of ON episodes in this study, our VEP sensitivities remained similar to those report- ed previously. Therefore, the sensitivity of VEPs did not appear to be significantly affected by the number of ON episodes or disease type.
OCT and VEPs were similarly sensitive at detecting ON in NMOSD in this study. However, the comparative sensitivities
of these techniques varied with the number of ON episodes;
specifically, VEPs were more sensitive for detecting subclini- cal or first-ever ON, while OCT was more sensitive in eyes with a history of multiple ON episodes. Thus, the sensitivity of VEPs or OCT may depend on the nature of the ON under examination (e.g., number of ON episodes). This could pro- vide an explanation of the previous inconsistent results and should be considered when planning or interpreting future studies that analyze the sensitivities of these two technologies.
While an RNFL thickness reduction of ~7 µm was found in the eyes of patients with MS and without a history of ON,16 normal RNFL thicknesses have been repeatedly found in eyes of patients with NMOSD and without a history of ON.8,17-20 The present study found subclinical involvement in five eyes with- out a history of ON (11%), and the sensitivity was higher for VEPs (9%) than for OCT (2%) in these cases. These detec- tion rates were lower than a previous report of subclinical ON being identified in 44% of the eyes of patients with MS and without a history of ON (40% by VEPs and 19% by OCT),9 indicating that subclinical ON in NMOSD is uncommon and that VEPs are better than OCT for detecting subclinical ON.
Previous studies have found that using VEPs and OCT to- gether increases the detection sensitivity for ON in patients with MS, since VEPs and OCT provide detailed information regarding the status of myelin and axons after ON, respective- ly.9 Indeed, we found that using both OCT and VEPs resulted in a significantly higher sensitivity for the detection of ON in NMOSD relative to using either test alone.
Consistent with previous reports,17,18,21 we identified a strong correlation between RNFL thickness and EDSS score in pa- tients with NMOSD. The correlations between OCT or VEP pa- rameters and clinical disability measurements support the po- tential utility of these techniques in monitoring NMOSD.
Our study was subject to some limitations. First, the small number of unaffected eyes might have prevented the detec- tion of between-group differences. Second, we used the tradi- tional time-domain OCT device, since our study began before the new spectral-domain OCT device was available world- wide. Spectral-domain OCT may provide a higher resolution, although the coefficients of variation for repeated measures of 2.5% to 3.5% with time-domain OCT are sufficient to en- able our results to be interpreted meaningfully.
In conclusion, we found that the comparative sensitivities of OCT and VEPs vary depending on the severity of ON. Re- searchers should therefore consider differences in the number of ON episodes when they design and interprete their studies.
VEPs were superior in detecting subclinical or first-ever ON, while OCT was more sensitive in patients with repeated ON ep- isodes. This study has provided insight into the optimal meth- od for evaluating optic nerve involvement in NMOSD and has
Kim NH et al.
JCN
confirmed that OCT and VEPs may be used as markers of the disease burden in NMOSD.
Conflicts of Interest
The authors have no financial conflicts of interest.
Acknowledgements
This study was supported by a Korean Research Foundation Grant fund- ed by the Korean Government (KRF 2009-0067502) to Kim NH.
REFERENCES
1. Pfueller CF, Paul F. Imaging the visual pathway in neuromyelitis op- tica. Mult Scler Int 2011;2011:869814.
2. Wingerchuk DM, Banwell B, Bennett JL, Cabre P, Carroll W, Chitnis T, et al.; International Panel for NMO Diagnosis. International consensus diagnostic criteria for neuromyelitis optica spectrum disorders. Neu- rology 2015;85:177-189.
3. Filippi M, Rocca MA, Ciccarelli O, De Stefano N, Evangelou N, Kap- pos L, et al.; MAGNIMS Study Group. MRI criteria for the diagnosis of multiple sclerosis: MAGNIMS consensus guidelines. Lancet Neu- rol 2016;15:292-303.
4. Naismith RT, Tutlam NT, Xu J, Shepherd JB, Klawiter EC, Song SK, et al. Optical coherence tomography is less sensitive than visual evoked potentials in optic neuritis. Neurology 2009;73:46-52.
5. Naismith RT, Tutlam NT, Xu J, Klawiter EC, Shepherd J, Trinkaus K, et al. Optical coherence tomography differs in neuromyelitis optica compared with multiple sclerosis. Neurology 2009;72:1077-1082.
6. Costello F. Evaluating the use of optical coherence tomography in optic neuritis. Mult Scler Int 2011;2011:148394.
7. Cettomai D, Pulicken M, Gordon-Lipkin E, Salter A, Frohman TC, Conger A, et al. Reproducibility of optical coherence tomography in multiple sclerosis. Arch Neurol 2008;65:1218-1222.
8. Bennett JL, de Seze J, Lana-Peixoto M, Palace J, Waldman A, Schip- pling S, et al.; GJCF-ICC&BR. Neuromyelitis optica and multiple scle- rosis: seeing differences through optical coherence tomography. Mult Scler 2015;21:678-688.
9. Di Maggio G, Santangelo R, Guerrieri S, Bianco M, Ferrari L, Meda- glini S, et al. Optical coherence tomography and visual evoked poten- tials: which is more sensitive in multiple sclerosis? Mult Scler 2014;20:
1342-1347.
10. Weinstock-Guttman B, Baier M, Stockton R, Weinstock A, Justinger T, Munschauer F, et al. Pattern reversal visual evoked potentials as a measure of visual pathway pathology in multiple sclerosis. Mult Scler 2003;9:529-534.
11. MacFadyen DJ, Drance SM, Douglas GR, Airaksinen PJ, Mawson DK, Paty DW. The retinal nerve fiber layer, neuroretinal rim area, and visual evoked potentials in MS. Neurology 1988;38:1353-1358.
12. Neto SP, Alvarenga RM, Vasconcelos CC, Alvarenga MP, Pinto LC, Pinto VL. Evaluation of pattern-reversal visual evoked potential in patients with neuromyelitis optica. Mult Scler 2013;19:173-178.
13. Ringelstein M, Kleiter I, Ayzenberg I, Borisow N, Paul F, Ruprecht K, et al. Visual evoked potentials in neuromyelitis optica and its spec- trum disorders. Mult Scler 2014;20:617-620.
14. Costello F, Hodge W, Pan YI, Eggenberger E, Coupland S, Kardon RH.
Tracking retinal nerve fiber layer loss after optic neuritis: a prospective study using optical coherence tomography. Mult Scler 2008;14:893- 15. Frederiksen JL, Petrera J. Serial visual evoked potentials in 90 un-905.
treated patients with acute optic neuritis. Surv Ophthalmol 1999;44 Suppl 1:S54-S62.
16. Petzold A, de Boer JF, Schippling S, Vermersch P, Kardon R, Green A, et al. Optical coherence tomography in multiple sclerosis: a sys- tematic review and meta-analysis. Lancet Neurol 2010;9:921-932.
17. Ratchford JN, Quigg ME, Conger A, Frohman T, Frohman E, Balcer LJ, et al. Optical coherence tomography helps differentiate neuromye- litis optica and MS optic neuropathies. Neurology 2009;73:302-308.
18. de Seze J, Blanc F, Jeanjean L, Zéphir H, Labauge P, Bouyon M, et al.
Optical coherence tomography in neuromyelitis optica. Arch Neurol 2008;65:920-923.
19. Lange AP, Sadjadi R, Zhu F, Alkabie S, Costello F, Traboulsee AL.
Spectral-domain optical coherence tomography of retinal nerve fiber layer thickness in NMO patients. J Neuroophthalmol 2013;33:213-219.
20. Schneider E, Zimmermann H, Oberwahrenbrock T, Kaufhold F, Ka- das EM, Petzold A, et al. Optical coherence tomography reveals dis- tinct patterns of retinal damage in neuromyelitis optica and multiple sclerosis. PLoS One 2013;8:e66151.
21. Merle H, Olindo S, Donnio A, Richer R, Smadja D, Cabre P. Retinal peripapillary nerve fiber layer thickness in neuromyelitis optica. In- vest Ophthalmol Vis Sci 2008;49:4412-4417.