서 론
비만인구에서 체중감소가 심혈관 질환에 관계되는 위험요인들 interleukin (IL)-6,1) 혈압,2) 혈당수치3) 등을 개선하여 사망률이 감소한 다는 연구가 있다. 그러나 노인층에서 체중감소가 사망률을 증가시 킨다는 보고가 있다.4-6) 또한 의도적인 체중감소의 경우에는 사망률 을 증가시키지 않는다는 연구 결과가7) 있는 반면에 의도적인 체중감 소라 하더라도 사망률을 증가시킨다는 연구 결과도 있다.8) 이러한 상반되는 결과들 때문에 노인층에 대해서 의도적인 체중감소를 권 유하는 것에 어려움이 있을 수 있고 심지어 비만인 경우에도 체중감
소에 주저하게 되는 원인이 되고 있다.
노인층의 경우 보다 젊은 연령층에 비해 사회 경제적 그리고 건강 상 취약할 수 있으므로 노인층에 대하여 체중감소와 사망률 관계에 대해 아는 것은 중요하다. 더욱이 점차 노인층이 증가하고 체질량지 수(body mass index, BMI)를 일정 수치 이하로 유지하도록 권장하는 상황에서 최근에 나온 의도적인 체중감소에 대한 결과들을 포함하 여 노인층의 체중감소와 사망률 사이의 관계는 살펴보는 것은 의미 가 있다.9)
이 연구의 목적은 노인층의 체중감소와 사망률 관계를 메타분석 을 통하여 확인하여 노인층에게 올바른 체중관리에 대한 근거 중심
Original Article
노인층에서의 체중감소와 사망률: 메타분석
이정웅, 유준현*, 신진영, 금정현
성균관대학교 의과대학 삼성서울병원 가정의학교실
Weight Loss and All-Cause Mortality in the Elderly: A Meta-Analysis
Jung-Woong Lee, Jun-Hyun Yoo*, Jin-Young Shin, Jung-Hyun Keum
Department of Family Medicine, Samsung Medical Center, Sungkyunkwan University School of Medicine, Seoul, Korea
Background: Observational studies have suggested that weight loss is associated with an increased mortality risk in the elderly. However, intentional weight loss has not been associated with mortality in recent studies. The purpose of this meta-analysis was to examine the evidence for recommending weight loss in the elderly.
Methods: Electronic and manual searches for articles published up to June 2015 identified 14 eligible studies that monitored subsequent mortality risk following weight loss. Data were extracted and further analyzed by meta-analysis. Moderator variables such as reason for weight loss (intentional or unintentional) and sex (men or women) were used to classify subgroups for separate analysis.
Results: Overall , weight loss was associated with an increased mortality risk (relative risk [RR] 1.57, 95% confidence interval [CI] 1.36–1.78; P<0.001).
Intentional weight loss was associated with decreased all-cause mortality (RR 0.61, 95% CI 0.43–0.85; P<0.001), whereas unintentional weight loss was associated with an 82% increased risk (RR 1.82, 95% CI 1.58–2.08; P<0.001). Weight loss in men had no effect on all-cause mortality (RR 1.32, 95% CI 0.97–1.77; P>0.05), but weight loss in women was associated with an increased mortality risk (RR 1.68, 95% CI 1.20–2.35; P<0.001).
Conclusion: Unintentional weight loss was associated with higher mortality, and intentional weight loss was associated with significantly lower all- cause mortality.
Keywords: Weight Loss; Mortality; Aged
https://doi.org/10.21215/kjfp.2017.7.1.10 eISSN 2233-9116
Korean J Fam Pract. 2017;7(1):10-19
KJFP
Korean Journal of Family PracticeReceived March 10, 2016 Revised June 9, 2016 Accepted July 1, 2016 Corresponding author Jun-Hyun Yoo
Tel: +82-2-3410-2440, Fax: +82-2-3410-0388 E-mail: [email protected]
Copyright © 2017 The Korean Academy of Family Medicine
This is an open-access article distributed under the terms of the Creative Commons At- tribution Non-Commercial License (http://creativecommons.org/licenses/by-nc/4.0) which permits unrestricted noncommercial use, distribution, and reproduction in any medium, provided the original work is properly cited.
이정웅 외. 노인층에서의 체중감소와 사망률 Korean Journal of Family Practice
KJFP
Original Article
Korean Journal of Family Practice 의 의학적 조언을 하기 위함이다. 지금까지 수행된 선행연구들을 대
상으로 근거중심의 과학적인 접근을 하기 위해서 선행연구에 대한 메타분석이 필요하다.
방 법
1. 자료의 검색
논문 검색은 Pubmed/Medline, Ovid, Cochrane library를 통해 이루 어졌고 검색어는 ‘weight loss, mortality, aged, elderly, relative risk, BMI’
등으로 검색하였다. 논문검색은 2015년 6월 발표논문까지 진행되었 고 참고문헌 목록이나 링크되어있는 자료에 대한 직접 검색도 같이 진행하였다. 논문검색은 두 명의 독립된 연구자에 의해 진행되었다.
2. 자료의 선택
노인의 정의는 연령으로 하였으나, 60세 이상을 대상으로 하는 경 우에는 노인으로 간주하여 별도의 연령에 따른 제한을 두지는 않았 다. 체중감소와 사망률 관계에 대해 체중이 유지되는 그룹과 체중이 감소하는 그룹 사이에 relative risk (RR)값과 95% confidence interval (CI)을 제시하는 논문을 선택하였고 체중을 감소시키는 약과 수술 을 통한 체중감소 관련 논문은 제외하였다. 사망률의 경우 명시하지
않더라도 사망이 확인된 경우를 포함하였다. Figure 1에 제시된 것처 럼 총 5,211편의 논문을 검색하였고 직접검색을 통하여 47편의 논문 을 추가하였다. 노인층이 포함된 체중감소와 사망률에 대한 논문 53 편에 대하여 전문에 대해 평가를 하였고 최종적으로 선택기준에 부 합하는 14개의 논문이 포함되었다.10-17) 각 논문에서 여성과 남성, 의 도적인 체중감소와 비의도적인 체중감소 등 세부 그룹으로 나뉘어 진 자료들은 세부그룹별 결과들도 추출하였다. 영어로 작성된 논문 을 대상으로 하였다.
3. 자료의 분석
분석대상 자료에 대한 메타분석은 1차적으로 동질성 검정, 출판 편의 분석을 실시하여 자료의 동질적인지 이질적인지를 살펴본 후, 체중감소와 사망률 관계를 누적된 효과크기에 대한 자료를 통해 분 석하여 연구성과를 종합하였고, 나아가 의도적 체중감소와 비의도 적 체중감소에 따른 각각의 효과 크기 분석과 남자와 여자의 성별에 따른 각각의 효과 크기 분석을 실시하여 상호 비교하였다. 동질성 검 정에서 개별연구물을 분석단위로 하여 전체평균 효과크기를 분석 한 결과 Higgins 등18)의 기준인 I2값이 75% 이상이면 매우 이질적이라 고 판단할 수 있는데, 본 연구는 I2값과 Q-value를 이용하여 동질성 검정을 하였다.
Full-text articles excluded, with reasons
(n=39)
Included adults <60:12 Review: 4
Low body weight & mortality: 18 Miscellaneous: 5
Records excluded on basis of title or abstract
(n=4,958) Additional records identified
through other sources (n=47) Records identified through
database searching (n=5,211)
Records after duplicates removed (n=247)
Records screened (n=5,011)
Full-text articles assessed for eligibility
(n=53)
Studies included in qualitative synthesis
(n=14)
Studies included in quantitative synthesis
(meta-analysis)
(n=14) Figure 1. Flow diagram of included and
excluded studies.
Jung-Woong Lee, et al. Weight Loss and All-Cause Mortality in the Elderly
Korean Journal of Family Practice
KJFP
4. 방법론적 질적 분석
방법론적 질적 분석을 위하여 Newcastle-Ottawa 척도(Newcastle- Ottawa quality assessment scale)를 사용하였다. 전반적인 평가는 선택, 비교, 노출/결과의 각 항목에 대해 0–9점 사이의 점수를 매겨 시행했 으며 최종 분석에는 6–8점 사이의 논문들을 포함시키기로 했다. 최 종 분석에 선택된 논문들의 평균점수는 6.91점이었다.19)
출판편의 여부를 확인하기 위해 funnel plot을 사용하였다. 표본수 나 표준오차의 크기와 상관없이 효과크기의 평균값을 중심으로 좌 우 대칭(symmetry)인 깔대기 모양을 이룬 경우 출판편의가 없다고 하였다. 반면 해당 분포의 모양이 비대칭성(asymmetry)을 보인 경우 출판편의가 있다고 하였다.
메타분석은 Cochrane Collaboration Review Manager (RevMan ver- sion 5.3; The Cochrane Collaboration, Oxford, UK)으로 수행되었고, 각 통계량의 CI는 95%를 기준으로 제시하고, 통계적 유의수준은 5%
로 정하였다.
결 과
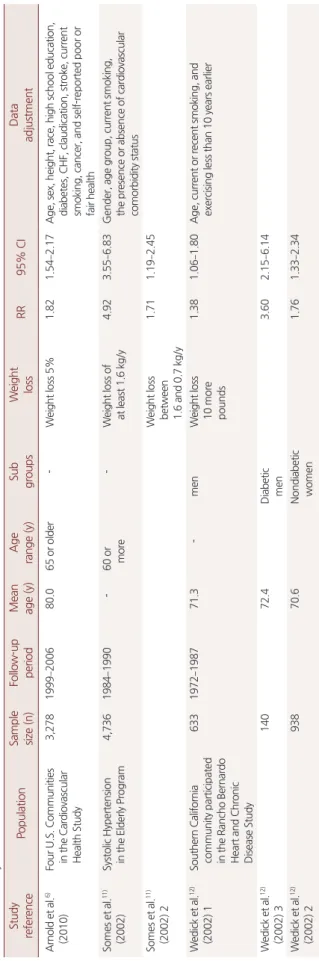
최종 분석된 연구는 14편으로, 60세 이상 노인층을 대상으로 2년 부터 최장 15년까지 연구되었다. Table 1에서 연구 참여자들의 기본 적인 특성을 살펴볼 때, 연구대상자 수는 88명에서 4,736명으로 모든 연구는 사망률과 체중감소에 대한 RR값과 95% CI를 구하도록 설계 되었다. 본 연구는 I2값이 87.96%로 측정되어 이질성 정도가 높은 편 에 속하였다.18) 또한, Q-value는 257.49로 통계적으로 유의하므로 (P<0.001) 개별연구간 효과크기의 동질성이 없는 것으로 판단하고, 랜덤효과 모형(random effect model)에 의해 분석하였다.
1. 체중감소와 사망률
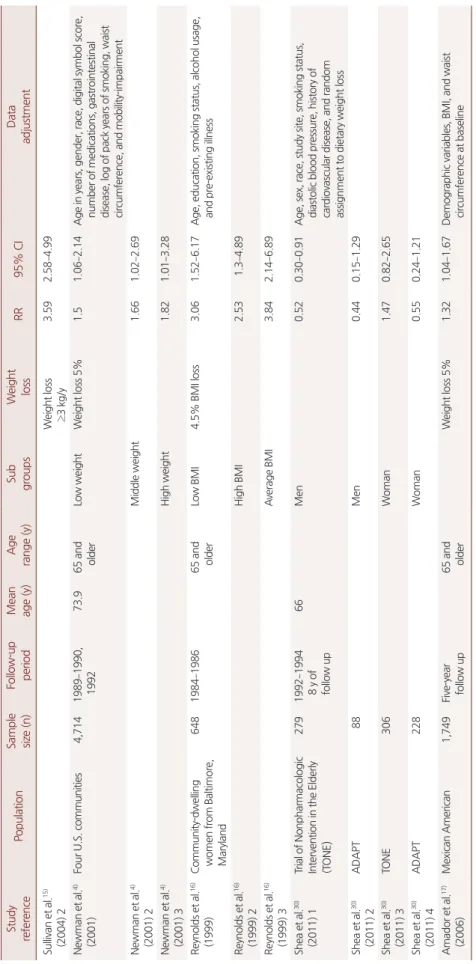
본 연구에서 선정한 14편의 논문에서 랜덤효과 모형으로 선행연 구결과들을 종합한 결과 체중감소는 사망률을 높인다(RR 1.57, 95%
CI 1.36–1.78; P<0.001) (Figure 2).
2. 의도적인 체중감소와 비의도적인 체중감소
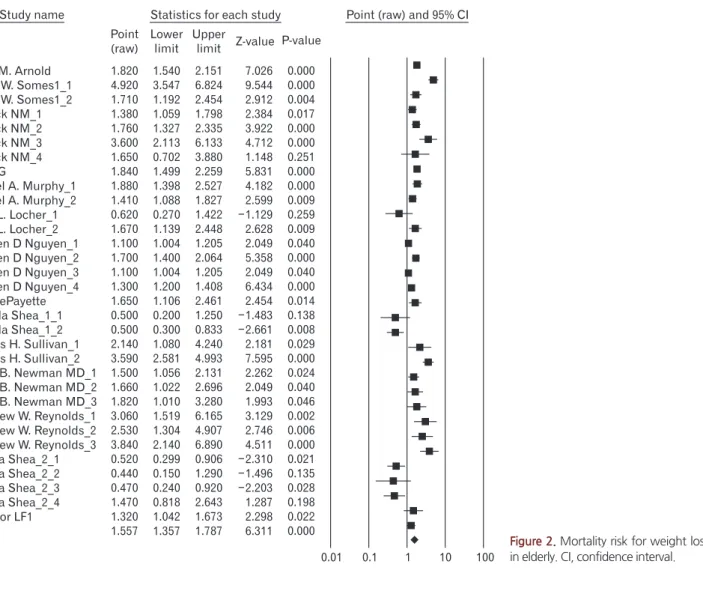
Figure 3은 랜덤효과 모형으로 측정한 결과 노인에서 비의도적인 체중감소의 경우 사망률을 높인다는 것을 보여주고 있다(RR 1.82, 95% CI 1.58–2.08; P<0.001). 반면에 본 연구에서 선정한 3편의 논문에 서 도출된 7개의 효과크기로부터 랜덤효과 모형으로 측정한 결과 의도적인 체중감소의 경우 Figure 4와 같이 체중감소는 사망률을 감 소시킨다(RR 0.61, 95% CI 0.43–0.85; P<0.001).
Table 1. Summary of included studies Study referencePopulationSample size (n)Follow-up periodMean age (y)Age range (y)Sub groupsWeight lossRR95% CIData adjustment Arnold et al.6) (2010)Four U.S. Communities in the Cardiovascular Health Study
3,2781999–200680.065 or older-Weight loss 5%1.821.54–2.17Age, sex, height, race, high school education, diabetes, CHF, claudication, stroke, current smoking, cancer, and self-reported poor or fair health Somes et al.11) (2002)Systolic Hypertension in the Elderly Program4,7361984–1990-60 or more-Weight loss of at least 1.6 kg/y4.923.55–6.83Gender, age group, current smoking, the presence or absence of cardiovascular comorbidity status Somes et al.11) (2002) 2Weight loss between 1.6 and 0.7 kg/y
1.711.19–2.45 Wedick et al.12) (2002) 1Southern California community participated in the Rancho Bernardo Heart and Chronic Disease Study
6331972–198771.3- menWeight loss 10 more pounds
1.381.06–1.80Age, current or recent smoking, and exercising less than 10 years earlier Wedick et al.12) (2002) 314072.4Diabetic men3.602.15–6.14 Wedick et al.12) (2002) 293870.6Nondiabetic women1.761.33–2.34
이정웅 외. 노인층에서의 체중감소와 사망률 Korean Journal of Family Practice
KJFP
Table 1. Continued Study referencePopulationSample size (n)Follow-up periodMean age (y)Age range (y)Sub groupsWeight lossRR95% CIData adjustment Wedick et al.12) (2002) 49073.3Diabetic women1.650.70–3.87 Lee et al.10) (2001)TheOsteoporotic Fractures in Men Study (MrOS)4,3312000–200974.265 to 93 at baselineMenWeight loss 5%1.841.5–2.26Age, race, site, smoking status, alcohol use, education, physical activity, baseline health, baseline BMI, CHF, chronic obstructive pulmonary disease, and diabetes mellitus Murphy et al.5) (2014) 1The Health, Aging, and Body Composition Study1,0441997–201178.5 70 to 79WomenWeight loss 5%1.471.07–2.01Age, race, education, study site, BMI, smoking status, physical activity, depressive symptoms, cancer, diabetes mellitus, hip fracture, hypertension, myocardial infarction, and stroke incidence of hospitalization, and days of hospitalization Murphy et al.5) (2014) 293178.8Men1.411.09–1.83 Locher et al.26) (2007) 1University of Alabama at Birmingham (UAB) Study of Aging 983December 1999 and February 2001
75.365 years old or olderIntentionalWeight loss >10 pounds0.620.27–1.42Age, gender, race, smoking status, and comorbidities Locher et al.26) (2007) 2Unintentional1.671.14–2.45 Nguyen et al.13) (2007)Dubbo Osteoporosis Epidemiology Study1,059Between 1989 and 2004-60 years of age (as of 1989)
MenWeight loss -10 kg1.11–1.2Age, concomitant diseases including any osteoporotic fracture, cardiovascular disease, all-causecancer, diabetes mellitus, and smoking Nguyen et al.13) (2007) 2MenWeight loss 2%/y1.71.4–2 Nguyen et al.13) (2007) 3WomenWeight loss -10 kg1.11–1.2 Nguyen et al.13) (2007) 4WomenWeight loss 2%/y1.31.2–1.5 Payette et al.14) (1999)Six local community service centers (CLSC) in the area ofSherbrooke (Quebec, Canada)
288From 1991 to 199378.2 60–94-Weight loss (mean 6.7 kg)1.651.11–2.47Age, gender, smoking, and health and functional status Shea et al.7) (2010) 1Arthritis, Diet, and Activity Promotion Trial (ADAPT)318From December 1999 through December 2006
69.6Mean 69±6-Mean weight loss -4.8 kg0.50.2–1.4Age, sex, and exercise treatment Shea et al.7) (2010) 2Dietary weight loss0.50.3–1 Sullivan et al.15) (2004) 1The general medical or surgical wards of a university-affiliated Department of Veterans Affairs Hospital
660January 1994 to February 1997 74.665 or older-Weight loss 1 to 3 kg/y2.141.52–3Age, race, marital status, Chronic Disease Score, Mini-Mental Examination Score, Katz Index of activities of daily living scale, Acute Physiology and Chronic Health Evaluation II score, body mass index, and Charlson Weighted Index of Comorbidity
Jung-Woong Lee, et al. Weight Loss and All-Cause Mortality in the Elderly
Korean Journal of Family Practice
KJFP
Table 1. Continued Study referencePopulationSample size (n)Follow-up period Mean age (y)Age range (y)Sub groupsWeight lossRR95% CIData adjustment Sullivan et al.15) (2004) 2Weight loss ≥3 kg/y3.592.58–4.99 Newman et al.4) (2001)Four U.S. communities4,7141989–1990, 199273.965 and olderLow weightWeight loss 5%1.51.06–2.14Age in years, gender, race, digital symbol score, number of medications, gastrointestinal disease, log of pack years of smoking, waist circumference, and mobility-impairment Newman et al.4) (2001) 2Middle weight1.661.02–2.69 Newman et al.4) (2001) 3High weight1.821.01–3.28 Reynolds et al.16) (1999)Community-dwelling women from Baltimore, Maryland
6481984–198665 and olderLow BMI4.5% BMI loss3.061.52–6.17Age, education, smoking status, alcohol usage, and pre-existing illness Reynolds et al.16) (1999) 2High BMI2.531.3–4.89 Reynolds et al.16) (1999) 3Average BMI3.842.14–6.89 Shea et al.30) (2011) 1Trial of Nonpharmacologic Intervention in the Elderly (TONE) 2791992–1994 8 y of follow up
66Men0.520.30–0.91Age, sex, race, study site, smoking status, diastolic blood pressure, history of cardiovascular disease, and random assignment to dietary weight loss Shea et al.30) (2011) 2ADAPT88Men0.440.15–1.29 Shea et al.30) (2011) 3TONE306Woman1.470.82–2.65 Shea et al.30) (2011) 4ADAPT228Woman0.550.24–1.21 Amador et al.17) (2006)Mexican American1,749Five-year follow up65 and olderWeight loss 5%1.321.04–1.67Demographic variables, BMI, and waist circumference at baseline RR, relative risk; CI, confidence interval; CHF, congestive heart failure; BMI, body mass index.
이정웅 외. 노인층에서의 체중감소와 사망률 Korean Journal of Family Practice
KJFP
3. 성별에 따른 체중감소와 사망률
본 연구에서 선정한 5편의 논문에서 도출된 7개의 효과크기로부 터 랜덤효과 모형으로 측정한 결과 Figure 5와 같이 남성 노인의 경 우 체중감소와 사망률 사이에 연관성이 없었다(RR 1.32, 95% CI 0.97–1.77; P>0.05). 이와 반면에 여성 노인의 경우 체중감소가 사망률 을 증가시키는 것으로 나타났다(RR 1.68, 95% CI 1.20–2.35; P<0.001) (Figure 6).
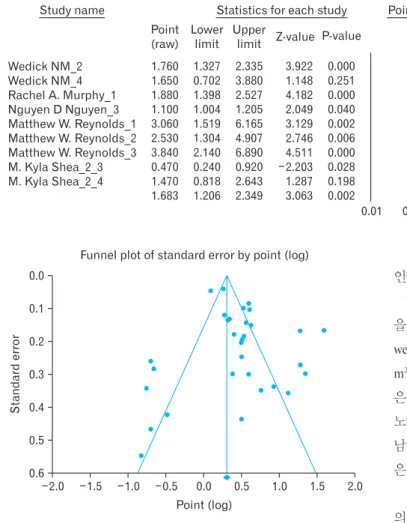
4. 출판편의
본 연구결과는 Figure 7에서 보이듯이 좌우 어느 한 쪽으로 몰려있 기보다 주축을 중심으로 결과치가 다소 우편향 분포하여 비대칭형 으로 출판 편의가 있는 것으로 해석할 수 있다.
고 찰
노년층의 체중감소와 사망률 관계에 대한 총 14편의 논문에 대해 체중감소는 사망률을 증가시키는 것으로 확인되었으며, 의도하지 않았으나 체중이 감소한 경우에서는 이러한 경향을 유지하였으나, 의도적으로 체중을 감소한 경우에서는 오히려 사망률이 감소하였 다. 또한 남성노인에서는 체중감소와 사망률의 관계를 찾을 수 없었 으나, 여성노인에서의 체중감소는 사망률을 증가시키는 것을 확인 하였다.
본 연구는 다른 연령층을 대상으로 한 이전 연구와 일관된 결과 를 도출하였다. 이전 연구와 동일하게 노인층에서도 체중감소가 의 도적인지 아닌지 모르는 경우 혹은 비의도적인 체중감소의 경우 사 망률의 뚜렷한 증가가 있었다.20)
노인층의 비의도적인 체중감소의 병리생리학은 잘 알려져 있지 않으나 노인층에서는 지방을 제외한 체중이 변하고21) 식욕부진에
Alice M. Arnold Grant W. Somes1_1 Grant W. Somes1_2 Wedick NM_1 Wedick NM_2 Wedick NM_3 Wedick NM_4 Lee CG
Rachel A. Murphy_1 Rachel A. Murphy_2 Julie L. Locher_1 Julie L. Locher_2 Nguyen D Nguyen_1 Nguyen D Nguyen_2 Nguyen D Nguyen_3 Nguyen D Nguyen_4 HelenePayette M. Kyla Shea_1_1 M. Kyla Shea_1_2 Dennis H. Sullivan_1 Dennis H. Sullivan_2 Anne B. Newman MD_1 Anne B. Newman MD_2 Anne B. Newman MD_3 Matthew W. Reynolds_1 Matthew W. Reynolds_2 Matthew W. Reynolds_3 M Kyla Shea_2_1 M Kyla Shea_2_2 M Kyla Shea_2_3 M Kyla Shea_2_4 Amador LF1
Study name
1.820 4.920 1.710 1.380 1.760 3.600 1.650 1.840 1.880 1.410 0.620 1.670 1.100 1.700 1.100 1.300 1.650 0.500 0.500 2.140 3.590 1.500 1.660 1.820 3.060 2.530 3.840 0.520 0.440 0.470 1.470 1.320 1.557
1.540 3.547 1.192 1.059 1.327 2.113 0.702 1.499 1.398 1.088 0.270 1.139 1.004 1.400 1.004 1.200 1.106 0.200 0.300 1.080 2.581 1.056 1.022 1.010 1.519 1.304 2.140 0.299 0.150 0.240 0.818 1.042 1.357
2.151 6.824 2.454 1.798 2.335 6.133 3.880 2.259 2.527 1.827 1.422 2.448 1.205 2.064 1.205 1.408 2.461 1.250 0.833 4.240 4.993 2.131 2.696 3.280 6.165 4.907 6.890 0.906 1.290 0.920 2.643 1.673 1.787
0.000 0.000 0.004 0.017 0.000 0.000 0.251 0.000 0.000 0.009 0.259 0.009 0.040 0.000 0.040 0.000 0.014 0.138 0.008 0.029 0.000 0.024 0.040 0.046 0.002 0.006 0.000 0.021 0.135 0.028 0.198 0.022 0.000 Point
(raw) Lower
limit Upper
limit Z-value P-value 7.026 9.544 2.912 2.384 3.922 4.712 1.148 5.831 4.182 2.599 1.129 2.628 2.049 5.358 2.049 6.434 2.454 1.483 2.661 2.181 7.595 2.262 2.049 1.993 3.129 2.746 4.511 2.310 1.496 2.203 1.287 2.298 6.311
Statistics for each study Point (raw) and 95% CI
100 10 1 0.1 0.01
Figure 2. Mortality risk for weight loss in elderly. CI, confidence interval.
Jung-Woong Lee, et al. Weight Loss and All-Cause Mortality in the Elderly
Korean Journal of Family Practice
KJFP
Alice M. Arnold Grant W. Somes1_1 Grant W. Somes1_2 Wedick NM_1 Wedick NM_2 Wedick NM_3 Wedick NM_4 Lee CG
Rachel A. Murphy_1 Rachel A. Murphy_2 Julie L. Locher_1 Nguyen D Nguyen_1 Nguyen D Nguyen_2 Nguyen D Nguyen_3 Nguyen D Nguyen_4 Helene Payette Dennis H. Sullivan_1 Dennis H. Sullivan_2 Anne B. Newman MD_1 Anne B. Newman MD_2 Anne B. Newman MD_3 Matthew W. Reynolds_1 Matthew W. Reynolds_2 Matthew W. Reynolds_3 Amador LF1
Study name
1.820 4.920 1.710 1.380 1.760 3.600 1.650 1.840 1.880 1.410 1.670 1.100 1.700 1.100 1.300 1.650 2.140 3.590 1.500 1.660 1.820 3.060 2.530 3.840 1.320 1.817
1.540 3.547 1.192 1.059 1.327 2.113 0.702 1.499 1.398 1.088 1.139 1.004 1.400 1.004 1.200 1.106 1.080 2.581 1.056 1.022 1.010 1.519 1.304 2.140 1.042 1.581
2.151 6.824 2.454 1.798 2.335 6.133 3.880 2.259 2.527 1.827 2.448 1.205 2.064 1.205 1.408 2.461 4.240 4.993 2.131 2.696 3.280 6.165 4.907 6.890 1.673 2.088
0.000 0.000 0.004 0.017 0.000 0.000 0.251 0.000 0.000 0.009 0.009 0.040 0.000 0.040 0.000 0.014 0.029 0.000 0.024 0.040 0.046 0.002 0.006 0.000 0.022 0.000 Point
(raw) Lower
limit Upper
limit Z-valueP-value 7.026
9.544 2.912 2.384 3.922 4.712 1.148 5.831 4.182 2.599 2.628 2.049 5.358 2.049 6.434 2.454 2.181 7.595 2.262 2.049 1.993 3.129 2.746 4.511 2.298 8.407 Statistics for each study
100 10 1 0.1 0.01
Point (raw) and 95% CI
Figure 3. Mortalityrisk for unintentional weight loss in elderly. CI, confidence in- terval.
Figure 4. Mortality risk for intentional weight loss in elderly. CI, confidence in- terval.
Julie L. Locher_1 M. Kyla Shea_1_1 M. Kyla Shea_1_2 M. Kyla Shea_2_1 M. Kyla Shea_2_2 M. Kyla Shea_2_3 M. Kyla Shea_2_4
Study name
0.620 0.500 0.500 0.520 0.440 0.470 1.470 0.610
0.270 0.200 0.300 0.299 0.150 0.240 0.818 0.431
1.422 1.250 0.833 0.906 1.290 0.920 2.643 0.865
0.259 0.138 0.008 0.021 0.135 0.028 0.198 0.005 Point
(raw)
Lower limit
Upper
limit Z-value P-value 1.129
1.483 2.661 2.310 1.496 2.203 1.287 2.777
Statistics for each study Point (raw) and 95% CI
100 10 1 0.1 0.01
Wedick NM_1 Wedick NM_3 Lee CG
Rachel A. Murphy_2 Nguyen D Nguyen_1 M. Kyla Shea_2_1 M. Kyla Shea_2_2 Study name
1.380 3.600 1.840 1.410 1.100 0.520 0.440 1.312
1.059 2.113 1.499 1.088 1.004 0.299 0.150 0.970
1.798 6.133 2.259 1.827 1.205 0.906 1.290 1.774
0.017 0.000 0.000 0.009 0.040 0.021 0.135 0.078 Point
(raw) Lower
limit Upper
limit Z-value P-value 2.384
4.712 5.831 2.599 2.049 2.310 1.496 1.763
Statistics for each study Point (raw) and 95% CI
100 10 1 0.1 0.01
Figure 5. Mortality risk for weight loss in elderly among men. CI, confidence interval.
이정웅 외. 노인층에서의 체중감소와 사망률 Korean Journal of Family Practice
KJFP
따른 에너지 불균형이 있는 경우가 많다.22) 노인층의 의도하지 않은 체중감소는 일상활동 감소를 가져오고23) 병원에 체류하는 시간을 늘리며24) 저체중 자체가 노인층에서는 사망률을 증가시키는 요인이 된다.25)
의도적인 체중감소는 노인층이라 할지라도 사망률을 증가시키지 않았다. Locher 등26) 연구에서 보듯이 평균연령 73세의 노인층을 3년 간 추적관찰한 결과 의도되지 않은 체중감소는 사망률을 높였으나 의도적인 체중감소는 사망률을 높이지 않았고, 최근의 무작위대조 군연구(randomized controlled trail, RCT)인 Shea 등7)의 연구에서도 비만인 노년층을 대상으로 하여 평균 8년간의 기간 동안 체중감소 는 사망률을 증가시키지 않았다.
의도적 체중감소의 경우 사망률은 높이지 않는 이유로는 체중감 소가 식이습관을 개선하고 활동량과 증가시켜 전체적인 건강상태 를 개선한 결과일 가능성을 생각할 수 있다.27) 특히 노인이라도 비만 인 경우의 체중감소는 노인층에서 사망률을 증가시키는 위험요인 들인 IL-6, 혈압, 혈당치를 낮추는 효과가 있어, 위험인자인 이러한 요
인이 개선됨으로서 감소시킨다고 할 수 있다.
World Health Organization에서 BMI를 기준으로 나눈 비만 기준 을 보면 저체중(underweight, BMI of <18.5 kg/m2), 정상체중(normal- weight, BMI of 18.5–25 kg/m2), 과체중 (overweight, BMI of 25–30 kg/
m2), 비만(obesity, BMI of >30 kg/m2)으로 나눌 수 있는데 과체중 그룹 은 정상 체중보다 사망률은 증가하지 않는 연구결과가 있다.28) 또한 노인층을 대상으로 하는 연구에서도 사망률이 가장 낮은 BMI값은 남성은 28.8 kg/m2, 여성은 31.7kg/m2으로 정상체중보다는 과체중 혹 은 비만의 범주에 속하는 결과를 보여주는 연구가 있다.29)
다른 연령층을 포함하는 연구에서는 정상에서 과체중 그룹에서 의 의도적인 체중감소는 사망률을 증가시키는 결과를 보여주는 점 을 고려하면,20) 노인층을 대상으로 하는 연구에서는 BMI 33.5 kg/m2 를 기준으로 나눈 결과에서 차이가 없는 경우 밖에 없어 비만인 그 룹에서 의도적인 체중감소는 사망률을 증가시키지 않으나 과체중 인 경우에는 따로 결론을 내릴 수 없는 상황으로 향후 연구 결과가 더 필요하다.7)
남성 노인층의 체중감소는 사망률이 유의하게 증가하거나 감소하 지 않았고 여성 노인층의 경우 사망률이 증가하는 결과를 보여주고 있다. 이와 같은 차이는 의도적인 체중감소와 사망률에 대한 Shea 등22) 연구의 결과값이 포함되어 나타난 것으로 이 연구에서 남성의 경우 사망률을 의미 있게 감소시켰으나 여성의 경우 의미 있게 사망 률을 감소시키거나 증가시키지 않았다.
남성 노인층의 경우 비의도적인 체중감소에 대한 연구의 경우 사 망률을 증가시키고 의도적인 체중감소는 사망률 감소시키는 결과 를 보여주고 있어 이 연구 결과들을 메타분석하면 사망률이 유의하 게 증가하거나 감소하지 않았다. 실제로 Shea 등30) 연구의 값을 제외 하는 경우 RR 1.60 95% CI 1.18–2.16 (P<0.002)으로 유의하게 사망률 을 높이는 것으로 분석되어 남성의 경우 비의도적인 체중감소와 의 도적인 체중감소 사이의 차이가 있었다.
Figure 6. Mortality risk for weight loss in elderly among women. CI, confi- dence interval.
Wedick NM_2 Wedick NM_4 Rachel A. Murphy_1 Nguyen D Nguyen_3 Matthew W. Reynolds_1 Matthew W. Reynolds_2 Matthew W. Reynolds_3 M. Kyla Shea_2_3 M. Kyla Shea_2_4 Study name
1.760 1.650 1.880 1.100 3.060 2.530 3.840 0.470 1.470 1.683
1.327 0.702 1.398 1.004 1.519 1.304 2.140 0.240 0.818 1.206
2.335 3.880 2.527 1.205 6.165 4.907 6.890 0.920 2.643 2.349
0.000 0.251 0.000 0.040 0.002 0.006 0.000 0.028 0.198 0.002 Point
(raw) Lower
limit Upper
limit Z-value P-value 3.922 1.148 4.182 2.049 3.129 2.746 4.511 2.203 1.287 3.063
Statistics for each study Point (raw) and 95% CI
100 10 1 0.1 0.01
Standarderror
2.0 0.0 0.1 0.2 0.3 0.4 0.5
2.0 Point (log)
0.6
Funnel plot of standard error by point (log)
1.5 1.0 0.5 0.0 0.5 1.0 1.5
Figure 7. Funnel plot.
Jung-Woong Lee, et al. Weight Loss and All-Cause Mortality in the Elderly
Korean Journal of Family Practice
KJFP
이에 비해 여성 노인의 경우 비의도적인 체중감소는 사망률을 증 가시키고 의도적인 체중감소는 유미의한 결과가 나오지 않아 메타 분석한 결과 사망률을 증가시키는 것으로 도출되어 남성에 비해 의 도적인 체중감소에 의한 사망률 감소가 뚜렷하지 않았다.
이와 같은 의도적인 체중감소에 대한 성별에 따른 차이에 대해 같 은 논문에서 여성 노인의 경우 남성에 비해 고혈압 복용하는 기간이 남성에 비해 유의하게 길었고 고혈압 약을 변경하는 경우도 유의하 게 남성의 경우 보다 많았던 차이가 있었으나 다른 비뚤림(bias) 가능 성은 작다고 분석하였다.10) 이전 중년층까지 포함한 연구에서 성별 에 따른 차이가 없었으며20) Shea 등30) 연구가 참가자 수가 많지 않았 고 노인층의 성별에 따른 체중감소와 사망률에 대한 연구가 많지 않 았던 점을 고려하면 향후 실제로 특히 의도적인 체중감소와 사망률 사이에 남녀 차이가 있는지 여부는 좀 더 대규모의 무작위 대조군 연구가 필요할 것으로 보인다.
많은 논문들이 체중감소가 섭취하는 에너지 감소에 의한 경우인 지 신체활동에 의한 체중감소인지에 대해서는 대한 정보를 주고 있 지 않으며 또한 체중감소는 시작점과 일정시간이 지난 시점에서의 체중과의 비교를 통하여 평가되고 있으므로 사이 기간이 길어지면 체중감소가 연속적인지에 대하여 불분명한 점은 제한점이 될 수 있 다. 대부분의 연구에서 체중 측정은 자가 기입식 방법을 사용하는 경우가 많았으나 이 방법은 비용이 절약되는 반면에 정확성에 문제 가 있을 수 있다.
노인층에 대해 의도적인 체중감소에 대한 연구는 아직 부족한 실 정으로 Locher 등26) 연구의 경우 의도성에 대한 조사는 가기 기입식 으로 진행하였고 추적관찰 기간도 3년으로 짧았다는 한계가 있었 고, Shea 등30) 연구는 저자가 지적하였듯이 노인층에서 의도적인 체 중감소는 보다 적극적으로 사망률을 감소시킨다는 것보다는 사망 률을 증가시키는 것은 아니라는 결론을 도출했으므로 향후 더 많은 RCT 연구가 필요할 것으로 보인다.
비만에 대한 전사회적인 관심이 증가하고 평균수명이 늘어가는 현 상황을 생각하면 노인층에 대한 체중감소에 대해 근거 중심의 논 의는 필요할 것으로 보인다. 비만 노인층에 대한 의도적인 체중감소 는 사망률을 감소시키지 않지만, 노인층의 의도하지 않은 체중감소 는 사망률을 증가시키므로 노인층의 체중감소가 확인되는 시점에 서 일차의료의의 적극적인 개입이 필요할 것으로 보인다. 그러나, 과 체중 노인층에게까지 의도적인 체중감소를 권할지, 얼마나 감소하 도록 권할지 여부와 성별에 따른 의도적인 체중감소 효과 여부는 연 구가 더 필요하겠다.
요 약
연구배경:
이전 관찰 연구들은 노인층에서 체중감소는 사망률을 증가시킨다고 하였으나 최근의 일부 연구에서 노인층의 의도적인 체중감소는 사망률을 높이지 않는다는 결과들도 보여주고 있다. 이 메타 분석의 목적은 노인층의 체중관리에 대한 근거중심의 의학적 조언을 위한 근거를 마련하기 위함이다.방법:
체계적 문헌 고찰을 통해 체중감소에 따른 사망률에 대해 2015년 6월까지 연구된 14개의 문을 선정하였고 메타분석을 위해 relative risk (RR) 값과 95% confidence interval (CI) 값을 추출하였다.하위그룹 분석을 위하여 체중감소의 의도가 있는 경우와 그렇지 않 은 경우 그리고 성별에 따라 구별하고 분석을 진행하였다.
결과:
체중감소는 노인층에서 사망률을 증가시킨다(RR 1.57, 95% CI 1.36–1.78; P<0.001). 의도적인 체중감소는 사망률을 감소시키지만 (RR 0.61, 95% CI 0.43–0.85; P<0.001), 비의도적인 체중감소는 사망률 을 82% 증가시켰다(RR 1.82, 95% CI 1.58–2.08; P<0.001). 남성의 경우 사망률을 증가시키거나 감소시키지 않았으나(RR 1.32, 95% CI 0.97–1.77; P>0.05). 여성의 경우 사망률을 증가시켰다(RR 1.68, 95% CI 1.20–2.35; P<0.001).
결론:
노인층에서 의도되지 않은 체중감소는 사망률을 증가시키지 만 의도된 체중감소는 의미 있게 사망률을 감소시켰다. 의도적인 체 중감소의 효과와 남녀의 차이에 대해 더 많은 연구가 필요하다.중심단어:
체중감소; 사망률; 노인REFERENCES
1. Volpato S, Guralnik JM, Ferrucci L, Balfour J, Chaves P, Fried LP, et al. Car- diovascular disease, interleukin-6, and risk of mortality in older women: the women’s health and aging study. Circulation 2001; 103: 947-53.
2. National High Blood Pressure Education Program Working Group report on primary prevention of hypertension. Arch Intern Med 1993; 153: 186- 208.
3. Bano G. Glucose homeostasis, obesity and diabetes. Best Pract Res Clin Ob- stet Gynaecol 2013; 27: 715-26.
4. Newman AB, Yanez D, Harris T, Duxbury A, Enright PL, Fried LP; Cardio- vascular Study Research Group. Weight change in old age and its association with mortality. J Am Geriatr Soc 2001; 49: 1309-18.
5. Murphy RA, Patel KV, Kritchevsky SB, Houston DK, Newman AB, Koster A, et al. Weight change, body composition, and risk of mobility disability and mortality in older adults: a population-based cohort study. J Am Geriatr Soc 2014; 62: 1476-83.
6. Arnold AM, Newman AB, Cushman M, Ding J, Kritchevsky S. Body weight dynamics and their association with physical function and mortality in old-
이정웅 외. 노인층에서의 체중감소와 사망률 Korean Journal of Family Practice
KJFP
er adults: the Cardiovascular Health Study. J Gerontol A Biol Sci Med Sci 2010; 65: 63-70.
7. Shea MK, Houston DK, Nicklas BJ, Messier SP, Davis CC, Miller ME, et al.
The effect of randomization to weight loss on total mortality in older over- weight and obese adults: the ADAPT Study. J Gerontol A Biol Sci Med Sci 2010; 65: 519-25.
8. Williamson DF, Pamuk E, Thun M, Flanders D, Byers T, Heath C. Prospec- tive study of intentional weight loss and mortality in overweight white men aged 40-64 years. Am J Epidemiol 1999; 149: 491-503.
9. World Health Organization. Diet, nutrition, and the prevention of chronic diseases: report of a joint WHO/FAO expert consultation. Geneva: World Health Organization; 2003.
10. Lee CG, Boyko EJ, Nielson CM, Stefanick ML, Bauer DC, Hoffman AR, et al. Mortality risk in older men associated with changes in weight, lean mass, and fat mass. J Am Geriatr Soc 2011; 59: 233-40.
11. Somes GW, Kritchevsky SB, Shorr RI, Pahor M, Applegate WB. Body mass index, weight change, and death in older adults: the systolic hypertension in the elderly program. Am J Epidemiol 2002; 156: 132-8.
12. Wedick NM, Barrett-Connor E, Knoke JD, Wingard DL. The relationship between weight loss and all-cause mortality in older men and women with and without diabetes mellitus: the Rancho Bernardo study. J Am Geriatr Soc 2002; 50: 1810-5.
13. Nguyen ND, Center JR, Eisman JA, Nguyen TV. Bone loss, weight loss, and weight fluctuation predict mortality risk in elderly men and women. J Bone Miner Res 2007; 22: 1147-54.
14. Payette H, Coulombe C, Boutier V, Gray-Donald K. Weight loss and mortal- ity among free-living frail elders: a prospective study. J Gerontol A Biol Sci Med Sci 1999; 54: M440-5.
15. Sullivan DH, Liu L, Roberson PK, Bopp MM, Rees JC. Body weight change and mortality in a cohort of elderly patients recently discharged from the hospital. J Am Geriatr Soc 2004; 52: 1696-701.
16. Reynolds MW, Fredman L, Langenberg P, Magaziner J. Weight, weight change, mortality in a random sample of older community-dwelling wom- en. J Am Geriatr Soc 1999; 47: 1409-14.
17. Amador LF, Al Snih S, Markides KS, Goodwin JS. Weight change and mor- tality among older Mexican Americans. Aging Clin Exp Res 2006; 18: 196- 204.
18. Higgins JP, Thompson SG, Deeks JJ, Altman DG. Measuring inconsistency
in meta-analyses. BMJ 2003; 327: 557-60.
19. Wells GA, Shea B, O’Connell D, Peterson J, Welch V, Losos M, et al. The Newcastle-Ottawa Scale (NOS) for assessing the quality of nonrandomised studies in metaanalyses [Internet]. Ottawa: Ottawa Hospital Research Insti- tute; 2015 [cited 2015 Oct 19]. Available from: http://www.ohri.ca/pro- grams/clinical_epidemiology/oxford.asp.
20. Harrington M, Gibson S, Cottrell RC. A review and meta-analysis of the ef- fect of weight loss on all-cause mortality risk. Nutr Res Rev 2009; 22: 93-108.
21. Gaddey HL, Holder K. Unintentional weight loss in older adults. Am Fam Physician 2014; 89: 718-22.
22. Morley JE. Anorexia of aging: physiologic and pathologic. Am J Clin Nutr 1997; 66: 760-73.
23. Ritchie CS, Locher JL, Roth DL, McVie T, Sawyer P, Allman R. Unintentional weight loss predicts decline in activities of daily living function and life- space mobility over 4 years among community-dwelling older adults. J Gerontol A Biol Sci Med Sci 2008; 63: 67-75.
24. Chapman KM, Nelson RA. Loss of appetite: managing unwanted weight loss in the older patient. Geriatrics 1994; 49: 54-9.
25. Fried LP, Kronmal RA, Newman AB, Bild DE, Mittelmark MB, Polak JF, et al.
Risk factors for 5-year mortality in older adults: the Cardiovascular Health Study. JAMA 1998; 279: 585-92.
26. Locher JL, Roth DL, Ritchie CS, Cox K, Sawyer P, Bodner EV, et al. Body mass index, weight loss, and mortality in community-dwelling older adults.
J Gerontol A Biol Sci Med Sci 2007; 62: 1389-92.
27. Gregg EW, Gerzoff RB, Thompson TJ, Williamson DF. Intentional weight loss and death in overweight and obese U.S. adults 35 years of age and older.
Ann Intern Med 2003; 138: 383-9.
28. Flegal KM, Kit BK, Orpana H, Graubard BI. Association of all-cause mortal- ity with overweight and obesity using standard body mass index categories:
a systematic review and meta-analysis. JAMA 2013; 309: 71-82.
29. Allison DB, Gallagher D, Heo M, Pi-Sunyer FX, Heymsfield SB. Body mass index and all-cause mortality among people age 70 and over: the Longitudi- nal Study of Aging. Int J Obes Relat Metab Disord 1997; 21: 424-31.
30. Shea MK, Nicklas BJ, Houston DK, Miller ME, Davis CC, Kitzman DW, et al. The effect of intentional weight loss on all-cause mortality in older adults:
results of a randomized controlled weight-loss trial. Am J Clin Nutr 2011;
94: 839-46.