https://doi.org/10.3350/cmh.2016.0059 Clinical and Molecular Hepatology 2017;23:34-41
Original Article
Corresponding author : Soon Koo Baik
Department of Internal Medicine, Yonsei University Wonju College of Medicine, 20 Ilsan-ro, Wonju 26426, Korea
Tel: +82-33-741-1229, Fax: +82-33-745-6782 E-mail: baiksk@yonsei.ac.kr
Abbreviations:
AUROC, area under the receiver operating characteristic curve; CI, confidence interval; CLD, chronic liver disease; COR, correlation; CSPH, clinically significant PH; HVPG, hepatic venous pressure gradient; MA, metaanalysis; NPV, negative predictive value; PH, portal hypertension; PPV, positive predictive value; PRISMA, Preferred Reporting Items for Systematic Reviews and Meta-Analyses; QUADAS, Quality Assessment of Diagnostic Accuracy Studies; SR, systematic review; TE, transient elastography
Received : Sep. 11, 2016 / Revised : Nov. 2, 2016 / Accepted : Nov. 9, 2016
INTRODUCTION
Portal hypertension (PH) is a major consequence of chronic liver disease that can lead to serious complications, such as variceal bleeding and ascites.
1,2PH is responsible for significant morbidity and mortality, particularly in patients with decompensated cirrhosis.
1-4In
this regard, the diagnosis and precise discrimination of PH severity allow prediction of prognosis and essential for managing chronic liver disease (CLD) appropriately. Measurement of the hepatic ve- nous pressure gradient (HVPG) has been accepted as the gold standard for assessing the degree of PH. Clinically significant PH (CSPH) defined as HVPG ≥10 mmHg, has been associated with
Transient elastography versus hepatic venous pressure gradient for diagnosing portal hypertension: a systematic review and meta-analysis
Gaeun Kim
1, Moon Young Kim
2, and Soon Koo Baik
2,3,41
Research Institute for Nursing Science, College of Nursing, Keimyung University, Daegu;
2Department of Internal Medicine,
3
Cell Therapy and Tissue Engineering Center,
4Institute of Evidence-based Medicine, Yonsei University Wonju College of Medicine, Wonju, Korea
Background/Aims: Transient elastography (TE) has been proposed as a promising noninvasive alternative to hepatic venous pressure gradient (HVPG) for detecting portal hypertension (PH). However, previous studies have yielded conflicting results. We gathered evidence from literature on the clinical usefulness of TE versus HVPG for assessing PH.
Methods: We conducted a systematic review by searching databases for relevant literature evaluating the clinical usefulness of non-invasive TE for assessing PH in patients with cirrhosis. A literature search in Ovid Medline, EMBASE and the Cochrane Library was performed for all studies published prior to December 30, 2015.
Results: Eight studies (1,356 patients) met our inclusion criteria. For the detection of PH (HVPG ≥6 mmHg), the summary sensitivity and specificity were 0.88 (95% confidence interval [CI] 0.86-0.90) and 0.74 (95% CI 0.67-0.81), respectively.
Regarding clinically significant PH (HVPG ≥10 mmHg), the summary sensitivity and specificity were 0.85 (95% CI 0.63-0.97) and 0.71 (95% CI 0.50-0.93), respectively. The overall correlation estimate of TE and HVPG was large (0.75, 95% CI: 0.65; 0.82, P<0.0001).
Conclusions: TE showed high accuracy and correlation for detecting the severity of PH. Therefore, TE shows promise as a reliable and non-invasive procedure for the evaluation of PH that should be integrated into clinical practice.
(Clin Mol Hepatol 2017;23:34-41)
Keywords: Elastography; Hypertension, Portal; Liver cirrhosis; Review, Systematic; Meta-analysis
Gaeun Kim, et al.
Transient elastography for diagnosing portal hypertension
formation of esophageal varices and poor prognosis.
5-7However, the routine use of this method in clinical setting has been limited by its invasiveness and the need for expertise and specialized equipment.
Therefore, an alternative, non-invasive technique allowing clini- cians to diagnose and grade PH in patients with cirrhosis and that could replace HVPG is needed. Transient elastography (TE) has been established as a non-invasive method of measuring liver stiffness due to its diagnostic accuracy in hepatic fibrosis.
7Accu- mulating evidence suggests that TE adequately reflects the find- ings of HVPG, indicating that it is a useful modality for evaluating PH and cirrhotic complications.
8-14However, some studies have re- ported conflicting results indicating TE is not sufficiently accurate to replace HVPG due to its insufficient sensitivity or specificity.
15Hence, controversy remains regarding the usefulness of TE for as- sessing PH. Systematic reviews (SRs) and meta-analyses (MAs) have facilitated objective evaluation of existing evidence.
16-20Shi et al.
21reported the results of their MA for TE in the diagnosis of PH and esophageal varices and further studies should be per- formed to confirm their conclusion.
Thus, the present SR and MA identified the clinical usefulness of non-invasive TE for assessing PH as an alternative to HVPG in patients with CLD.
MATERIALS AND METHODS Literature search
We performed a literature search to identify published study ar- ticles that examined TE for the diagnosis of PH in patients with CLD. We searched Ovid Medline, the Cochrane Library and EM- BASE for the studies published prior to December 30, 2015, using the following search terms: elastography, liver stiffness, portal hy- pertension, chronic liver disease and diagnostic test. Then, a man- ual search of the reference lists of the primary studies was per- formed to locate any other studies. The present study was performed according to the PRISMA Statement.
22Study inclusion/exclusion
The inclusion criteria for primary studies were as follows: (1) studies that evaluated the accuracy of liver stiffness performed using TE for the prediction of PH in patients with CLD; (2) studies that measured portal pressure using the HVPG; PH defined as ≥6
mmHg, CSPH ≥10 mmHg and severe PH ≥12 mmHg; (3) studies that reported the data necessary to calculate the true positive, false positive, true negative and false negative diagnostic results of TE for the diagnosis of PH, significant PH and severe PH based on cut-off values. If such data were unavailable, the correspond- ing author was contacted.
Quality assessment of the primary studies
The quality of the studies included in the MA was assessed us- ing the Quality Assessment of Diagnostic Accuracy Studies (QUA- DAS) questionnaire, which was designed to assess the internal and external validity of the diagnostic accuracy of studies in this analy- sis. This tool is a 14-item instrument that allows the identification of important design elements in diagnostic accuracy studies, such as the patient spectrum, the presence or absence of observer blind- ing and verification bias, the handling of indeterminate results and the reporting of patients lost to follow-up. Each study that met the inclusion criteria was analyzed by two independent reviewers. Dis- crepancies in the results were handled by a consensus review. If the QUADAS score was less than 10 points, the study was classi- fied as having low methodological quality.
Data extraction
Two reviewers independently extracted required information from the primary studies based on a fixed protocol. In each study, the following information was obtained: author; study publication year; country; study design; number of patients; patient age and sex; CLD etiology; prevalence of PH and significant PH; TE cut-off for PH; number of true positives, false positives, true negatives, and false negatives; sensitivity; specificity; positive predictive val- ue; negative predictive value; area under the receiver operating characteristic curve (AUROC); and correlation coefficient estimate.
Data analysis/synthesis
The integrated results of each study were presented to show their combined effect, measured as summary sensitivity values, specificity values, likelihood ratios and summary correlations with 95% confidence interval (CI) used to examine the TE accuracy for PH. The effect size regarding the correlation coefficient between TE and HVPG was calculated with transformation using Fisher’s Z.
Correlation forest and radial plots were also constructed to deter-
mine the diagnostic accuracy of the test parameters.
The heterogeneity of all diagnostic test parameters was initially evaluated with a graphic examination of forest plots for each pa- rameter. Then, a statistical assessment was performed with the inconsistency index (I
2). The I
2statistic was defined as the percent- age of variability due to heterogeneity beyond that from chance;
values >50% represented the possibility of substantial heteroge- neity.
Finally, publication bias analysis and sensitivity analysis were conducted to verify the validity of the results. The analyses were performed using Review Manager (RevMan) version 5.3 (The Co- chrane Collaboration, London, UK), comprehensive meta-analysis software version 3.0 (Biostat, Inc., Englewood, NJ, USA) and R statistical software (The R Foundation, Vienna, Austria).
RESULTS
Characteristics of studies in our analysis
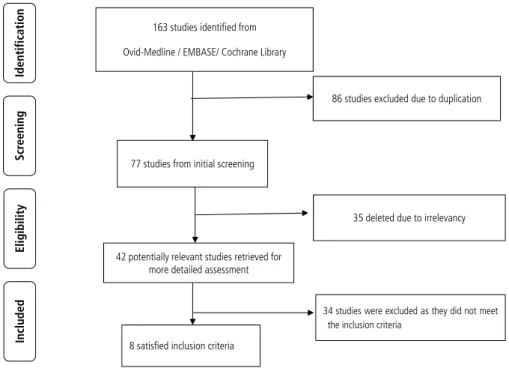
Based on the described search strategies, 163 studies were re- trieved. After eliminating the duplicates (n=86) or studies that were unrelated to the topic (n=35), 42 potentially relevant studies were identified for further evaluation. Ultimately, 34 studies were excluded for undesirable article type (n=17), not written in English (n=1), failing to evaluate TE accuracy (n=7), irrelevant to CLD (n=7), or containing insufficient data (n=2). Thus, eight studies
fulfilled the inclusion criteria. The flow chart of the study selection is shown in Figure 1.
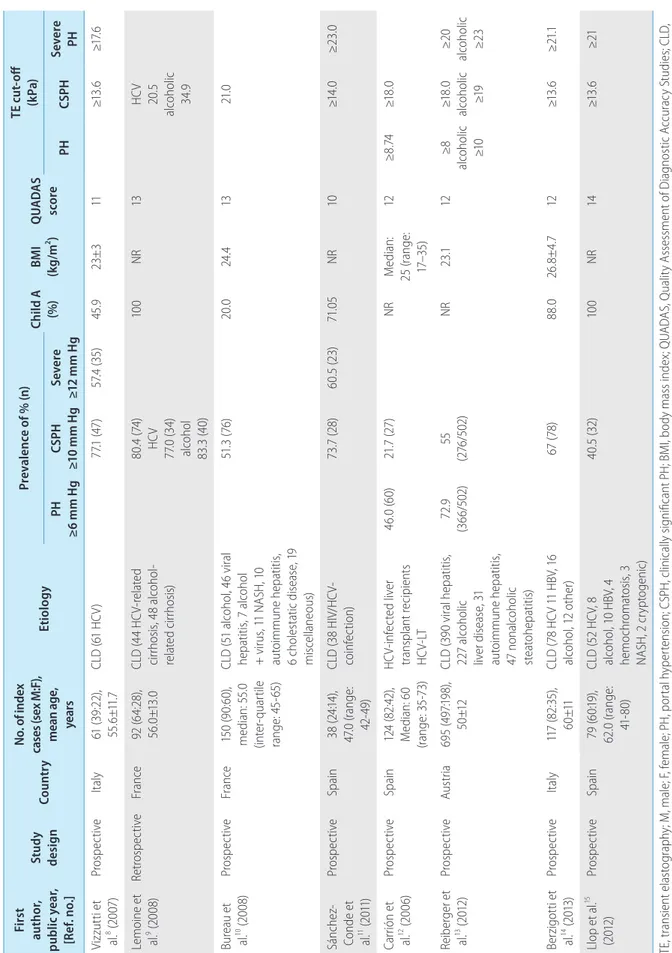
The main study characteristics included in this analysis are sum- marized in Table 1; 1,356 patients (mean age: 55.1 years, 69.2%
male) were included. The overall prevalence of PH, significant PH and severe PH were 59.4% (range: 46.0-72.9%), 58.3% (range:
21.7-80.4%), and 58.9% (range: 57.4-60.5%), respectively.
Based on the QUADAS scale, the included studies had very good methodological quality (Table 1).
Accuracy of TE for the detection of PH/CSPH/severe PH
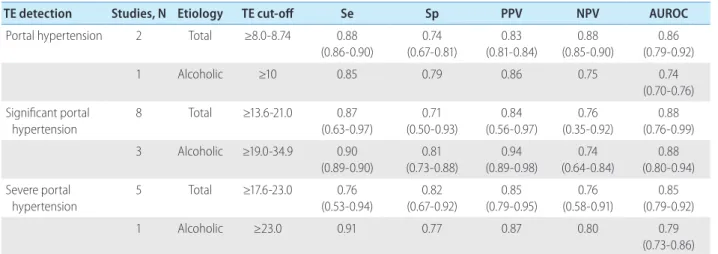
Two
12,13studies evaluated the diagnostic accuracy of TE for PH (Table 2). The cut-off value of liver stiffness ranged from 8-8.74 kPa. The sensitivity and specificity were 0.88 (range: 0.86-0.90) and 0.74 (range: 0.67-0.81), respectively. The positive predictive value (PPV) and negative predictive value (NPV) were 0.83 (range:
0.81-0.84) and 0.88 (range: 0.85-0.90), respectively. The AUROC for the diagnosis of PH (HVPG ≥6 mmHg) was 0.86 (range: 0.79- 0.92). One study reported a significant correlation between TE and HVPG for the diagnosis of PH (r=0.84, P<0.001).
A forest plot of the eight studies showed pooled correlation be- tween HVPG and TE (Figs. 2 and 3). Five studies demonstrated a relationship between TE and HVPG for the diagnosis of CSPH
9-11,14,15and a significant correlation was observed with an effect size of correlation (COR) 0.7480 (95% CI, 0.6464; 0.8236, P<0.0001)
Scr een in g Included El ig ibi lit y Identification
163 studies identified from Ovid-Medline / EMBASE/ Cochrane Library
86 studies excluded due to duplication
77 studies from initial screening
34 studies were excluded as they did not meet the inclusion criteria
8 satisfied inclusion criteria 42 potentially relevant studies retrieved for
more detailed assessment
35 deleted due to irrelevancy Scr een in g Included El ig ibi lit y Identification
163 studies identified from Ovid-Medline / EMBASE/ Cochrane Library
86 studies excluded due to duplication
77 studies from initial screening
34 studies were excluded as they did not meet the inclusion criteria
8 satisfied inclusion criteria 42 potentially relevant studies retrieved for
more detailed assessment
35 deleted due to irrelevancy
Figure 1. Flow diagram of study se-
lection for the systematic review and
meta-analysis.
Gaeun Kim, et al.
Transient elastography for diagnosing portal hypertension
Ta bl e 1. T he m ai n c ha ra ct er ist ic s o f s tu di es e val ua tin g th e pe rfo rm an ce o f T E fo r d et ec tio n o f p or tal h yp er te nsi on , c lin ic al ly si gn ifi can t p or tal h yp er te nsi on , an d se ve re p or tal h yp er te nsi on Fi rs t au thor , pu blic y ear , [R ef . n o.]
St udy des ign Coun tr y N o. o f i nd ex ca se s ( se x M :F ), m ea n a ge , ye ar s
Eti ol og y Pr ev al en ce o f % ( n) Ch ild A (%) BM I (k g/m
2) Q UAD AS sc or e
TE cut -off (k Pa) PH ≥6 m m H g CS PH ≥1 0 m m H g Se ve re ≥1 2 m m H g PH CS PH Se ve re PH Vi zz ut ti e t al .
8(2 007 ) Pro sp ec tiv e Ital y 61 (3 9:2 2) , 55 .6 ±11 .7 CL D ( 61 H CV ) 77. 1 ( 47 ) 57 .4 (3 5) 45 .9 23± 3 11 ≥1 3. 6 ≥1 7.6 Lem oi ne e t al .
9(2 00 8) Re tro sp ec tiv e Fr an ce 92 (6 4: 28 ), 56 .0 ±1 3.0 CL D ( 44 H CV -re la te d ci rrh os is, 4 8 al co ho l- re la te d c irr ho sis )
80. 4 (7 4) HC V 77. 0 ( 34 ) al co ho l 83 .3 (4 0)
10 0 NR 13 HC V 20 .5 al co ho lic 34 .9 Bur ea u e t al .
10(2 00 8) Pro sp ec tiv e Fr an ce 15 0 ( 90 :6 0) , m ed ian : 5 5. 0 (in ter -qu ar til e ran ge : 4 5- 65 ) CL D ( 51 al co ho l, 4 6 v iral hep at iti s, 7 al co ho l + v iru s, 1 1 N AS H, 1 0 au to im m un e h ep at iti s, 6 c ho le st at ic d ise as e, 1 9 m isc el la ne ous )
51 .3 (7 6) 20 .0 24 .4 13 21. 0 Sán ch ez‐ Co nd e e t al .
11(2 011 )
Pro sp ec tiv e Sp ai n 38 (2 4:1 4) , 47 .0 ( ran ge : 42 -4 9)
CL D ( 38 H IV /H CV - co in fe ct io n) 73. 7 ( 28 ) 60. 5 ( 23 ) 71. 05 NR 10 ≥1 4. 0 ≥23 .0 Car rió n e t al .
12(2 00 6) Pro sp ec tiv e Sp ai n 12 4 ( 82 :42 ), M ed ian : 6 0 (ran ge : 3 5- 73 ) HC V- in fe ct ed l iv er tran sp lan t r eci pi en ts HC V- LT 46 .0 (6 0) 21. 7 ( 27 ) NR M ed ian : 25 ( ran ge : 17 –3 5)
12 ≥8 .74 ≥1 8. 0 Rei ber ger e t al .
13(2 012 ) Pro sp ec tiv e Au st ria 69 5 ( 49 7:1 98 ), 50 ±1 2 CL D ( 39 0 v iral h ep at iti s, 22 7 al co ho lic liv er d ise as e, 3 1 au to im m un e h ep at iti s, 47 n on al co ho lic st ea to he pa tit is)
72 .9 (3 66 /5 02 ) 55 (2 76 /5 02 ) NR 23 .1 12 ≥8 al co ho lic ≥1 0
≥1 8. 0 al co ho lic ≥1 9
≥2 0 al co ho lic ≥2 3 Ber zig ot ti e t al .
14(2 013 ) Pro sp ec tiv e Ital y 11 7 ( 82 :3 5) , 60 ±11 CL D (7 8 H CV 1 1 H BV , 1 6 al co ho l, 1 2 o th er ) 67 (7 8) 88 .0 26 .8 ± 4. 7 12 ≥1 3. 6 ≥2 1.1 Ll op e t al .
15(2 012 ) Pro sp ec tiv e Sp ai n 79 (6 0:1 9) , 62 .0 ( ran ge : 41 -8 0)
CL D ( 52 H CV , 8 al co ho l, 1 0 H BV , 4 hem och ro m at os is, 3 NA SH , 2 c ry pt og en ic)
40. 5 ( 32 ) 10 0 NR 14 ≥1 3. 6 ≥21 TE , t ran sien t e las to gr ap hy ; M , m al e; F , f em al e; P H, p or tal h yp er ten sio n; C SP H, cl in ic al ly s ign ifi can t P H; B M I, b od y m as s i nd ex ; Q UA DA S, Q ual ity A ss es sm en t o f D ia gn os tic A cc ur ac y S tu di es ; C LD , ch ro ni c l iv er d ise as e; H CV , h ep at iti s C v iru s; N AS H, n on al co ho lic s te at oh ep at iti s; H IV , h um an i m m un od efi ci en cy v iru s; N R, n or m al r an ge ; L T, l iv er t ran sp lan ta tio n; H BV , h ep at iti s B v iru s.
Clin Mol Hepatol
Volume
_23 Number
_1 March 2017
according to the random effects model (Figs. 2 and 3). The I
2sta- tistic value was 84.7%, indicative of substantial heterogeneity caused by the inconsistent characteristics of the included studies, including patient characteristics, cirrhosis etiologies, and varying diagnostic thresholds.
Eight studies
8-15evaluated the diagnostic accuracy of TE for CSPH (Table 2). The cut-off value of liver stiffness ranged from 13.6-21.0 kPa (alcoholic 19-34.9 kPa). The sensitivity and specific- ity were 0.85 (range: 0.63-0.97) and 0.71 (range: 0.50-0.93), re- spectively. The PPV and NPV were 0.84 (range: 0.56-0.97) and 0.76 (range: 0.35-0.92), respectively. The AUROC for the diagno- sis of CSPH (HVPG ≥10 mmHg) was 0.88 (range: 0.76-0.99).
Five studies
8,11,13-15evaluated the diagnostic accuracy of TE for
severe PH (Table 2). The cut-off value of liver stiffness varied from 17.6-23.0 kPa (alcoholic 23.0 kPa). The sensitivity and specificity were 0.76 (range: 0.53-0.94) and 0.82 (range: 0.67-0.92), respec- tively. The PPV and NPV were 0.85 (range: 0.79-0.95) and 0.76 (range: 0.58-0.91), respectively. The AUROC for the diagnosis of CSPH (HVPG ≥12 mmHg) was 0.85 (range: 0.79-0.92).
Assessment of publication bias and sensitivity analysis
We used a funnel plot to examine publication bias. The results of the MA showed a symmetrical shape for pooled correlation in 5 studies. The adjusted pooled correlation calculated using the trim-and-fill method was 0.80 (95% CI, 0.71; 0.86, P<0.0001), which was slightly higher than the observed effect size of 0.75 (95% CI, 0.65; 0.82, P<0.0001), but it had no major impact on this study (Fig. 4).
We performed sensitivity analysis to assess the extent to which our results were sensitive to the analysis restricted only to those studies. No significant difference was found for the pooled results of any of the assessed outcomes.
DISCUSSION
The objective of this SR and MA was to identify the clinical use- fulness of non-invasive TE for assessing PH in patients with CLD.
There has been considerable interest in developing and validating non-invasive methods to detect PH among patients with cirrho- sis.
5-15,17Accordingly, this review can help researchers compare and select the most appropriate non-invasive evaluations for PH
elastography and hepatic venous pressure gradient
Study
Random effects model
Heterogeneity: I-squared=84.7%, tau-squared=0.0409, P<0.0001 Lemoine, 2008
Bureau, 2008
Sanchez-Conde, 2010 Llop, 2012
Berzigotti, 2013
Total 150 92 38 79 695
-0.5 0 0.5
Correlation
COR
0.75 0.73 0.86 0.68 0.55 0.79
95%-CI
[0.65; 0.82]
[0.62; 0.81]
[0.81; 0.90]
[0.46; 0.82]
[0.37; 0.69]
[0.76; 0.82]
W(fixed) 14.1% 8.6%
3.4% 7.3%
66.6%
W(random)
100%
19.8%
21.7%
14.9%
19.1%
24.4%
Figure 2. Pooled correlation between transient elastography and hepatic venous pressure gradient. COR, correlation; CI, confidence interval; W, weight.
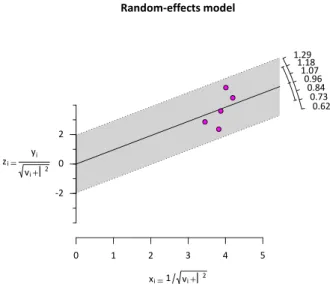
Fig 3. Radial Plot for Correlation between transient elastography and hepatic venous pressure
gradient
Random-effects model
x
i 1 v
i
20 1 2 3 4 5
-2 0 2 z
i y
iv
i
20.73 0.62 0.96 0.84 1.18 1.07 1.29
Figure 3. Radial Plot for Correlation between transient elastography
and hepatic venous pressure gradient.
Gaeun Kim, et al.
Transient elastography for diagnosing portal hypertension
in patients with CLD.
To the best of our knowledge, this is the first SR and MA to fo- cus on the utility of measuring TE for diagnosing PH by thorough comparison with HVPG in CLD. Although a Chinese group pre- sented the MA results of TE for diagnosing PH and the presence of esophageal varices, only five published studies have evaluated the performance of TE for significant PH in a small number of pa- tients, limiting the robustness of any conclusion reached.
21In ad- dition, considerable variability existed across different investiga- tions as well as small sizes of individual studies. However, more accumulating data are now available, allowing a more precise analysis of TE versus HVPG for diagnosing PH.
TE has the advantage of being non-invasive and many attempts have been made to assess the degree of hepatic fibrosis using TE.
Recently, several lines of evidence have indicated that TE can be useful for assessing the severity of PH.
8-15This systematic review identified eight studies that evaluated the diagnostic performance of TE with PH in patients with cirrho- sis and fulfilled the inclusion criteria and reported sufficient data.
The diagnostic accuracy of TE for CSPH was high in the present SR and MA (COR 0.7480, 95% CI, 0.6464; 0.8236, P<0.0001).
Furthermore, the sensitivity and specificity were 0.85 (range:
0.63-0.97) and 0.71 (range: 0.50-0.93), respectively; the AUROC was 0.88 (range: 0.76-0.99).
However, Llop et al.
15demonstrated a moderate correlation be- tween TE and HVPG (r=0.552) compared to other studies (r=0.68-0.86). Furthermore, patients with a TE value between 13.6 and 21 kPa had insufficient sensitivity and specificity to de- tect CSPH (HVPG >10 mmHg). The reason for this varying perfor- mance of TE might be that only less severe forms of CLD, such as Child-Pugh A with hepatoma, were included, since this is the tar- get population for identifying CSPH in patients with potentially resectable hepatomas. Most of the studies on patients without hepatoma showed a higher correlation between TE and HVPG than the studies evaluated in this study. Accordingly, the presence of hepatoma and the Child A population in this study were attrib- uted to different results obtained using TE.
Since PH is initiated by an increase in intrahepatic resistance, TE appropriately reflects mild to moderate PH or the initiation of CSPH. However, in cases of severe PH, its severity becomes more dependent on the amount of portal blood inflow and peripheral hemodynamic changes than the stiffness of the hepatic parenchy- ma; thus, the predictive power of TE for PH is limited.
8This expla- Table 2. Summary accuracy of TE detection of PH, clinically significant PH, and severe PH
TE detection Studies, N Etiology TE cut-off Se Sp PPV NPV AUROC
Portal hypertension 2 Total ≥8.0-8.74 0.88
(0.86-0.90) 0.74
(0.67-0.81) 0.83
(0.81-0.84) 0.88
(0.85-0.90) 0.86 (0.79-0.92)
1 Alcoholic ≥10 0.85 0.79 0.86 0.75 0.74
(0.70-0.76) Significant portal
hypertension 8 Total ≥13.6-21.0 0.87
(0.63-0.97) 0.71
(0.50-0.93) 0.84
(0.56-0.97) 0.76
(0.35-0.92) 0.88 (0.76-0.99)
3 Alcoholic ≥19.0-34.9 0.90
(0.89-0.90)
0.81 (0.73-0.88)
0.94 (0.89-0.98)
0.74 (0.64-0.84)
0.88 (0.80-0.94) Severe portal
hypertension 5 Total ≥17.6-23.0 0.76
(0.53-0.94) 0.82
(0.67-0.92) 0.85
(0.79-0.95) 0.76
(0.58-0.91) 0.85 (0.79-0.92)
1 Alcoholic ≥23.0 0.91 0.77 0.87 0.80 0.79
(0.73-0.86) TE, transient elastography; PH, portal hypertension; PPV, positive predictive value; NPV, negative predictive value; AUROC, area under the receiver operating characteristic curve.
Fig 4. Trim and fill funnel plot on the pooled correlation
Adjusted funnel plot
Observed outcome Standard error 0.1690.1270.0850.0420.000
0.25 0.50 1.00 2.00 4.00