© 2014 The Korean Ophthalmological Society
This is an Open Access article distributed under the terms of the Creative Commons Attribution Non-Commercial License (http://creativecommons.org/licenses /by-nc/3.0/) which permits unrestricted non-commercial use, distribution, and reproduction in any medium, provided the original work is properly cited.
Original Article
Relationship between the Lamina Cribrosa, Outer Retina, and Choroidal Thickness as Assessed Using Spectral Domain Optical
Coherence Tomography
Ho Seok Chung, Kyung Rim Sung, Kyoung Sub Lee, Jong Rak Lee, Soa Kim
Department of Ophthalmology, Asan Medical Center, University of Ulsan College of Medicine, Seoul, Korea
Purpose: To evaluate the characteristics and relationship between peripapillary choroidal thickness (pCT), lam- ina cribrosa thickness (LCT), and peripapillary outer retinal layer thickness (pORT) as determined using spec- tral domain optical coherence tomography (SD-OCT) enhanced depth imaging (EDI).
Methods: In total, 255 participants were included (87 healthy subjects, 87 glaucoma suspects (GS), and 81 glaucoma cases). The pORT, defined as the thickness between the posterior outer plexiform layer and the retinal pigment epithelium (RPE) interface, and the pCT, between the outer margin of the RPE and the cho- roidal-scleral interface, were manually measured using EDI scanning of the circumpapillary retinal nerve fiber layer (RNFL). LCT was determined by EDI scanning of the optic nerve head (ONH). Baseline characteristics, including axial length (AXL) and the SD-OCT measurements of the participants, were compared among the three groups. The correlation between putative factors and pCT was determined using univariate and multi- variate linear regression analyses.
Results: In all three groups, both pORT and pCT were thinnest in the inferior area among the four quadrants. In the healthy group, the mean peripapillary RNFL, pORT, and LCT were significantly greater in comparison with those of the GS and glaucoma groups (p < 0.001, p < 0.038, and p < 0.001, respectively). The pCT demon- strated no significant differences among the three groups (p = 0.083). Only age and AXL were associated with pCT by multivariate analysis.
Conclusions: The pCT is substantially thinner in the inferior area of the ONH. In addition, the pCT demonstrates the strongest correlation with age and AXL, but was not associated with glaucoma or LCT.
Key Words: Choroidal thickness, Glaucoma, Lamina cribrosa thickness, Optical coherence tomography, Outer retinal thickness
The choroid is the vascular layer that supplies the outer retina, ciliary body, and iris. Because part of the optic nerve head (ONH) is supplied by peripapillary choroidal
circulation, the choroidal layer has been the focus of re- search on the pathogenesis of glaucoma [1,2].The choroidal layer is invisible upon routine ophthalmoscopic examina- tion because it lies beneath the retina. Choroidal circula- tion is usually assessed by angiography, such as fluorescein angiography or indocyanine green angiography. However, the structural features of the choroidal layer are usually inaccessible using established imaging devices.
Optical coherence tomography (OCT), an imaging tech-
Received: September 5, 2013 Accepted: October 18, 2013
Corresponding Author: Kyung Rim Sung, MD, PhD. Department of Ophthalmology, Asan Medical Center, University of Ulsan College of Medicine, #88 Olympic-ro 43-gil, Songpa-gu, Seoul 138-736, Korea. Tel:
82-2-3010-3680, Fax: 82-2-470-6440, E-mail: [email protected]
nique used to observe the posterior segment of the eye, can provide high-resolution cross-sectional images of the retina and determine its in vivo status. However, the penetration of the OCT signal into deeper structures is limited; there- fore, it is difficult to visualize deep-seated structures using OCT. Recent improvements in imaging technologies, in- cluding enhanced depth imaging (EDI), spectral domain (SD)-OCT, and sophisticated analysis techniques, enable clinicians to assess deeper structures such as the choroidal layer [3].
Choroidal thickness has already been assessed using SD- OCT and EDI in several studies [4-11].However, the rela- tionship between choroidal thickness and glaucoma is un- certain. Overall, macular choroidal thickness is not associated with glaucoma [4,7,9].Studies assessing the rela- tionship between peripapillary choroidal thickness (pCT) and glaucoma report conflicting results [8,10].We believe that these differing results regarding the pCT are associat- ed with various factors; thus, analytical results vary de- pending on the included factors. According to the previous studies, age and axial length (AXL) are consistently asso- ciated with pCT [3,4,7,11].
Using these known variables, we included other import- ant factors in order to assess any relationship further. The lamina cribrosa (LC) is the primary site of glaucoma pathogenesis, and the blood supply of the LC is principally maintained by choroidal circulation [12].Using SD-OCT and EDI technology, LC thickness (LCT) can also be de- termined [13-16].Furthermore, the outer retinal layer is also supplied by choroidal circulation. We included both LCT and peripapillary outer retinal layer thickness (pORT) as covariates in the current study, and we evaluated the characteristics and factors associated with pCT.
Materials and Methods
All study subjects were prospectively and consecutively recruited from our glaucoma clinic and examined between February 2011 and November 2012. The healthy group consisted of staff, their family members, the spouses of patients, and volunteers from the eye clinic and hospital.
The healthy group had no history of ocular symptoms or disease, or of intraocular incisional or laser surgery.
At the initial evaluation, all patients received a complete ophthalmologic examination that included the recording of
medical, ocular, and family histories; visual acuity (VA) testing, Humphrey f ield analyzer (HFA) Swedish Interactive Threshold Algorithm 24-2 testing (Carl Zeiss Meditec, Dublin, CA, USA); multiple intraocular pressure (IOP) measurements using Goldmann applanation tonometry; stereoscopic optic disc photography; the determination of AXL (IOLMaster, Carl Zeiss Meditec) and central corneal thickness (CCT; DGH-1000 Ultrasonic Pachymeter, DGH Technology, Exton, PA, USA); and SD- OCT imaging (Spectralis; Heidelberg Engineering, Dos- senheim, Germany).
For inclusion in this study, all participants had to meet the following criteria: best-corrected VA of 20 / 30 or better with a spherical refractive error within ±5 diopters (D) and cylinder correction within +3 D; normal anterior chamber and open-angle on slit-lamp and gonioscopic examinations, respectively; and reliable HFA test results with a false-positive error <15%, false-negative error
<15%, and fixation loss <20%. Subjects with any ophthalmic diseases that could result in HFA defects and those with a history of diabetes mellitus or intraocular surgery were excluded. One eye was randomly selected if both eyes were determined to be eligible. All healthy eyes demonstrated IOP values <22 mmHg with no history of IOP elevation and were normal upon visual field (VF) testing by HFA examinations. Glaucomatous eyes were defined as those with glaucomatous VF defects that were confirmed by two consecutive examinations that yielded reliable data, the presence of a glaucomatous optic disc that demonstrated increased cupping (vertical cup-disc ratio >0.6), a difference in the vertical cup-disc ratio of the eyes greater than 0.2, diffuse or focal neural rim thinning, or hemorrhage, as agreed upon by two glaucoma experts (KRS and JRL). Eyes with glaucomatous VF defects were defined as those with glaucoma hemifield test results outside normal limits or pattern standard deviations outside 95% of the normal limits. In addition, a cluster of three points with probability <5% on the pattern deviation map in at least one hemifield, including ≥1 point with probability <1% or a cluster of two points with probability
<1%, was required. Glaucoma suspect (GS) eyes included those with a glaucomatous disc but normal VF. All glaucoma and GS patients were newly diagnosed and had not received glaucoma medications.
All procedures conformed to the Declaration of Helsinki, and all participants provided written informed consent.
This study was approved by the institutional review board of Asan Medical Center, University of Ulsan, Seoul, Korea.
Spectral domain optical coherence tomography mea- surement and analysis
Only high-quality images were accepted. Such images were correctly focused, evenly illuminated, and centered on the optic disc. Using commercial software (Heidelberg Eye Explorer software ver. 1.7.0.0, Heidelberg Engineer- ing), pORT (defined as the thickness between the posterior outer plexiform layer and the retinal pigment epithelium [RPE] interface) and pCT (defined as the thickness be- tween the outer margin of the RPE and the choroidal-scler- al interface) were manually measured by a single observer (HSC) using EDI scanning of the circumpapillary retinal nerve fiber layer (RNFL). All measurements were nasal, superior, temporal, or inferior (i.e., the four quadrants that were examined) to the disc and taken at the peripapillary region.
LCT was determined by a different observer (SK) using ONH scanning. Briefly, the entire ONH was scanned using a 6-mm line at 50-μm intervals (512 A-scans). In this study, a mean of 35 horizontal B-scans was produced in EDI mode for each patient. From these B-scans, three frames (center, mid-superior, and mid-inferior) that passed through the ONH were selected. LCT was defined as the
distance between the anterior and posterior borders of the LC. The anterior and posterior borders of the LC were de- fined using a highly reflective structure below the optic cup. More detailed information is provided elsewhere [15].
The mean thickness of the peripapillary retinal nerve fiber layer (pRNFL) in each of the four quadrants (superior, inferior, nasal, and temporal) was provided by the manufacturer of the SD-OCT.
ANOVA (post hoc analysis, Tukey’s test) was performed to compare the baseline characteristics and SD-OCT mea- surements of the three groups. Correlations between puta- tive factors and pCT were determined in the glaucoma and healthy groups using univariate and multivariate linear re- gression analyses. Factors demonstrating p-values less than 0.2 by univariate analysis were incorporated into the mul- tivariate analysis. Statistical analyses were performed us- ing SPSS ver. 19.0 for Windows (IBM Corp., Armonk, NY, USA).
Results
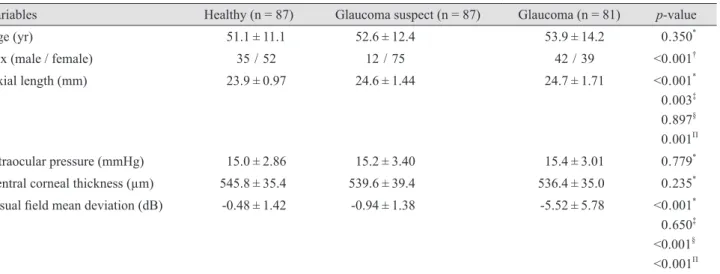
In total, 255 participants were included in the study (87 in the healthy group, 87 in the GS group, and 81 in the glaucoma group). The baseline characteristics of these par- ticipants are shown in Table 1. When comparing the char- acteristics and measurements of the three groups, there
Table 1. Baseline characteristics of the healthy, glaucoma suspect, and glaucoma groups
Variables Healthy (n = 87) Glaucoma suspect (n = 87) Glaucoma (n = 81) p-value
Age (yr) 51.1 ± 11.1 52.6 ± 12.4 53.9 ± 14.2 0 . 350*
Sex (male / female) 35 / 52 12 / 75 42 / 39 <0 . 001†
Axial length (mm) 23.9 ± 0.97 24.6 ± 1.44 24.7 ± 1.71 <0 . 001*
0 . 003‡ 0 . 897§ 0 . 001Π
Intraocular pressure (mmHg) 15.0 ± 2.86 15.2 ± 3.40 15.4 ± 3.01 0 . 779*
Central corneal thickness (µm) 545.8 ± 35.4 539.6 ± 39.4 536.4 ± 35.0 0 . 235*
Visual field mean deviation (dB) -0.48 ± 1.42 -0.94 ± 1.38 -5.52 ± 5.78 <0 . 001* 0 . 650‡ <0 .001§ <0 . 001Π Values are presented as mean ± SD or number.
*Determined using ANOVA (post hoc analysis, Tukey’s test); †Determined using chi-square test; ‡Comparison of the healthy and glaucoma suspect groups; §Comparison of the glaucoma suspect and glaucoma groups; ΠComparison of the healthy and glaucoma groups.
were no differences in terms of age, IOP, or CCT. The glaucoma group demonstrated significantly lower VF mean deviation values than the healthy and GS groups, as expected.
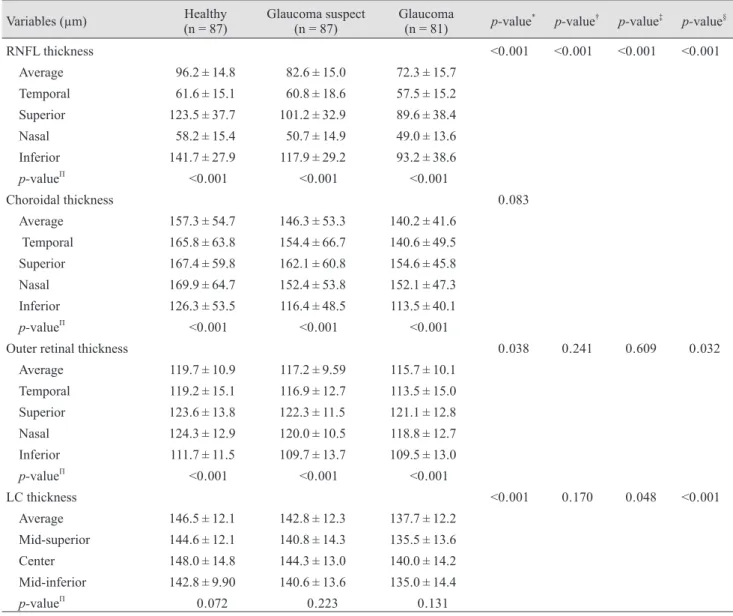
Table 2 presents the pRNFL thickness, pORT, and pCT values measured in the temporal, superior, nasal, and infe- rior quadrants relative to the optic disc and the LCT mea- sured at the three areas of the ONH. In all three groups, both pORT and pCT were thinnest in the inferior area
among the four quadrants which were assessed. In con- trast, the pRNFL was thickest in the inferior area. In the healthy group, the mean pRNFL thickness, pORT, and LCT were signi cantly thicker in comparison with those of the GS and glaucoma groups (p < 0.001, p < 0.038, and p <
0.001, respectively). When we compared the GS and glau- coma groups, the pORT did not demonstrate any of signifi- cant differences (p = 0.609), but the LCT demonstrated a marginal difference (p = 0.048). The three groups did not
Table 2. Thicknesses of the peripapillary RNFL, outer retinal, choroid, and LC determined by spectral domain optical coherence tomography
Variables (µm) Healthy
(n = 87) Glaucoma suspect
(n = 87) Glaucoma
(n = 81) p-value* p-value† p-value‡ p-value§
RNFL thickness <0 . 001 <0 . 001 <0 . 001 <0 . 001
Average 96.2 ± 14.8 82.6 ± 15.0 72.3 ± 15.7
Temporal 61.6 ± 15.1 60.8 ± 18.6 57.5 ± 15.2
Superior 123.5 ± 37.7 101.2 ± 32.9 89.6 ± 38.4
Nasal 58.2 ± 15.4 50.7 ± 14.9 49.0 ± 13.6
Inferior 141.7 ± 27.9 117.9 ± 29.2 93.2 ± 38.6
p-valueΠ <0 . 001 <0 . 001 <0 . 001
Choroidal thickness 0 . 083
Average 157.3 ± 54.7 146.3 ± 53.3 140.2 ± 41.6 Temporal 165.8 ± 63.8 154.4 ± 66.7 140.6 ± 49.5 Superior 167.4 ± 59.8 162.1 ± 60.8 154.6 ± 45.8
Nasal 169.9 ± 64.7 152.4 ± 53.8 152.1 ± 47.3
Inferior 126.3 ± 53.5 116.4 ± 48.5 113.5 ± 40.1
p-valueΠ <0 . 001 <0 . 001 <0 . 001
Outer retinal thickness 0 . 038 0 . 241 0 . 609 0 . 032
Average 119.7 ± 10.9 117.2 ± 9.59 115.7 ± 10.1 Temporal 119.2 ± 15.1 116.9 ± 12.7 113.5 ± 15.0 Superior 123.6 ± 13.8 122.3 ± 11.5 121.1 ± 12.8
Nasal 124.3 ± 12.9 120.0 ± 10.5 118.8 ± 12.7
Inferior 111.7 ± 11.5 109.7 ± 13.7 109.5 ± 13.0
p-valueΠ <0 . 001 <0 . 001 <0 . 001
LC thickness <0 . 001 0 . 170 0 . 048 <0 . 001
Average 146.5 ± 12.1 142.8 ± 12.3 137.7 ± 12.2 Mid-superior 144.6 ± 12.1 140.8 ± 14.3 135.5 ± 13.6 Center 148.0 ± 14.8 144.3 ± 13.0 140.0 ± 14.2 Mid-inferior 142.8 ± 9.90 140.6 ± 13.6 135.0 ± 14.4
p-valueΠ 0 . 072 0 . 223 0 . 131
Values are presented as mean ± SD.
RNFL, retinal nerve fiber layer; LC, lamina cribrosa.
*Intergroup ANOVA testing was performed using the mean values. If p-values were less than 0.05, post hoc analysis (Tukey’s test) was performed; †p-value for the post hoc analysis of the healthy and suspected glaucoma groups; ‡p-value for the post hoc analysis of the suspected glaucoma and glaucoma groups; §p-value for the post hoc analysis of the healthy and glaucoma groups; ΠInterpositional ANOVA was performed for each group and variable.
demonstrate any of significant differences in the pCT (p = 0.083).
When assessed using univariate analysis, age, AXL, pORT, and glaucoma were associated with mean pCT, but LCT and pRNFL thickness were not associated with pCT.
Only age and AXL were associated with pCT according to the multivariate analysis (Table 3).
Discussion
The majority of glaucoma patients in East Asian coun- tries demonstrate a statistically normal range of IOP read- ings [17,18].As described in Table 1, our GS and glaucoma participants also demonstrated no significant differences in terms of untreated baseline IOPs in comparison with the healthy group.
Therefore, various non-IOP-related factors have been in- vestigated as possible contributors to the development of glaucoma [19,20]. One such factor is related to ischemia.
Because ONH is partially supplied by the choroidal circu- lation, the choroidal layer has typically been the focus in this context.
As expected, the GS and glaucoma groups demonstrated thinner pRNFL thicknesses than the healthy group; the GS and glaucoma groups also demonstrated a significant dif- ference in terms of pRNFL thickness. In addition, pORT
was thinner among the patients in the glaucoma group.
Since pORT has not been measured in glaucomatous eyes in the previous studies, we could not compare these results to other study outcomes. Glaucoma is essentially a disease of the inner retina that is characterized by the reduction of the inner retinal layer, which includes the ganglion cell layer and RNFL [21-26]. Therefore, our finding needs to be further investigated in future studies.
Our study results indicated that there were no significant differences in pCT values between the three groups. Previ- ously, pCT was reported to be thinner in a group of highly myopic normal-tension glaucoma patients, but another study indicated that pCT was not associated with glauco- ma [8,10].The LC was thinner in the GS and glaucoma groups than in the healthy group in our current study, which coincides with the previous observation [13].
An interesting finding is that both pCT and pORT were significantly thinner in the inferior quadrant; in particular, pCT was substantially thinner in the inferior quadrant.
This finding was consistent across all three groups. In gen- eral, the inferior RNFL was the thickest among the four quadrants, and the inferior RNFL is the area most vulner- able to glaucomatous damage. In other words, early glau- comatous changes frequently present as a reduction in the thickness of the inferior RNFL [27]. This vulnerability of the inferior RNFL has been explained by the findings that the LC of the inferior pole has larger pores and thinner Table 3. Univariate and multivariate linear regression analyses of mean peripapillary choroidal thickness
Regression coefficient Upper limit of the 95%
confidence interval Lower limit of the 95%
confidence interval p-value Univariate
Age -1 . 060 -1 . 631 -0 . 488 <0 . 001
Axial length -7 . 147 -12 . 299 -1 . 994 0 . 007
Central corneal thickness 0 . 115 -0 . 098 0 . 327 0 . 289
Intraocular pressure -0 . 650 -3 . 233 1 . 934 0 . 620
Mean lamina cribrosa thickness -0 . 247 -0 . 960 0 . 467 0 . 496
Mean peripapillary retinal nerve fiber layer thickness
0 . 264 -0 . 124 0 . 653 0 . 181
Mean peripapillary outer retinal thickness
1 . 294 0 . 612 1 . 976 <0 . 001
Presence of glaucoma -17 . 135 -32 . 010 -2 . 261 0 . 024
Multivariate
Age -1 . 942 -2 . 545 -1 . 339 <0 . 001
Axial length -15 . 709 -21 . 049 -10 . 369 <0 . 001
connective tissue and glial support for passing retinal gan- glion cell axons [28-30].The observations that the LC is supplied by the choroidal layer, the choroidal layer is the thinnest in the inferior area, and that the LC is the weakest at the inferior area are interesting. These findings might be related to each other; however, this speculation needs to be investigated in future studies.
Our univariate analysis, which investigated the correla- tion between putative factors and pCT, demonstrated that age, AXL, pORT, and the presence of glaucoma were as- sociated with mean pCT. According to our multivariate analysis, only age and AXL were associated with pCT. As previously mentioned, age and AXL have been consistent- ly associated with pCT in previous studies [3,4,7,11]. The finding that pORT and the presence of glaucoma were as- sociated with pCT-at least according to the univariate analysis, but not the multivariate one-may be explained by these covariates interacting with age and AXL.
According to our results, LCT was not associated with pCT. Because OCT uses a light source that cannot penetrate the neuroretinal rim, the full features of the LC, including the superior and inferior poles, were not efficiently visual- ized. Thus,the current assessment of LCT is limited to the relatively central area of the LC. This limitation in the esti- mation of the pole area may affect clinical outcomes.
Our study has another limitation. Although choroidal thickness demonstrates good reproducibility in well-con- trolled studies [5,6], its measurement may be variable to some degree because the choroid is essentially vasculature.
Some studies report circadian variability in choroidal thickness (CT) measurements [31-34].Therefore, the vari- ability of CT measurements may affect the outcome of CT studies including ours. Conflicting results among studies may stem from the measurement variability of CT.
In conclusion, pCT was substantially thinner in the infe- rior area of the ONH. In addition, pCT demonstrated a strong correlation with age and AXL, but was not associat- ed with the presence of either glaucoma or LCT in our analysis.
Conflict of Interest
No potential conflict of interest relevant to this article was reported.
References
1. Cioffi GA, Wang L, Fortune B, et al. Chronic ischemia in- duces regional axonal damage in experimental primate op- tic neuropathy. Arch Ophthalmol 2004;122:1517-25.
2. Duijm HF, van den Berg TJ, Greve EL. Choroidal haemo- dynamics in glaucoma. Br J Ophthalmol 1997;81:735-42.
3. Margolis R, Spaide RF. A pilot study of enhanced depth imaging optical coherence tomography of the choroid in normal eyes. Am J Ophthalmol 2009;147:811-5.
4. Mwanza JC, Hochberg JT, Banitt MR, et al. Lack of asso- ciation between glaucoma and macular choroidal thickness measured with enhanced depth-imaging optical coherence tomography. Invest Ophthalmol Vis Sci 2011;52:3430-5.
5. Ikuno Y, Maruko I, Yasuno Y, et al. Reproducibility of ret- inal and choroidal thickness measurements in enhanced depth imaging and high-penetration optical coherence to- mography. Invest Ophthalmol Vis Sci 2011;52:5536-40.
6. Branchini L, Regatieri CV, Flores-Moreno I, et al. Repro- ducibility of choroidal thickness measurements across three spectral domain optical coherence tomography sys- tems. Ophthalmology 2012;119:119-23.
7. Maul EA, Friedman DS, Chang DS, et al. Choroidal thick- ness measured by spectral domain optical coherence to- mography: factors affecting thickness in glaucoma patients.
Ophthalmology 2011;118:1571-9.
8. Ehrlich JR, Peterson J, Parlitsis G, et al. Peripapillary cho- roidal thickness in glaucoma measured with optical coher- ence tomography. Exp Eye Res 2011;92:189-94.
9. Mwanza JC, Sayyad FE, Budenz DL. Choroidal thickness in unilateral advanced glaucoma. Invest Ophthalmol Vis Sci 2012;53:6695-701.
10. Usui S, Ikuno Y, Miki A, et al. Evaluation of the choroidal thickness using high-penetration optical coherence tomog- raphy with long wavelength in highly myopic normal-ten- sion glaucoma. Am J Ophthalmol 2012;153:10-6.
11. Fujiwara T, Imamura Y, Margolis R, et al. Enhanced depth imaging optical coherence tomography of the choroid in highly myopic eyes. Am J Ophthalmol 2009;148:445-50.
12. Sugiyama K, Gu ZB, Kawase C, et al. Optic nerve and peripapillary choroidal microvasculature of the rat eye. In- vest Ophthalmol Vis Sci 1999;40:3084-90.
13. Park HY, Jeon SH, Park CK. Enhanced depth imaging de- tects lamina cribrosa thickness differences in normal ten- sion glaucoma and primary open-angle glaucoma. Oph- thalmology 2012;119:10-20.
14. Lee EJ, Kim TW, Weinreb RN, et al. Visualization of the lami- na cribrosa using enhanced depth imaging spectral-domain op- tical coherence tomography. Am J Ophthalmol 2011;152:87-95.
15. Kim S, Sung KR, Lee JR, Lee KS. Evaluation of lamina cribrosa in pseudoexfoliation syndrome using spectral-do- main optical coherence tomography enhanced depth imag- ing. Ophthalmology 2013;120:1798-803.
16. Park SC, De Moraes CG, Teng CC, et al. Enhanced depth im- aging optical coherence tomography of deep optic nerve com- plex structures in glaucoma. Ophthalmology 2012;119:3-9.
17. Kim CS, Seong GJ, Lee NH, et al. Prevalence of primary open-angle glaucoma in central South Korea the Namil study. Ophthalmology 2011;118:1024-30.
18. Iwase A, Suzuki Y, Araie M, et al. The prevalence of primary open-angle glaucoma in Japanese: the Tajimi Study. Ophthal- mology 2004;111:1641-8.
19. Sung KR, Cho JW, Lee S, et al. Characteristics of visual field progression in medically treated normal-tension glau- coma patients with unstable ocular perfusion pressure. In- vest Ophthalmol Vis Sci 2011;52:737-43.
20. Sung KR, Lee S, Park SB, et al. Twenty-four hour ocular perfusion pressure fluctuation and risk of normal-tension glaucoma progression. Invest Ophthalmol Vis Sci 2009;50:
5266-74.
21. Sung KR, Sun JH, Na JH, et al. Progression detection ca- pability of macular thickness in advanced glaucomatous eyes. Ophthalmology 2012;119:308-13.
22. Na JH, Sung KR, Baek S, et al. Detection of glaucoma pro- gression by assessment of segmented macular thickness data obtained using spectral domain optical coherence to- mography. Invest Ophthalmol Vis Sci 2012;53:3817-26.
23. Cho JW, Sung KR, Lee S, et al. Relationship between visual field sensitivity and macular ganglion cell complex thick- ness as measured by spectral-domain optical coherence to- mography. Invest Ophthalmol Vis Sci 2010;51:6401-7.
24. Seong M, Sung KR, Choi EH, et al. Macular and peripapil- lary retinal nerve fiber layer measurements by spectral do-
main optical coherence tomography in normal-tension glaucoma. Invest Ophthalmol Vis Sci 2010;51:1446-52.
25. Na JH, Sung KR, Baek S, et al. Macular and retinal nerve fiber layer thickness: which is more helpful in the diagnosis of glaucoma? Invest Ophthalmol Vis Sci 2011;52:8094-101.
26. Um TW, Sung KR, Wollstein G, et al. Asymmetry in hemi- field macular thickness as an early indicator of glaucoma- tous change. Invest Ophthalmol Vis Sci 2012;53:1139-44.
27. Sung KR, Kim S, Lee Y, et al. Retinal nerve fiber layer normative classification by optical coherence tomography for prediction of future visual field loss. Invest Ophthalmol Vis Sci 2011;52:2634-9.
28. Quigley HA, Addicks EM. Regional differences in the struc- ture of the lamina cribrosa and their relation to glaucoma- tous optic nerve damage. Arch Ophthalmol 1981;99:137-43.
29. Radius RL, Gonzales M. Anatomy of the lamina cribrosa in human eyes. Arch Ophthalmol 1981;99:2159-62.
30. Jonas JB, Mardin CY, Schlotzer-Schrehardt U, Naumann GO. Morphometry of the human lamina cribrosa surface.
Invest Ophthalmol Vis Sci 1991;32:401-5.
31. Usui S, Ikuno Y, Akiba M, et al. Circadian changes in sub- foveal choroidal thickness and the relationship with circu- latory factors in healthy subjects. Invest Ophthalmol Vis Sci 2012;53:2300-7.
32. Toyokawa N, Kimura H, Fukomoto A, Kuroda S. Differ- ence in morning and evening choroidal thickness in Japa- nese subjects with no chorioretinal disease. Ophthalmic Surg Lasers Imaging 2012;43:109-14.
33. Tan CS, Ouyang Y, Ruiz H, Sadda SR. Diurnal variation of choroidal thickness in normal, healthy subjects measured by spectral domain optical coherence tomography. Invest Ophthalmol Vis Sci 2012;53:261-6.
34. Chakraborty R, Read SA, Collins MJ. Diurnal variations in axial length, choroidal thickness, intraocular pressure, and ocular biometrics. Invest Ophthalmol Vis Sci 2011;52:
5121-9.