560
JOURNAL OF KOREAN FOREST SOCIETY
ISSR 표지자를 이용한 느릅나무 자연집단의 유전변이 분석
안지영1·홍경낙1*·이제완1·양병훈2
1국립산림과학원 산림유전자원과, 2산림청 산림환경보호과
Population Genetic Variation of Ulmus davidiana var. japonica in South Korea Based on ISSR Markers
Ji Young Ahn
1, Kyung Nak Hong
1*, Jei Wan Lee
1and Byung Hoon Yang
21Division of Forest Genetic Resources, Korea Forest Research Institute, Suwon 441-847, Korea
2Forest Environment Conservation Division, Korea Forest Service, Daejeon 302-701, Korea
요 약: 국내의 느릅나무(Ulmus davidiana var. japonica) 집단에 대한 유전구조와 유전다양성을 분석하였다. 느릅나무 7개 자연집단, 171개체에 대하여 7개 ISSR 표지자를 이용하여 총45개의 다형적 증폭산물을 확인하였다. 유효대립인 자와 다형적 유전자좌 비율의 평균값은 1.5개와 89%이었다. Shannon의 다양성 지수(I)가 0.435, 빈도주의 방법에 의 한 이형접합도 기대치(He)는 0.289, 베이즈 추정에 의한 이형접합도 기대치(hs)가 0.323으로 나타났다. AMOVA 분석 에서 느릅나무 집단의 유전변이 중 4.2%가 집단간 차이(ΦST=0.042)에 기인하였으며, 95.8%를 집단내 개체들이 보유 하고 있었다. 베이즈 추정에 의한 집단간 유전분화율(θII)은 0.043으로 나타났다. 국내 느릅나무 집단의 유전다양성은 다른 느릅나무속 수종과 유사한 수준에 해당하였으나, 집단간 유전분화 정도는 매우 낮았다. 베이즈 근사추정에서 집 단별 고정지수(평균 PS-FIS=0.822)나 집단 특이적 유전분화율(평균 PS-FST=0.101)에서 유의할 만한 차이를 보이는 집 단은 없었다. 군집분석과 주성분분석에서 7개의 집단들을 3개 군집으로 나눌 수 있었으나, 두 방법의 군집 양상은 일치하지 않았다. 또한 베이즈 군집분석에서 집단간 유연관계와 지리적 분포의 상관성을 확인할 수 없었다.
Abstract: Population genetic structure and diversity of Ulmus davidiana var. japonica in South Korea were studied using ISSR markers. A total of 45 polymorphic ISSR amplicons were cropped from 7 ISSR primers and 171 individuals of 7 populations. The average of effective alleles and the proportion of polymorphic loci were 1.5 and 89% respectively. The Shannon’s diversity index (I) was 0.435 and the expected heterozygosity from the frequentist’s method (He) and the Bayesian inference (hs) were 0.289 and 0.323 respectively. From AMOVA, 4.2% of total genetic variation in the elm populations was explained with the difference among populations (ΦST=0.042) and the other 95.8% was distributed within populations. The θII value by Bayesian method which was comparable to the FST was 0.043. So the level of genetic diversity in the elm populations was similar to that in Genus Ulmus and the level of genetic differentiation was lower than that of others. No population showed a significant difference in the population-specific fixation indices (average of PS-FIS=0.822) or the population-specific genetic differentiations (average of PS-FST=0.101). Seven populations were allocated into 3 groups in the UPGMA and the PCA, but the grouping patterns were different. Also, we could not confirm any geographic trend from Bayesian clustering.
Key words : ulmus davidiana var. japonica, genetic diversity, genetic differentiation, ISSR marker, bayesian inference, AMOVA
서 론
느릅나무(Ulmus davidiana var. japonica)는 느릅나무과 (Ulmaceae)에 속하는 자웅동주의 낙엽활엽교목으로 3-4월 에 꽃이 피고, 4-5월에 시과가 익는다. 느릅나무과 수목들
은 바람에 의해 수분을 하고 주로 천연하종으로 갱신되는 데 맹아 번식도 가능하며, 2n=28의 염색체형을 갖는다. 세 계적으로 느릅나무 속에는 약 30수종이 알려져 있으며, 이 중 아시아지역에 20종이 분포하고 있으며 우리나라에는 7 수종이 보고되어있다(Kim, 1996). 느릅나무는 우리나라 전 역, 중국 북부, 일본 홋카이도와 큐슈에 분포하며, 해발고 100~1,200 m의 산기슭이나 골짜기의 습윤지에서 자란다.
*Corresponding author E-mail: [email protected]
국내 느릅나무 연구는 느릅나무과에 속하는 수종들에 대한 형태적 분류(Lee and Kim, 1985; Kim and Lee, 1989; Kim, 1996)나 한약재로 사용되는 줄기 및 뿌리껍질 에서 항암 및 항산화 성분 추출에 관한 기능성 물질탐색 이 이루어졌다(Lee et al., 2001; Lee K.H. et al., 2004;
Lee S.E. et al., 2004; Ahn and Park, 2010). 유럽과 미 국에서는 동위효소나 nSSR 표지자를 이용한 유전변이 분 석이 이루어졌으나(Sherman-Broyles et al., 1992; Machon et al., 1997; Zalapa et al., 2009; Zalapa et al., 2010;
Vakkari et al., 2009), 국내에서는 느릅나무 유전자원의 보 전을 위한 종자 특성 연구(Tak et al., 2006; Song et al., 2011)만 수행되었다.
ISSR(Inter-Simple Sequence Repeats) 표지자는 유전체 상에 널리 분포하고 변이 빈도도 높은 SSR(Simple sequence repeats) 부위를 이용하여 개발된 분자표지자로써 별도의 염기서열정보가 필요하지 않아 집단의 유전구조 분석에 쉽게 사용할 수 있다(Reddy et al., 2002). 그러나 중합효 소반응(PCR; Polymerase chain reaction)에서 우성의 표현 형을 나타내서 정확한 유전자형 정보를 확보할 수 없고, 근친교배 정도나 대립유전자 빈도의 추정에 제약이 있다 (Ouborg et al., 1999). 최근에는 우성표지자 분석에서 근 친교배 정도와 같은 사전정보가 없어도 유전모수의 근사 치를 추정할 수 있는 베이즈 추론 방법이 적용되고 있다 (Holsinger et al., 2002). 집단의 유전변이 분포양상 구명으 로 유효집단크기 추정이나 근친교배, 유전자 교류 등에 관 련된 유전모수를 계산하여 산림 유전자원의 보존 및 관리 에 필요한 정보를 구축할 수 있다(Hedrick, 2004).
약용자원으로 사용되는 대부분 식물 종들은 남획에 의 한 자생지 파괴와 개체 수 감소 등으로 인하여 현지내 집 단의 유전다양성 감소가 심각한 문제로 대두되고 있다 (Zhang et al., 2006). 우리나라 느릅나무도 줄기와 뿌리껍 질이 이용되는 대표적 약용자원으로 무분별한 채취로 인 한 자생지 파괴가 심각하여 보존대책 수립이 시급하다 (Song et al., 2011). 또한 식물종의 효과적인 유전자원 보 존을 위해서는 해당 자원에 대한 유전변이 분포 정보가 필수요건중 하나이다(Kramer and Havens, 2009). 본 연구 는 느릅나무 유전자원 보존을 위해 필요한 느릅나무 집단 의 유전다양성과 유전구조를 ISSR 표지들을 이용하여 파 악하고, 집단간 유연관계를 구명하고자 수행하였다.
재료 및 방법
1. 공시 재료
국내에 분포하는 느릅나무 7개 집단(Figure 1)에서 집단 별로 성목 20~30개체를 선정하고, 개체간 평균 50 m 간 격을 띄우고 잎사귀를 채취하였다. 채취한 엽 시료를 마
쇄한 후 DNeasy Plant Mini Kit(Qiagen, USA)를 이용하 여 total DNA를 추출하였다.
2. ISSR PCR
UBC ISSR 프라이머(UBC Primer Set No. 9, Biote- chnology Laboratory in University of British Columbia) 를 이용하여 재현성 검증 및 다형성 확인을 위한 예비 실 험을 수행하고, 7개 프라이머(UBC #807, #810, #811,
#812, #813, #814, #873)를 선정하여 느릅나무 집단의 유 전분석에 사용하였다. PCR 반응용액은 15 µL당 5 ng template DNA, 1×reaction buffer, 0.375 µM primer, 각 0.1 mM dNTPs, 2 mM MgCl2, 0.0025% BSA(Bovine serum albumin), 0.6Unit Taq DNA polymerase(KS-T0120, KisanBio, 한국)가 포함되도록 하였다. PCR 증폭은 94oC 에서 5분간 초기 변성과정 후에 94oC에서 30초, primer에 따라 50oC(UBC #807, #810, #812, #813, #814, #873) 및 52oC(UBC #811)에서 30초, 72oC에서 1분의 중합과정 을 45회 반복한 후 72oC에서 10분간 최종 증폭하였다. 증 폭산물은 2% agarose gel에서 전기영동하여 확인하였다.
300 bp에서 1,200 bp 범위 내에서 관찰된 증폭산물의 유 무에 따라 ‘1’과 ‘0’으로 분석자료를 입력하였다.
3. 통계분석
다형적 유전자좌 비율을 비롯한 유전통계량은 GeneAlEx 6.41 프로그램(Peakall and Smouse, 2006)을 이용하여 계 산하였다. 집단 간 유전분화 정도를 분석하기 위해 AMOVA(Analysis of molecular variance)를 수행하였고, Figure 1. Locations of 7 Ulmus davidiana var. japonica populations in South Korea.
지리적 거리와 유전적 거리의 상관성을 판단하기 위하여 Mantel 검정을 실시하였다. 베이즈 추론에 따라 집단 내 평 균 이형접합체 빈도(hs), 근친교배 정도와 집단간 유전적 분 화인 f와 θII값을 HICKORY v1.1 프로그램(Holsinger et al., 2002)을 사용하여 계산하였다. 베이즈 추론에 따른 각 집단별 FIS 및 FST 값을 구하기 위해 ABC4F 프로그램(Foll et al., 2008)을 사용하였다. Nei의 유전적 거리를 이용한 군집분석은 Phylip v1.1 프로그램(Felsenstein, 1993)을 이 용하였고, 베이즈 군집분석은 STRUCTURE v2.3 프로그 램(Pritchard et al., 2000)을 이용하였다.
결과 및 고찰
1. 느릅나무의 유전다양성
느릅나무 7개 집단을 대상으로 선정된 7개 ISSR 프라 이머를 이용하여 얻어진 다형적 증폭산물의 총 수는 45개 였다. 유효 대립유전자 수(Ne)는 평균 1.491개로 산청집단 이 1.526개로 가장 많았고 완주집단이 1.451개로 가장 적 었다. 다형적 유전자좌의 비율(P)은 평균 88.9%로 완주 집 단이 84.4%로 가장 낮았고 봉화와 정선 집단이 각 93.3%
로 가장 높게 나타났다. Shannon의 다양성 지수(I)의 평균 은 0.435, 이형접합도 기대치(He)의 평균은 0.289이었으며, 완주 집단(I=0.406, He=0.267)이 가장 낮고 영양 집단 (I=0.455, He=0.303)이 가장 높았다. 베이즈 추론에 의한 이형접합도 기대치(hs)의 평균은 0.323으로, 역시 완주 집 단(hs=0.314)이 가장 낮고 영양 집단(hs=0.335)이 가장 높 은 것으로 나타났다(Table 1).
베이즈 추론에서 집단별 고정지수가 평균 0.822로 매우 높게 나타났다(Table 2). 따라서 이형접합도 기대치 (He=0.289)에서 추정된 관측치의 평균 기댓값은 0.051로 매우 낮았다. 느릅나무가 종자 충실도가 비교적 낮고, 무 성번식에 의해서도 증식될 뿐 아니라(Tak et al., 2006;
Song et al., 2011) 느릅나무 속 수종들이 자가수분을 한다 는 보고(Hans, 1981)에서 유추하여 느릅나무 집단 내에 동 형접합체의 비율이 높게 나타날 가능성이 있을 것으로 생 각된다. 한편 우성표현형인 ISSR 표지자에 의한 유전자형 구명의 문제(Lynch and Milligan, 1994)나 베이즈 추론방 법의 한계(Holsinger, 2002)로 인한 고정지수의 불안정 추 정과 이형접합도의 과소치 발생도 배제할 수는 없다.
식물 종에 대한 동위효소와 RAPD 표지자를 사용한 연 구결과의 메타분석(Nybom and Bartish, 2000)에서 유전다 양성은 동위효소에 비해 RAPD 표지자가 비교적 높게 나 타났고, 우성표지자인 RAPD와 ISSR 표지자를 이용한 연 구결과에서 유전다양성은 두 표지자간 유사한 값을 나타 냈다. 우성인 ISSR 표지자와 공우성인 nSSR 표지자를 사 용한 연구결과의 메타분석(Nybom, 2004)에서는 ISSR 표 지자에 의해 추정된 유전다양성 평균값이 nSSR 표지자에 의해 추정값의 1/3정도로 낮게 나타났다. 즉, ISSR 표지자 에서 유전다양성 수치는 일반적으로 nSSR 표지자에 비해 적고, RAPD 표지자와 유사하며, 동위효소 표지자에 의한 추정 값 보다는 높다. 이러한 경향을 고려하면 우리나라 느릅나무의 유전다양성 수치(ISSR, He=0.289)는 느릅나 무속 수종들의 범위(동위효소, He=0.218~0.373; nSSR, He=0.400~0.490)와 크게 차이나지 않는 것으로 판단된다 (Table 3). 또한 우리나라의 참나무 속 수종에 대한 동위효 소 분석 결과(Kim et al., 1993)와 비교했을 때 상수리나무 (He=0.311)보다는 다소 낮지만, 갈참나무(He=0.299)나 신 갈나무(He=0.296) 등과 비슷한 수준의 유전다양성을 보유 하고 있는 것으로 생각된다.
2. 느릅나무 집단의 유전분화 및 유연관계
AMOVA 결과에서 느릅나무 집단에 분포하는 전체 유 전변이의 4.2%(ΦST=0.042)는 집단간 차이에 기인한 것이 며, 나머지 95.8%의 유전변이는 집단 내 개체 간 차이에 의한 것으로 나타났다(Table 4). Wright의 FST와 비교할 수 Table 1. Genetic diversity indices from 7 populations of Ulmus
davidiana var. japonica in South Korea using ISSR markers.
Population No of
samples Ne* %P(%) I He hs Sancheong 25 1.526 91.1 0.445 0.298 0.326 Wanju 24 1.451 84.4 0.406 0.267 0.314 Cheongdo 18 1.474 86.7 0.420 0.278 0.319 Danyang 26 1.458 86.7 0.419 0.276 0.315 Yeongyang 30 1.515 86.7 0.455 0.303 0.335 Bonghwa 23 1.512 93.3 0.455 0.302 0.327 Jeongseon 25 1.503 93.3 0.448 0.296 0.323 Mean 24.4 1.491 88.9 0.435 0.289 0.323
*Ne = number of effective alleles; %P = percentage of polymorphic loci; I = Shannon's information index; He = expected heterozygos- ity; hs = heterozygosity by Bayesian method
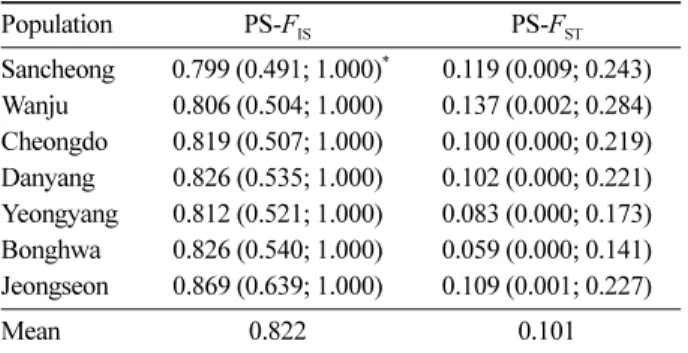
Table 2. Population-specific FIS and FST of 7 Ulmus davidiana var. japonica populations in South Korea by Approximate Bayesian method (Foll et al., 2008).
Population PS-FIS PS-FST
Sancheong 0.799 (0.491; 1.000)* 0.119 (0.009; 0.243) Wanju 0.806 (0.504; 1.000) 0.137 (0.002; 0.284) Cheongdo 0.819 (0.507; 1.000) 0.100 (0.000; 0.219) Danyang 0.826 (0.535; 1.000) 0.102 (0.000; 0.221) Yeongyang 0.812 (0.521; 1.000) 0.083 (0.000; 0.173) Bonghwa 0.826 (0.540; 1.000) 0.059 (0.000; 0.141) Jeongseon 0.869 (0.639; 1.000) 0.109 (0.001; 0.227)
Mean 0.822 0.101
*95% credible intervals in parenthesis
있는 베이즈 추론의 유전분화모수 θII는 0.043으로 추정되 었다(Table 5). 베이즈 추론의 모델 선택에서 집단내 근친 교배와 유전분화 발생을 가정한 Full 모델의 편차정보기 준(DIC=1376.27)이 최소로 계산되어서 최적 모델로 선정 하였다. Full 모델에서 입력자료의 정보량은 근친교배율(f;
IE=0.24)보다 유전분화모수(θII; IE=1.75) 추정에서 더 높게 나타나서 Full 모델이 유전분화모수 추정에 더 유용한 것 으로 판단된다. 베이즈 방법에 의한 각 집단별 FST값은 완 주 집단이 0.137로 가장 높은 집단 특이적인 분화 값을 보 였으며, 봉화 집단이 0.059로 가장 작은 값을 보이고 있으 나, 95% 신뢰구간에서 차이가 없어서 우리나라에서 유전 적으로 심하게 고립되었거나 독특한 자연선택(selection) 을 겪는 느릅나무 집단은 없는 것으로 판단되었다(Table 2).
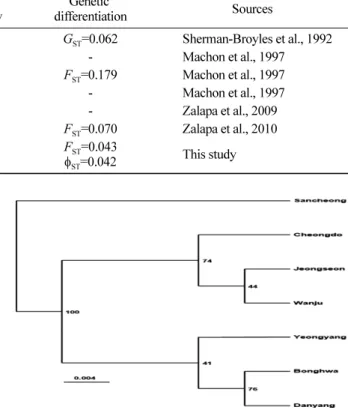
UPGMA 분석에서 산청 집단이 다른 집단들과 구분되 는 것으로 나타났고, 단양-봉화-영양 집단이 하나의 그룹 을 이루고 정선-완주-청도 집단이 다른 하나의 그룹을 이 루고 있다(Figure 2). 집단들 간 유전적 거리와 지리적 거 리의 상관관계를 Mantel 검정 한 결과 95%수준에서 통계
적으로 유의하지 않았으나(r=-0.333, P=0.062), 유전적 거 리를 기초로 주성분분석(PCA)을 수행한 결과 전체 변이 의 77.8%를 3개 주성분으로 설명할 수 있는 것으로 나타 났다(Figure 3; PC 1=38.5%, PC 2=20.5%, PC 3=18.8%).
7개 집단은 제1, 제2주성분의 분포도에서 3개 그룹으로 나 눌 수 있었는데(Figure 3), 위도 36도 이남의 산청 그룹, 36도선의 완주-청도 그룹, 37도 부근의 봉화 등 4집단이 속한 그룹으로 구분되었다. 특히 UPGMA와 PCA 방법간 에 정선 집단의 소속 그룹이 상이하게 나타났다.
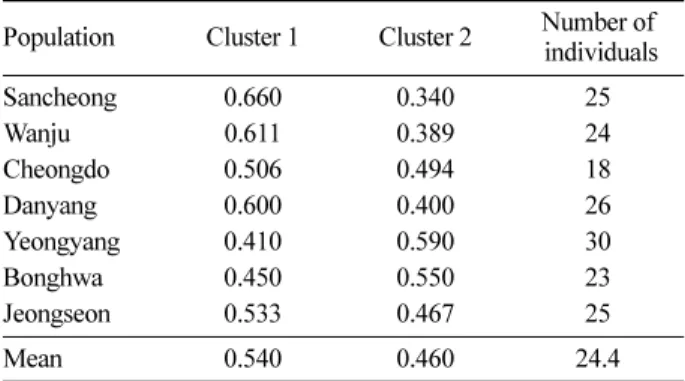
베이즈 추론에 근거하여 7개 집단들의 상위 구조를 Evanno et al.(2005) 방법으로 계산했을 때 최적 군집수(K) 는 2로 나타났으며, 개체들의 유전적 형상에 따른 군집별 할당 빈도는 모든 집단에서 큰 차이가 없었다(Table 6).
Table 3. Comparison of the genetic diversity and differentiation in Genus Ulmus.
Species Marker system Expected
heterozygosity
Genetic
differentiation Sources
U. classifolia Allozyme He=0.220 GST=0.062 Sherman-Broyles et al., 1992
U. glabra Allozyme He=0.373 - Machon et al., 1997
U. minor Allozyme He=0.342 FST=0.179 Machon et al., 1997
U. laevis Allozyme He=0.218 - Machon et al., 1997
U. rubra nSSR He=0.490 - Zalapa et al., 2009
U. pumilia nSSR He=0.400 FST=0.070 Zalapa et al., 2010
U. davidiana var. japonica ISSR He=0.289 FST=0.043
φST=0.042 This study
Table 4. Distribution of genetic variations in 7 Ulmus davidiana var. japonica populations in South Korea from Analysis of Molecular Variance.
Source of
variation d.f. Sum of squares
Variance components
Percentage of variance Among populations 6 90.343 0.321 4.2%
Within populations 164 1187.902 7.243 95.8%
Total 170 1278.246 7.564 100.0%
Table 5. Mean, standard deviation(SD) and 95% credible intervals(CI) of inbreeding coefficient (f) and the level of population differentiation (θII) for ISSR data in 7 Ulmus davidiana var. japonica populations in South Korea by Bayesian method (Holsinger et al., 2002).
Model f II
Mean SD 95% CI Mean SD 95% CI DIC
Full 0.688 0.249 0.063, 0.988 0.043 0.008 0.027, 0.059 1376.3
f = 0 - - - 0.029 0.005 0.020, 0.040 1390.4
θ = 0 0.866 0.112 0.591, 0.996 - - - 1553.7
f = free 0.494 0.285 0.027, 0.973 0.072 0.019 0.044, 0.117 1498.1
Figure 2. Dendrogram by UPGMA method of 7 Ulmus davidiana var. japonica populations based on ISSR marker analysis. The bootstrap values are on the nodes.
STRUCTURE 프로그램(Pritchard et al., 2000)에 식재된 베이즈 추론은 메타집단의 지리적 위치를 반영하지 않기 때문에 근거리 집단이 다른 군집으로 또는 원격지 집단이 동일 군집에 속할 수 있으며, 이러한 경우에 생물학적 해 석에 어려움이 있다. 본 연구의 2개 군집으로는 느릅나무 집단들의 지리적 분포와 유연관계를 설명할 수 없었으며, 언급한 Mantel 검정 결과에서도 확인된 이러한 불일치는 군집수를 증가시켜서도 개선할 수 없었다(data not shown).
일반적으로 식물 종에서 유전분화정도는 동위효소와 RAPD 표지자간 유사하였으며, 우성표지자인 RAPD와 ISSR 표지자를 이용한 연구에서는 유전분화 수치가 유사 하거나 ISSR 표지자가 약간 높은 것으로 나타났다(Nybom and Bartish, 2000). 또한 ISSR 표지자의 유전분화정도 평 균값이 nSSR 표지자에 비해 높았으나, 다른 표지자들과 의 차이에 비하여 적은 것으로 나타났다(Nybom, 2004).
따라서 ISSR 표지자를 이용했을 경우에 유전분화정도가 일반적으로 크게 추정될 수 있다. 그러나 ISSR 표지자를 이용한 국내 느릅나무 집단간 유전분화정도는 ΦST=0.042 와 θII=0.043로 나타난 것에 비해 동위효소와 nSSR 표지 자를 사용한 느릅나무속 수종들의 집단간 유전분화정도 (GST)는 0.062 이상으로 나타나서, 표지자가 다른 것을 감 안하더라도, 느릅나무는 다른 느릅나무 속 수종들에 비해 유전분화가 적은 것으로 판단되었다. 유사한 낙엽활엽교 목 수종들과 비교해 보면 느릅나무의 유전분화 정도는 신 갈나무(FST=0.023, 동위효소; Potenko et al., 2007), 떡갈 나무(FST=0.018, 동위효소; Potenko et al., 2007)에 비해 크고 굴참나무(ΦST=0.048, RAPD; Song et al., 2002)와 유사한 결과를 나타내었으며 층층나무(FST=0.077, 동위효 소; Jang et al., 2003), 들메나무(ΦST=0.10, ISSR; Cho et al., 2002), 노각나무(ΦST=0.118, ISSR; Yang et al., 2006) 에 비해 느릅나무의 유전분화정도는 작은 것으로 나타났 다. 표지자가 다른 것을 감안하더라도 국내 느릅나무의 유 전분화정도는 참나무류 수종들과 유사한 유전분화정도를 갖고 있으며, 다른 낙엽활엽교목 수종들에 비해서는 작은 것으로 나타났다(Table 3). 유전다양성과 유전분화정도는 대상 종의 생활사 및 교배양식과 관계가 있는 것으로 나 타난 바 있고(Nybom and Bartish, 2000), 대부분의 임목 수종과 같이 다년생의 생활사를 갖고 풍매에 의한 타가교 배가 주를 이루어지는 경우 유전다양성이 높고 유전분화 정도는 작았다(Nybom, 2004). 느릅나무도 풍매수종으로 유·무성 번식을 겸하기 때문에 다른 임목수종들과 유사 한 유전변이 분포특성을 보이고 있는 것으로 판단된다.
인용문헌
Ahn, J.J. and Park, J.H. 2010. Antioxidant activity and pro- tective effect on DNA damage of extracts from Ulmus davidiana var japonica. The Journal of Applied Oriental Medicine 10(2): 9-16.
Cho, K.J., Jung, J.M., Kim, W.W., Kim Y.M., and Hong, Y.P.
2002. Genetic variation of populations of Fraxinus mandshu- rica Rupr. in korea (Oleaceae) based on I-SSR marker analy- sis. Proceedings of Korean Forest Society. pp. 114-115.
Evanno, G., Reanaut, S., and Goudet, J. 2005. Detecting the num- ber of clusters of individuals using the software STRUC- TURE: a simulation study. Molecular Ecology 14: 2611-2620.
Felsenstein, J. 1993. PHYLIP (Phylogeny Inference Pakage) ver- sion 3.5c. Distributed by the author. Department of Genetics. University of Washington. Seattle, WA. USA.
Foll, M., Beaumont, M.A., and Gaggiotti, O. 2008. An Approximate Bayesian Computation Approach to over- come biases that arise when using amplified fragment length polymorphism markers to study population struc- ture. Genetics 179: 927-939.
Figure 3. Scatter plot of principal components of 7 Ulmus davidiana var. japonica populations in South Korea. The PC 1 as the x-axis and the PC 2 as the y-axis explained 38.5%
and 20.5% of genetic variance respectively.
Table 6. Allocation proportions of the populations assumed with two optimal clusters from Bayesian clustering by STRUCTURE (Pritchard et al., 2000).
Population Cluster 1 Cluster 2 Number of individuals
Sancheong 0.660 0.340 25
Wanju 0.611 0.389 24
Cheongdo 0.506 0.494 18
Danyang 0.600 0.400 26
Yeongyang 0.410 0.590 30
Bonghwa 0.450 0.550 23
Jeongseon 0.533 0.467 25
Mean 0.540 0.460 24.4
Hans, A.S. 1981. Compatibility and crossbility studies in Ulmus.
Silvae Genetica 30(4-5): 149-152.
Lynch, M., and Milligan, B. 1994. Analysis of population genetic structure using RAPD markers. Molecular Ecol- ogy 3: 91-99.
Hedrick, P.W. 2004. Recent development in conservation genetics. Forest Ecology and Management 197: 3-19.
Holsinger, K.E., Lewis, P.O., and Dey, D.K. 2002. A Bayesian approach to inferring population structure from dominant markers. Molecular Ecology 11: 1157-1164.
Jang, S.S., Lee, S.W., Kim, C.S., Kim, Y.M., and Kim, H.E.
2003. Genetic diversity and structure of natural popula- tions of Cornus controversa in south korea. Journal of Korean Forestry Society 92(1): 42-51.
Kim, M.Y. and Lee, S.T. 1989. Taxonomical study of the Korean Ulmaceae. Korean Journal of Taxonomy 19(1): 31-78.
Kim, M.Y. 1996. A Taxonomic study of the Korean Ulmaceae based on morphological characters. Korean Journal of Taxonomy 6(3): 163-181.
Kim, Z.S., Lee, S.W., and Hyun, J.O. 1993. Allozyme varia- tion in six native oak species in Korea. Annals Forest Science 50: 253s-260s.
Kramer, A. and Havens, K. 2009. Plant conservation genetics in a changing world. Trends in Plant Science 14(1): 599- 607.
Lee, K.H., Cho, C.H., and Yoon, W.H. 2004. In vivo antitu- mor activity of Mansonone E isolated from Ulmus davidi- ana var. japonica Nakai. Korean Journal of Pharmacognosy 35(3): 199-202.
Lee, M.K., Sung, S.H., Lee, H.S., Cho, J.H., and Kim, Y.C.
2001. Lignan and neolignan glycosides from Ulmus davidi- ana var. japonica. Archives of Pharmacal Research 24(3):
198-201.
Lee, S.E., Kim, Y.S., Kim, J.E., Bang, J.K., and Seong, N.S.
2004. Antioxidant activity of Ulmus davidiana var. japon- ica N. and Hemipteleae davidii P. Korean Journal of Medicinal Crop Science 12(4): 321-327.
Lee, S.T and Kim, M.Y. 1985. A palynotaxonomy study of Korean Ulmaceae. Korean Journal of Plant Taxonomy 15(3):
163-174.
Machon, N., Lefranc, M., Bilger, I. Mazer, S.J., and Sarr, A.
1997. Allozyme variation in Ulmus species from France:
analysis of differentiation. Heredity 78: 12-20.
Nybom, H. 2004. Comparison of different nuclear DNA markers for estimating intraspecific genetic diversity in plants. Molecular Ecology 13: 1143-1155.
Nybom, H. and Bartish, I.V. 2000. Effects of life history traits and sampling strategies on genetic diversity esti- mates obtained with RAPD markers in plants. Evolution and Systematics 3(2): 93-114.
Oubborg, N.J., Piquot, Y., and Groenendael, J.M.V. 1999.
Population genetics, molecular markers and the study of
dispersal in plants. Journal of Ecology 87: 551-568.
Peakall, R. and Smouse, P.E. 2006. GENEALEX 6: genetic anal- ysis in Excel. population genetic software for teaching and research. Molecular Ecology Notes 6: 288-295.
Potenko, V.V., Koren, O.G., and Verkholat, V.P. 2007. Genetic variation and differentiation in populations of Japanese emperor oak (Quercus dentata Thunb.) and Mongolian oak (Quercus mongolica Fisch. ex Ledeb.) in the south of the Russian far east. Russian Journal of Genetics 43(4):
387-395.
Pritchard, J.K., Stephens, M., and Donnelly, P. 2000. Inference of population structure using multilocus genotype data.
Genetics 155: 945-959.
Reddy, M.P., Sarla, N., and Siddiq, E.A. 2002. Inter simple sequence repeat (ISSR) polymorphism and its application in plant breeding. Euphytica 128: 9-17.
Sherman-Broyles, S.L., Broyles, S.B., and Hamrick, J.L.
1992. Geographic distribution of allozyme variation in Ulmus crassifolia. Systematic Botany 17(1): 33-41.
Song, J.H., Kim, N.S., Yi, Y.S., Kim, Y.J., Song, J.M., and Lee, J.S. 2002. Genetic variation of Quercus variabilis in Korea based on RAPD marker analysis. Korean Journal of Genetics 24(2): 189-195.
Song, J.H., Jang, K.H., Lim, H.I., Park, W.G., and Bae. K.H.
2011. Variation of samara, seed, germination and growth characteristcs of Ulmus davidiana var. japonica Nakai popu- lations. Journal of Korean Forestry Society 100(2): 226-231.
Tak, W.S., Choi, C.H., and Kim, T.S. 2006. Change in the seed characteristics and germination properties of Ulmus david- iana var. japonica according to seed collection time. Jour- nal of Korean Forestry Society 95(3): 316-322.
Vakkari, P., Mari, R., and Karkkainen, K. 2009. High genetic dif- frentiation in marginal populations of European white elm (Ulmus laevis). Silva Fennica 43(2): 185-196.
Yang, B.H., Han, S.D., Gu, Y.B., and Park, Y.G., 2006. Genetic Variation in the Natural Populations of Korean Stewartia (Stewartia koreana Nakai) Based on I-SSR Analysis. Journal of Korean Plant Resources Society 19(1): 189-195.
Zalapa, J.E., Brunet, J., and Guries, R.P. 2009. Patterns of hybrid- ization and introgression between invasive Ulmus pumila (Ulmaceae) and native Ulmus rubra. American Journal of Botany 96(6): 1116-1128.
Zalapa, J.E., Brunet, J., and Guries, R.P. 2010. The extent of hybridization and its impact on the genetic diversity and population structure of an invasive tree, Ulmus pumila (Ulmaceae). Evolutionary Applications 3(2): 157-168.
Zhang, X.P., Li, X.H., and Qiu, Y.X. 2006. Genetic diversity of the endangered species Kirengeshoma palmata (Saxifragaceae) in China. Biochemical Systematics and Ecology 34: 38- 47.
(2013년 8월 5일 접수; 2013년 9월 26일 채택)