309
JOURNALOF KOREAN FOREST SOCIETY ISSN 0445-4650(Print), ISSN 2289-0904(Online) http://e-journal.kfs21.or.kr
AFLP 마커를 이용한 소규모 사시나무림의 공간적 유전구조 구명
이민우 · 홍경낙* · 박유진 · 이제완 · 임효인
국립산림과학원 산림유전자원과
Fine-scale Spatial Genetic Structure of a Small Natural Stand of Populus davidiana in South Korea using AFLP markers
Min Woo Lee, Kyung Nak Hong
*, Yu Jin Park, Jei Wan Lee and Hyo In Lim
Forest Genetic Resources Division, National Institute of Forest Science, Suwon 16631, Korea요 약: 변화하는 자연환경에서 식물이 생존하기 위해서는 적절한 유전다양성을 유지할 뿐 아니라 지역적응성을 갖 추어야 세대를 성공적으로 이어나갈 수 있다. 만약 유전다양성이 급격히 감소하게 된다면 집단이 쇠퇴하고 소멸 위 험성이 커지게 된다. 본 연구는 주변 집단으로 부터 화분이나 종자의 유입이 어려운 소규모 사시나무 집단의 유전 구조를 구명하였다. 월악산 미륵리의 사시나무림은 전체 분포면적 14,000 m
2에 성목은 350개체로 추정되며, 임분내 에 설정한 70 m×70 m 조사구에 출현하는 123개체 중 61개체를 대상으로 AFLP 마커를 이용하여 유전변이를 분석 하였다. 조사구내 사시나무의 수령은 평균 16년 최고 32년생이었으며, 개체의 공간적 분포는 약한 밀집 형태를 이루 고 있었다. AFLP primer 6조합에서 196개 증폭산물을 확인하였으며, 이 중 151개는 다형성을 보였다. primer 조합당 평균 유전자좌수는 32.7(표준편차=7.2), 이형접합도 기대치(H
e) 는 0.154, Shannon의 다양성 지수(S.I.)는 0.254로 나타 나서, 월악산 사시나무는 우리나라 사시나무 집단 평균에 비하여 매우 낮은 유전다양성을 갖고 있는 것으로 나타났 다. 공간적 유전구조는 24 m 이내에서 분포하는 개체들 간에 유전적 유사성이 나타났으며, 소규모 면적과 고립된 분 포지 특성으로 인하여 비교적 작은 유전군락이 형성된 것으로 생각된다.
Abstract: A locally adapted plant population under harsh environmental changes might survive for a long generation through maintaining proper level of genetic diversity. When it happens losing the genetic diversity too much fast, the population could be declining and probably become extinct. An isolated small population of Populus davidiana was investigated to study out the genetic diversity and the fine-scale spatial genetic structure.
The estimated number of adult trees in the population of Mt. Worak, South Korea, was 350 in the total area of 14,000 m2. The number of adults in a study plot (70 m×70 m) was 123. The average age was 16-year-old and a 32-year-old tree was the oldest. The distribution of individuals was slightly aggregated in the plot. Sixty- one among the 123 individuals were randomly sampled to estimate genetic variation using AFLP markers. One hundred fifty-one (77%) of total 196 amplicons were polymorphic from six AFLP primer combinations. The average number of loci per primer combination was 32.7 (S.D.=7.2). Expected heterozygosity (He) and Shannon’s diversity index (S.I.) were 0.154 and 0.254, respectively. These values were extremely lower than those of other P. davidiana populations in South Korea. Genetic patchiness was showed within 21 meters by spatial autocorrelation analysis and the isolated small size of population might be mainly attributed to the formation of such small patch size.
Key words: Populus davidiana, genetic diversity, spatial genetic structure, AFLP, genetic patch, spatial autocorrelation
서 론
자연재해, 환경오염, 인위적 피해 등 변화하는 자연환경 에서 식물이 살아남기 위해서는 적절한 유전다양성을 유지 하고, 지역적응성(local adaption)을 통하여 개체의 생존과
세대를 이어나갈 수 있어야 한다. 예측하기 어려운 자연환 경 변화에서 집단의 유전다양성이 감소를 보이게 된다면 그 집단은 쇠퇴하고 소멸 위험성이 커지게 된다(Lande and Shannon, 1996). 소규모의 고립된 집단은 해당 환경에는 잘 적응했다고 할 수 있으나, 환경변화에 취약하고 근친교배 로 인한 유전다양성의 감소 위험이 있기 때문에 장기적으 로 생존하기 어려울 수 있다(Leimu and Fischer, 2008).
*Corresponding author
E-mail: [email protected]
사시나무(Populus davidiana)는 사시나무속 Leuce 절의 Trepidae 아절에 속해 있고(Cervera et al., 2005), 수고 20 m, 지름 1 m까지 자라는 낙엽활엽 교목으로 꽃은 4월 에 암수딴그루로 피며, 종자는 5월경에 성숙한다. 껍질은 한약재(Choi et al., 2013), 목재는 가구재로 쓰인다(Kim, 2009). 극동러시아, 중국, 일본에 분포하고 있으며, 북한에 는 함경남북도, 평안남도, 남한에서는 태백산을 중심으로 해발 400 m - 600 m에 자생하는 수종이고, 최남단 분포지 는 대구의 팔공산으로 알려져 있다(Noh et al., 1994). 대 부분 순림을 이루지만 강원도에서는 산발적으로 숲 가장 자리에서 단목으로 발견되기도 한다(Chang et al., 2011).
사시나무속 수종들은 번식이 쉽고 생장이 빠르며, 유전 체의 크기가 작은 특징 때문에 임목유전학의 모델 수종으 로 이용되고 있다(Bradshaw et al., 2000). 우리나라의 사 시나무에 대한 연구는 1981년 하천법 개정에 따라서 포플 러류를 하천부지에 식재할 수 없게 되고 이로 인한 포플 러재의 공급부족을 우려하여 본격적으로 시작 되었다(Noh et al., 1994). 사시나무속 수종의 집단유전학적 연구는 일본 의 일본사시나무(P. sieboldii)의 유전다양성 구명(Ueno et al., 2009), 유럽의 P. tremula와 은백양(P. alba) 집단간 amplified fragment length polymorphism(AFLP)와 microsatellite 마커 를 이용한 유전자이입 분석이 있다(Fossati et al., 2004).
우리나라 사시나무 집단의 유전다양성 연구로는 randomly amplified polymorphic DNA(RAPD) 마커를 이용하거나 (Hong, 1997), microsatellite 마커를 이용하여 사시나무 집 단 간 유전분화율 추정과 유전구조 분석이 이루어졌다(Lee et al., 2011). 그러나 집단내 개체의 공간적 분포나 유전군 락 형성에 대한 연구는 미흡한 실정이다(Shin et al., 2014).
AFLP는 우성마커로써 정확한 이형접합도를 확인하는 데 한계가 있고 순도 높은 template DNA와 염기서열분석 기를 사용해야 하는 등 비교적 높은 실험기술을 필요로 한다(Mba and Tohme, 2005). 그러나 다른 우성마커에 비 하여 재현성이 우수하고 많은 다형성 표지자를 확보할 수 있기 때문에 집단의 유전 분화나 클론 번식과(clonality) 같 은 유전구조의 분석뿐 아니라 종과 품종의 식별, 계통유 전학 연구 등에 광범위하게 사용되고 있다(Meudt and Clarke, 2007).
본 연구는 AFLP 마커를 이용하여 주변 집단으로부터 고립되어 소규모로 존재하는 월악산 사시나무 집단의 유 전다양성을 측정하고 개체들의 공간분포 특성에 따른 유 전구조를 구명하기 위하여 수행하였다.
재료 및 방법
1. 조사지 현황 및 시료 채취
본 연구의 조사지는 1976년 조성된 국립산림품종관리
센터의 일본잎갈나무 채종원(충북 충주시 수안보면 미륵 리 산31-3번지)내에 동서방향 폭 70 m, 남북방향 길이 200 m 정도의 띠모양으로 남아있는 사시나무, 신갈나무, 굴참 나무의 혼효림(위도 36°50′ 42.9″ 및 경도 128°04′ 12.6″) 이다. 월악산 일대에 대한 기존의 다양한 산림식생 연구 에서 사시나무의 존재에 대한 보고를 찾을 수가 없으며 (Lee et al., 2015a; Lee et al., 2015b; Kang et al., 2013;
Jang et al., 2015) 본 연구에서도 다른 사시나무 임분을 확 인할 수 없었다. 2009년 6월 조사지 중앙에 70 m×70 m 방형구를 설치하고, 흉고직경 6 cm 이상 사시나무의 수고, 지하고, 흉고직경을 측정하고, 이중 일부에 대하여 생장추 를 이용해 수령을 측정하였다. 유전변이 분석을 위한 잎 사귀 시료를 채취하고, 잎사귀 채취가 어려운 경우에는 수 피 시료를 채취하여 사용시까지 냉동 보관하였다.
2. AFLP 마커 분석
사시나무 시료를 마쇄하고 DNeasy Plant Mini Kit (Qiagen, Venlo, Netherlands)를 이용하여 genomic DNA 를 추출하였다. AFLP 표지자 분석은 Vos et al.(1995) 방 법을 형광 발색시약의 사용을 위해 일부 변형하고(Hong et al., 2015), hot-start PCR 방법을 사용하였다. genomic DNA 0.5 μg에 10 unit의 EcoRI 및 MseI 제한효소(New England BioLabs, Ipswich, MA, USA)가 처리된 25 μL 반응액을 37oC에서 2 시간 정치하였다. 5 μL의 반응액을 5 pmole의 EcoRI adaptor, 50 pmole의 MseI adaptor (Applied Biosystems, Foster, CA, USA)와 100 units의 T4 DNA ligase(New England BioLabs, Ipswich, MA, USA)가 포함된 15 μL의 ligation 용액에 넣고, 37oC에서 3 시간 정치한 후에 증류수로 10배 희석하였다. 1차 PCR 증폭(preselective amplification)을 위하여 희석된 3 μL의 ligation 용액과 각 1 pmol의 MseI+C 및 EcoRI+A prese- lective primers(Applied Biosystems, Foster, CA, USA), 각각 0.2 mM의 dNTPs, 2 mM MgCl2과 1 unit의 Taq DNA polymerase(HotStarTaq; Qiagen, Hilden, German) 을 혼합하여 10 μL의 PCR 반응용액을 조제했다. PCR 실 행 조건은 95oC에서 15분간 초기 반응 후, 각 증폭단계에 서 ramp time을 1초씩 증가시키면서 94oC 30초, 56oC 1분, 72oC 1분간씩 20회를 반복하였다. 1차 증폭용액을 증 류수로 10배 희석하여 2차 증폭(selective amplification)에 사용하였다. 3 μL 희석액과 형광 표지된 2.5 pmol의 MseI- primer 및 0.5 pmol의 EcoRI-primer (Applied Biosystems, Foster, CA, USA) 조합, 각각 0.2 mM dNTPs, 2 mM MgCl2, 1 unit의 Taq DNA polymerase (HotStarTaq; Qiagen, Hilden, German)를 혼합하여 11 μL의 2차 PCR 반응용액 을 조제했는데, selective-primer 조합은 7개를 사용하였다 (Table 1). 2차 PCR 실행은 2가지 증폭조건을 이어서 수행
하였다. 우선 95oC에서 15분간 초기 반응 후, 각 증폭단계 에서 ramp time은 1초씩 증가, extension 온도는 1.0oC씩 감소시키면서 94oC 30초, 65oC 30초, 72oC 1분간씩 10회 를 반복하였다. 다시 94oC 30초, 56oC 30초, 72oC 1분간 씩 30회를 반복하고, 72oC에서 30분간 최종 증폭시켰다.
최종 증폭용액 1 μL을 9.7 μL의 deionized formamide, 0.3 μL의 GeneScan 500 ROX dye size standard와 섞어 서 95oC에서 5분간 열변성(denaturation)하고, 얼음에 10분 간 정치한 후 4oC에 보관하였다. ABI 3130xl Genetic Analyzer (Applied Biosystems, Foster, CA, USA)를 이용 하여 전기영동을 수행하고, GeneMapper version 4.0 (Applied Biosystems, Foster, CA, USA) 프로그램에서 증 폭산물을 수확하였다.
AFLP 유전자좌 결정은 오류율을 최소화하기 위하여 형 광반응도(peak height threshold)를 높게 잡아서(rfu≥100;
relative fluorescence unit) 전체 개체들에서 균일한 중복 양 상을 보이는 증폭산물을 선정하고(Whitlock et al., 2008), 일 정한 크기의 증폭산물(100-350 bp)을 수확하여 작은 증폭 산물에서 나타나는 임의 변동과 큰 증폭산물에서의 homoplasy 기회를 줄이고자 하였다(Vekemans et al., 2002).
3. 통계분석
유전다양성 지수 등 유전통계량 추정과 공간적 자기상 관분석은 GeneAlEx 6.41 프로그램(Peakall and Smouse, 2006)을 이용하였다. 개체 위치정보와 Smouse & Peakall (1999)의 유전적 거리를 이용한 공간적 자기상관분석을 실 시하였는데 거리등급(distance class)은 6 m 간격으로 12개 등급으로 나눴고, 각 등급에서 999회의 permutation을 실 시하여 95% 신뢰구간을 산출하고 유의성을 검증하였다.
결과 및 고찰
1. 월악산 미륵리 사시나무 생육상태
월악산 사시나무림의 조사구 4,900 m2(70 m×70 m) 내
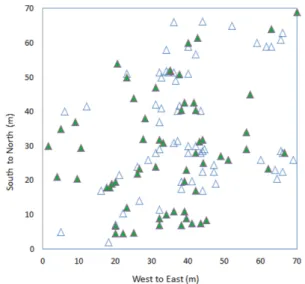
에 123개체가 분포하는데 최근접 개체간의 평균 거리는 2.5 m이며, 조사구 단위면적당 사시나무의 밀도는 0.025 로 전체 임분(14,000 m2)에는 350개체가 분포하는 것으로 추정된다(Figuer 1). 조사구내 수고와 지하고 평균은 각각 18 m와 12 m였다. 생장추를 이용하여 확인된 집단의 흉 고직경(diameter at breast height: DBH)은 6 cm일 때 나 이는 8년생, 제일 굵은 개체인 25 cm 일 때 32년생으로 측정되었다. 123개체의 평균 흉고직경은 12.7 cm로 평균 나이는 16년이었다.
2. 유전다양성
사시나무 61개체에 대하여 AFLP primer 6조합에서 196 개 증폭산물을 확인하였다. 이들 증폭산물중 151개는 다 형성(polymorphic band)을 나타내었고, primer 조합당 평 균 유전자좌수는 32.7(표준편차=7.2)이다. 유전다양성을 추정한 결과, 다형적 유전자좌 비율(P)은 83.4%, 이형접 합도 기대치(He)는 0.154(표준편차=0.013), Shannon의 다 양성 지수(S.I.)는 0.254(표준편차=0.018)로 나타났다. 근 접한 거리에 동일한 유전자형을 갖고 있어서 근맹아 번식 으로 추정되는 2개체는 잠정적으로 클론(putative clone)으 로 판정하였다. 동일한 종의 유전다양성을 비교하는 연구 에서 집단의 다양성 수치가 AFLP 보다 microsatellite 마 커에서 2배 정도 높게 나타나는 경향(Mariette et al., 2001; Nybom, 2004)을 고려하여도, microsatellite 마커를 이용한 국내의 사시나무 집단의 평균 이형접합도 기대치 (He=0.603, Lee et al., 2011)와 비교할 때 월악산 사시나무 가 다른 지역의 사시나무 유전변이량보다 적음을 알 수 있었다. 다른 사시나무속 수종들에서 microsatellite 마커의
Table 1. Number of AFLP amplicons per primer combination
for Populus davidiana.
Primer combination
Total number of amplified
bands
Number of polymorphic
bands
Polymorphic rate (%)
E-AAC+M-CTA
*23 13 56.5
E-ACA+M-CTA 33 28 84.8
E-AAC+M-CTT 34 25 73.5
E-AAC+M-CAC 32 25 78.1
E-AAG+M-CTT 45 35 77.7
E-ACG+M-CTA 89 25 28.1
Total 196 151 66.4
*Restriction enzyme E- and M- are EcoRI and MseI, respectively.
Figure 1. Spatial distribution of Populus davidiana individuals at
the study plot in Mt. Worak, South Korea. The triangles
showed poplars with the diameter of breast height (DBH)
over 6 cm. The filled ones were the sampled individuals for
genetic analysis.
이형접합도 기대치는 중국의 중국황철 0.802(P. cathayana, Peng et al., 2005), 국내의 황철나무 0.707(P. maximowiczii, Lee et al., 2009), 독일의 흑양 0.73(P. nigra, Rathmacher et al., 2009)으로 국내 사시나무(0.603, Lee et al., 2011) 와 비슷한 수준임을 감안하면, 월악산 사시나무가 이례적 으로 낮은 이형접합도 기대치를 보이는 것으로 판단된다.
사시나무는 높은 산 정상을 제외하고 다양한 환경에서 생장이 가능하며, 적응력이 강한 수종으로 알려져 있다 (Noh et al., 1989). 월악산 일대에 산림식생에 관한 연구 에서 사시나무 집단의 존재에 대해서는 보고된 바가 없는 데(Lee et al., 2015a; Lee et al., 2015b; Kang et al., 2013;
Jang et al., 2015), 본 연구에서는 1976년에 조성된 월악산 미륵리 채종원 260,000 m2(Han et al., 2007)의 낙엽송 조 림지 부근 14,000 m2의 면적에서 사시나무 집단을 확인하 였다. 이 지역의 산림식생에 관한 여러 연구에서 사시나 무 집단에 대해서 보고된 바가 없지만 사시나무의 수령 (최고 32년생)을 고려했을 때 채종원 조성 당시 또는 이전 부터 소규모로 분포하였을 가능성이 높다. 사시나무림 형 성 초기에 정착한 소수의 개체에서 비롯된 적은 유전변이 량으로 인한 창시자효과(founder effect, Booy et al., 2000)와 더불어, 조사 집단은 암석에 둘러싸인 비교적 깊 은 계곡 지역의 고립된 환경으로 유전자 이입이 낮은 상 태에서 채종원이 조성되면서 면적이 더욱 축소되어 유전 다양성 감소가 더욱 심화되었을 것으로 추측된다.
유전다양성은 번식특성, 교배양식, 종 진화의 역사, 환 경적 이질성(environmental heterogeneity)등 여러 인자의 영향을 받는다(Booy et al., 2000; Hedrick and Kalinowski, 2000). 낮은 유전다양성이 확인되는 집단은 생장률, 번식 력이 감소하고 근친교배로 인한 생장력 약화를 보일 가능 성이 있으며, 집단의 적응력이 낮아질 수 있다(Reed and Frankham, 2003). 특히, 소규모 집단의 경우 근친교배와 유전적부동이 증가하게 되고 유전다양성이 감소하여 환 경변화에 적응하지 못하고 쇠퇴할 우려가 크다(Ellstrand and Elam, 1993). 월악산 사시나무 집단은 채종원 조성으 로 인해 암석으로 둘러싸인 계곡 지역의 고립된 환경에서 소규모로 분포하고 있으며, 국내 타 지역 사시나무 집단 들 보다 낮은 유전다양성을 보이고 있기 때문에 소실될 가능성이 큰 것으로 판단된다.
3. 공간적 유전구조
조사구내 123개체에서 Clark and Evans(1954)의 군집지 수(aggregation index: R)를 계산했는데, 군집지수에 따라 서 개체의 분포형태는 밀집형(R<1), 임의형(R=1), 정규형 (R>1)으로 구분할 수 있다(Ripley 1981). 월악산 사시나무 림의 군집지수는 0.828로 개체들이 약한 밀집 형태를 이 루고 있었다(P<0.05). 유전변이 분석에 이용된 61개체의
평균 흉고직경은 12.5 cm, 개체간의 평균 거리가 3.5 m로 나타났다. 군집지수(R)는 0.823(P<0.05)으로 조사구 전체 123개체와 비슷한 밀집도와 생육 상태를 보이고 있어서 유전변이 분석에 이용된 61개체의 분포 특성이 월악산 사 시나무림의 대표성을 갖는 것으로 판단된다.
개체의 유전변이에 대한 공간적 자기상관성(spatial autocorrelation) 분석 결과, 조사지역내의 사시나무는 약 24 m 이내에서 분포하는 개체들 간에는 유전적 유사성이 있으며, 24 m에서 48 m 범위 내에서 임의 분포, 48 m 이 외에는 유전적으로 상이한 개체가 분포하는 것으로 나타 났다(Figure 2). 그러나 각 개체간 공간적 거리와 유전적 거리(genetic distance)에는 상관성이 없었다(Mantel r=0.193, P>0.01). 오대산 물황철나무(P. koreana)는 월악 산 사시나무와 비슷한 수준의 유전다양성(He=0.151을 지 녔으나 유전군락은 더 넓은 400 m 이내에서 형성 되었다 (Shin et al., 2014). 이러한 공간적 유전구조 차이는 물황 철나무 집단의 분포 범위가 더 넓고, 얕은 계곡을 따라 분 포하는 수변생태지역으로 삭과(capsule)형태의 종자가 바 람 또는 물에 의해 원거리 이동이 용이한 까닭으로 보고 하였다(Shin et al., 2014). 반면 월악산 사시나무 집단은 분포 범위가 좁고 밀집을 이루고 있으며, 더구나 좁고 깊 은 계곡지역에 고립된 특성 때문에 종자의 비산이나 화분 의 분산 범위가 한정되어 유전적 유사성이 있는 개체들의 분포 범위가 24 m 이내에 그치게 되는 것으로 생각 된다.
입지 여건에 따라서 공간적 유전구조는 크게 달라질 수 있는데, 독일의 흑양(P. nigra)은 1,000 m 이내의 개체간에 유전적인 유사성이 있다(Rathmacher et al., 2009). 이는 흑양 집단이 약 3 km 길이의 강을 따라 분포할 뿐 아니라 임상이 그대로 노출된 나지여서 삭과나 종자가 멀리까지 이동하여 쉽게 정착하기 때문으로 추측된다.
결 론
본 연구는 월악산 사시나무 집단의 유전다양성과 공간 적 유전구조를 구명하였다. 월악산 사시나무림은 일본잎
Figure 2. Correlogram for the Populus davidiana stand in
Mt. Worak, South Korea, using AFLP markers. The r value
is an autocorrelation coefficient. The solid line is represented
the correlation between genetic distance and geographic
distance. The dotted lines are 95% confidence intervals.
갈나무 채종원내에 폭 70 m, 길이 200 m 띠모양으로 전 체 14,000 m2면적에 350개체가 분포하는 것으로 추정되 며, 임의로 설정된 조사구 4,900 m2내에 123개체 중 61개 체를 대상으로 유전변이를 분석 하였다.
월악산 사시나무림에서 AFLP 마커를 이용한 다형적 유 전자좌 비율(P)은 83.4%, 이형접합도 기대치(He)는 0.154, Shannon의 다양성 지수(S.I.)는 0.254로 나타났으며, 근맹 아 번식으로 추정되는 클론은 2개체가 확인되었다. 기존 에 보고된 microsatellite 마커를 사용한 사시나무속 연구 (Peng et al., 2005; Lee et al., 2009; Rathmacher et al., 2009)와 국내의 사시나무 집단의 이형접합도 기대치를 비 교하였을 때 월악산 사시나무림은 이례적으로 낮은 수치 를 보이고 있다. 월악산 사시나무 집단은 창시자효과와 더 불어 유전자이입이 어려운 계곡 지역의 고립된 환경, 근 친교배가 우려되는 소규모 임분 구성, 또한 국내 타지역 사시나무 집단들 보다 낮은 유전다양성을 보이고 있기 때 문에 장기적으로 활력이 감소하고 집단이 쇠퇴할 우려가 크다.
월악산 사시나무 집단의 공간적 유전구조 분석에서 직 선거리 24 m 이내에는 유전적으로 유사한 개체가 분포하 는 것으로 나타났다. 월악산 사시나무와 비슷한 수준의 유 전다양성을 지닌 물황철나무는 더 큰 유전군락 크기를 갖 는데(Shin et al., 2014), 이러한 차이는 물황철나무 집단에 서 개체간의 분포 거리가 더 멀고 얕은 계곡을 따라서 분 포하고 있어서 종자의 이동이 쉽기 때문이라고 추정된다.
반면 월악산 사시나무는 비교적 깊은 계곡과 암석 지역에 둘러싸여 고립된 지역 특성으로 종자나 화분 이동이 어려 울뿐만 아니라 개체분포가 밀집형태를 이루고 있기 때문 에 작은 유전군락을 이루고 있는 것으로 생각된다.
References