• 검색 결과가 없습니다.

Potential Effects of Urban Growth under Urban Containment Policy on Streamflow in the Gyungan River Watershed, Korea

N/A
N/A
Protected

Academic year: 2021

Share "Potential Effects of Urban Growth under Urban Containment Policy on Streamflow in the Gyungan River Watershed, Korea"

Copied!
10
0
0

로드 중.... (전체 텍스트 보기)

전체 글

(1)

http://dx.doi.org/10.7848/ksgpc.2015.33.3.163

Potential Effects of Urban Growth under Urban Containment Policy on Streamflow in the Gyungan River Watershed, Korea

Kim, Jinsoo

1)

ㆍ Park, Soyoung

2)

Abstract

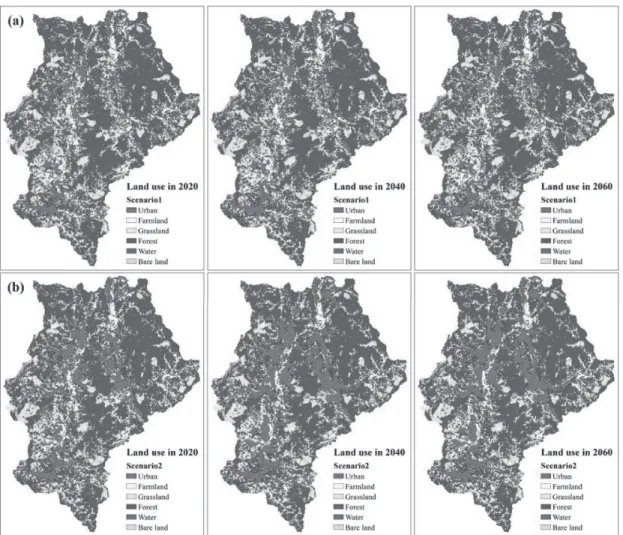
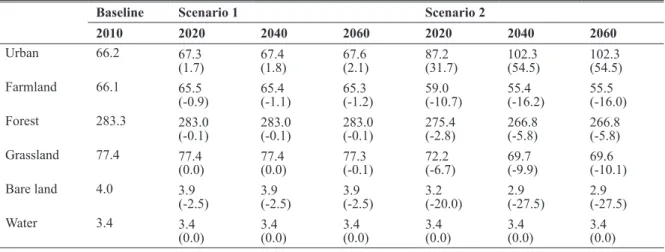
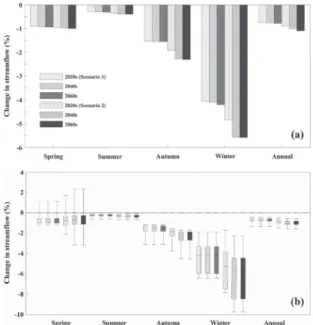
This study examined the potential effects of urban growth on streamflow in the Gyungan River watershed, Korea, using urban containment scenarios. First, two scenarios (conservation and development) were established, and SLEUTH model was adapted to predict urban growth into the year 2060 with 20 years interval under two scenarios in the study area. Urban growth was larger under scenario 2, focusing on development, than under scenario 1, focusing on conservation. Most urban growth was predicted to involve the conversion of farmland, forest, and grasslands to urban areas. Streamflow in future periods under these scenarios was simulated by the Soil and Water Assessment Tool (SWAT) model. Each scenario showed distinct seasonal variations in streamflow. Although urban growth had a small effect on streamflow, urban growth may heighten the problems of increased seasonal variability in streamflow caused by other factor, such as climate change. This results obtained in this study provide further insight into the availability of future water resource and can aid in urban containment planning to mitigate the negative effects of urban growth in the study area.

Keywords : Urban Growth, Urban Containment Scenario, SLEUTH, Streamflow, SWAT, Climate Change Original article

Received 2015. 05. 18, Revised 2015. 06. 08, Accepted 2015. 06. 25

1) Member, Dept. of Civil and Urban Engineering, Inje University (E-mail: [email protected])

2) Corresponding Author, Member, Dept. of Geography, University of California, Santa Barbara (E-mail: [email protected])

This is an Open Access article distributed under the terms of the Creative Commons Attribution Non-Commercial License (http://

1. Introduction

Sufficient water supply is a key ingredient in the health and well-being of humans and ecosystems, and for social and economic development. Water resources have become serious issues facing many communities and nations around the world following climate change, global warming, and land use change, such as urban growth (Guo et al., 2008).

These global changes have stimulated increasing demand for water resources, resulting in the potential water shortage and water quality degradation in many countries (Dong et al., 2014).

Urban growth plays a significant role in water resource conservation and ecological protection for natural ecosystems

on large scales. Urban growth can alter hydrological cycles

by affecting ecosystem evapotranspiration, soil infiltration

capacity, and surface and subsurface flow regimes (Qi et al.,

2009). Although the effects of urban growth were smaller

than those caused by climate change, urban growth

may exacerbate or alleviate climate change effects on

seasonal variability of water quantity and quality in

the watershed (Kim et al., 2013). Understanding the

potential effects of urban growth on water resources in

the watershed is crucial for sustainable water resource

management planning (Dixon and Earls, 2012). Many

previous studies have assessed the impact of urban

growth on water resources in watersheds (White and

Greer, 2006).

(2)

The spatial patterns of urban development and conservation also have signifi cant impacts on the timing and magnitude of water resources in watersheds. For ensuring the provision of sustainable water resources, initiatives are being taken worldwide to achieve greater sustainability in water resources by establishment of an urban containment boundary and protection of the catchment by restricting land use activities. The greenbelt- based urban containment policy in Korea accepted in 1971 to protect natural environment and water resources from impacts of urbanization and other major developments.

Korea’s greenbelt policy has been shown to be the most successful urban containment policy among the policies executed by Asian countries (Yokohari et al., 2008).

However, the greenbelt policy has been criticized due to its associated problems such as growing land demand, property rights of landowners, and longer commuting distances. As a result, greenbelts in some regions have been eliminated, and existing greenbelts in other regions are now being gradually removed according to the Urban Master Plan (Jeon et al., 2013).

Urban expansion due to the removal of greenbelt can be associated with an increase in high fl ow, decrease in low fl ow, and increased variability in fl ow because impervious surface cover increases with urban growth; impervious surfaces decrease the infi ltration of precipitation and increase runoff. Therefore, a new paradigm of water resource management that considers urban growth and the potential effects of urban growth on water resources under urban containment policy is required.

This study examined the potential effects of urban growth under urban containment scenarios on water resources for sustainable water resource management planning in the Gyungan River watershed, Korea. The primary steps and contributions of this study are summarized as follows:

1. SLEUTH urban growth model was adapted to predict urban growth into the year 2060 under two urban containment scenarios (conservation and development) in the watershed, and urban growth in each storyline was analyzed.

2. This study applied the Soil and Water Assessment Tool (SWAT) model, a distributed hydrological model.

The model was calibrated and validated automatically to simulate the streamfl ow in the watershed.

3. The simulated streamfl ow for the future periods under each scenario was compared to the corresponding values in the baseline period (i.e., 2000-2009) to evaluate the impacts of urban growth on water resources in the watershed.

2. Study Area

The study site, the Gyungan River watershed, has an area of 505.5 km
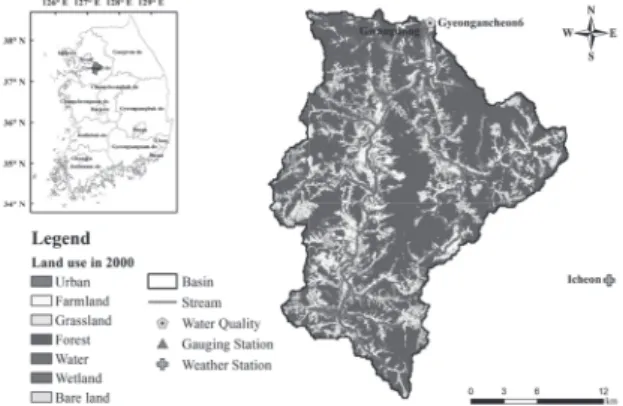
2

and is located in the Gyeonggi Province, Korea (Fig. 1). This watershed is one of the conservation-focused watersheds draining directly into the Paldang Lake, which is the largest drinking water conservation area in Korea that provides drinking water for more than 20 million residents in Seoul and its neighboring areas. Thus, there is critical need to assess risk associated with the impacts of land use change under urban growth scenarios and develop effective long-term plans to protect water resources. Gyungan River has a fl ow length of approximately 47.9 km. In elevation, the Gyungan River watershed ranges from 11 m to 626 m, with an average elevation of 178.8 m above sea level and average slope of 10.95°. More than 70% of the watershed area is forest, and approximately 17% is farmland in 2000, used for crop agriculture including rice paddies (Fig. 1).

The climate is extremely seasonal as a typical climate in Korea: summer is hot and humid with frequent heavy precipitation associated with the East Asian monsoon,

Fig. 1. Location of this study area, land use map in 2000, and hydro-meteorological gauging stations in the

Gyungan River watershed

(3)

whereas winter is cold and dry under the influence of Siberian air masses. The annual average precipitation in the watershed is approximately 1319 mm with an annual average temperature of 11.7 °C.

3. Methodology

3.1. SLEUTH model

The SLEUTH is a modified cellular automata (CA) model, developed by Clarke et al. (1997), that has been applied extensively in the geographic simulation of future planning scenario. SLEUTH is an acronym for the gridded map input data layers required by the model: slope, land use, exclusion, urban extent over time, transportation, and hill-shade, and simulates land use dynamics as a physical process. The version used in this study, SLEUTH 3.0Beta, consists of two subcomponents, one that models urban/non- urban growth, the urban growth model (UGM), and the other that models land use change dynamics, the Deltatron land use model (DLM) (Dietzel and Clarke, 2007).

In SLEUTH, five growth coefficients, which are diffusion, breed, spread, slope residence and road gravity, control the behavior of the system, and are predetermined by the user at the onset of every model run (Dietzel and Clarke, 2004). Each coefficient has a value that ranges from 0 to 100 that are determined during the process of calibration. In running the model, these coefficients are calculated followed by estimation of four types of growth rule: spontaneous, new spreading center, edge, and road gravity growth.

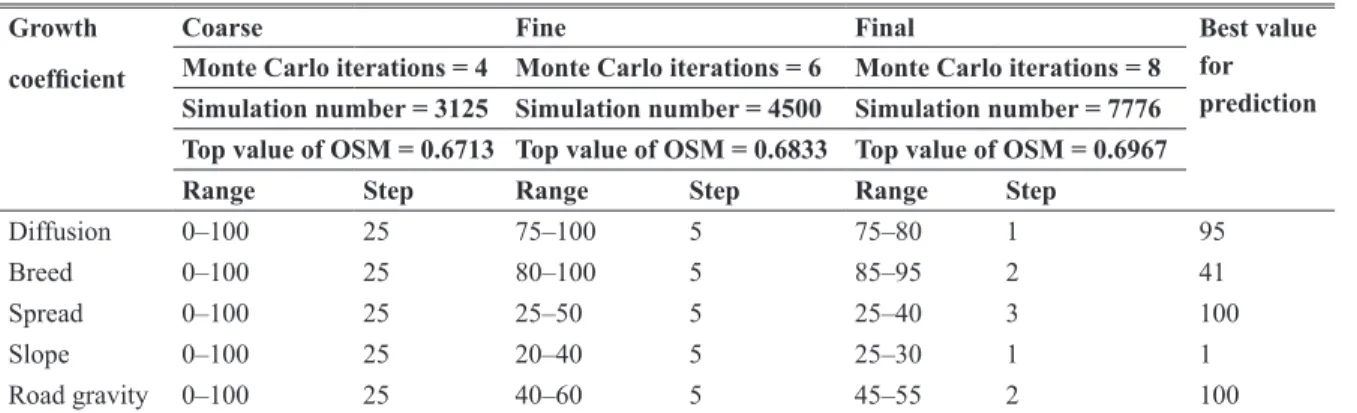
SLEUTH calibration is one of the most important elements of successful model application, since it allows us to narrow down the resulting values of the model to reflect the characteristics of the local (Silva and Clarke 2002). This model uses a brute force calibration process during which the set of control parameters are refined by three sequential calibration phases: coarse, fine, and final calibrations (Dietzel and Clarke 2007). At each phase, the user tries to extract the values for each of the five coefficients controlling growth that provide the best match between modeled and observed patterns of urban growth over the calibration period. An optimal SLEUTH metric

(OSM), which is the product of the compare, population, edges, clusters, slope, X-mean, and y-mean metrics, was used as the primary metric to evaluate performance of the model. It helps to choose the combination of parameters that provide the most robust results for SLEUTH calibration (Dietzel and Clarke 2007). After each calibration phase, the top five OSM scores determine the range of values used in the subsequent phase of calibration.

3.2. SWAT model

The Soil and Water Assessment Tool (SWAT) was used in this study to evaluate the land use change impacts under urban containment policy on water resources in the Gyungan River watershed. It is an agro-hydrological watershed-scale model developed by the U.S. Department of Agriculture (USDA) Agricultural Research Service (Arnold et al., 1998).

It is a physically based, continuous-time, semi-distributed model developed to predict the impact of land management practices on water, sediment and agricultural chemical yields in large complex watersheds. Many previous studies have investigated the SWAT applications on hydrologic analyses, pollutant load assessment, and climate and land used change impacts on water resources. The hydrologic cycle as simulated by SWAT is based on the water balance equation, as follows:

) (

1

0 surf a seep gw

t

i day

t SW R Q E w Q

SW  

   

(1)

where SW

t

is the final soil water content (mm), SW

0

is the initial soil water content on day i (mm), t is the time (days), R

day

is the amount of precipitation on day i (mm), Q

surf

is the amount of surface runoff on day i (mm), E

a

is the amount of evapotranspiration on day i (mm), w

seep

is the amount of water entering the vadose zone from the soil profile on day i (mm), and Q

gw

is the amount of return flow on day i (mm).

In this model, a watershed is divided into multiple sub-

watersheds, which are then further divided into one or

more hydrological response units (HRUs) according to

topography, types of land use, and soil. These HRUs are

defined as homogeneous spatial units characterized by

similar geo-morphological and hydrological properties

(Flügel, 1995). Surface runoff is estimated using the soil

(4)

conservation service (SCS) curve-number (CN) method for each HRU. Soil erosion and sedimentation rate were calculated for each HRU using the Modifi ed Universal Soil Loss Equation (MUSLE) developed by Williams (1975).

In this study, hydrology and water quality modeling in the Gyungan River watershed was performed using the SWAT extension for ArcGIS mapping analysis software, called ArcSWAT.

3.3. Data preparation

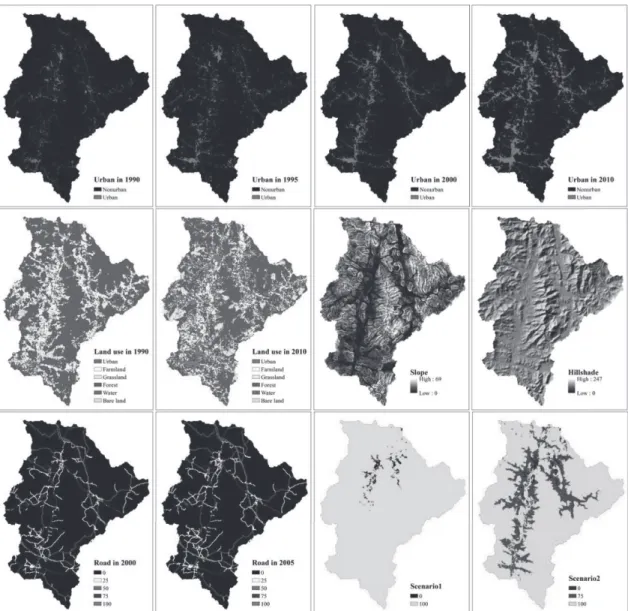
SLEUTH uses the topographic data in the form of slope and hill-shade maps derived from digital elevation model (DEM). In addition, more than four historic urban layers (1990, 1995, 2000, 2010) for statistical calibration, two land use layers (1990, 2010) for forecasting land use in the Deltatron land use model (DLM) part, and two or more weighted road maps (2000, 2005) are required, as shown Fig. 2. Data required in SWAT include the topographic and soil data, a land use layer (2000), and hydro-meteorological data.

Fig. 2. Input data set for SLEUTH model used in this study

(5)

The topographic data used in this study included elevation, slope, aspect, and flow direction and accumulation. These data were obtained from a 30-m Advanced Spaceborne Thermal Emission and Reflection Radiometer (ASTER) Global Digital Elevation Map (GDEM) (Table 1). A 1/25,000 soil map provided by the Korean Rural Development Administration (KRDA) was also used. This study used land use data (1990, 1995, 2000) from the Korean Water Management Information System (WAMIS) and land use data (2010) provided by the Korean Ministry of Environment (KME) in seven classes. Transportation network layers were obtained from National Transport Information Center (NTIC). We extracted main roads (local road, metropolitan road, national highway, and expressway) from the maps and then assigned pixel values according to the degree of development (25, 50, 75, and 100, respectively).The meteorological inputs required for daily calculations of hydrological processes in the SWAT model are daily precipitation, maximum and minimum air temperatures, solar radiation, wind speed, and relative humidity. These daily data were obtained from the Icheon weather station (cross mark in Fig. 1), which is

located around the Gyungan River watershed and is managed by the Korea Meteorological Administration (KMA). Water level and streamflow were used as hydrological data, which were observed from 2005 to 2009 at the Gwangdong gauging station in the watershed (Fig. 1).

3.4. Urban containment scenarios setup and experiments

In this study, two scenarios were established to predict future urban growth under urban containment policy using the SLEUTH model (Table 2). Scenario 1, the conservation scenario, assumed that the environmentally regulated area, including slope, elevation, and greenbelt, would be protected from urban development according to the “status quo.” Urban development also would be restricted according to the “Urban Master Plan” and “white paper of environmental conservation value assessment map (ECVAM).” The ECVAM is made through the evaluation of 67 items, including greenbelt area and bio-diversity. The map is a five grade assessment map created with nationally integrated environmental information and environmental values by KME (Jeon et al., 2010). Areas with a

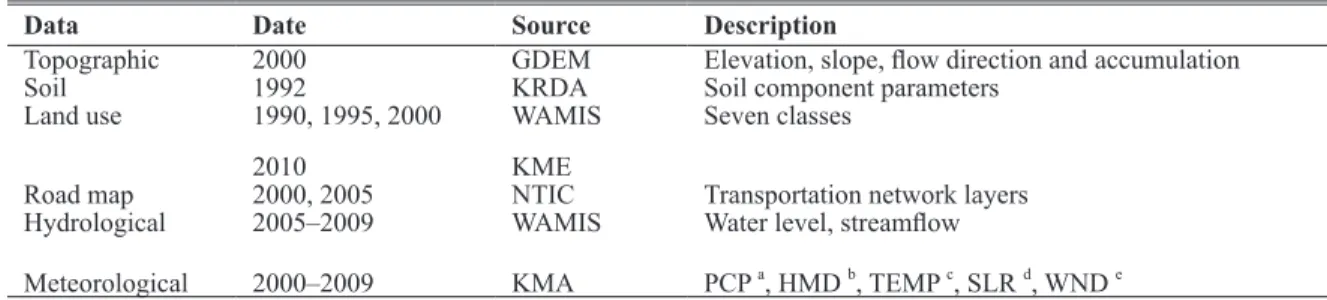
Data Date Source Description

Topographic 2000 GDEM Elevation, slope, flow direction and accumulation

Soil 1992 KRDA Soil component parameters

Land use 1990, 1995, 2000 2010

WAMIS KME

Seven classes

Road map 2000, 2005 NTIC Transportation network layers

Hydrological 2005–2009 WAMIS Water level, streamflow

Meteorological 2000–2009 KMA PCP

a

, HMD

b

, TEMP

c

, SLR

d

, WND

e

Table 1. Data used in the SLEUTH and SWAT models in this study

a

Precipitation;

b

Humidity;

c

Temperature;

d

Solar radiation;

e

Wind speed.

a

P indicates the exclusion probability, or levels of protections;

b

Total greenbelt area;

c

Greenbelt area that does not overlap with ECVAM conservation region

Table 2. Scenarios set up in this study

Scenario 1 P

a

Scenario 2 P

Slope More than 15° 100 15–20° 75

More than 20° 100

Elevation More than 50 m 100 50–100 m 75

More than 100 m 100

ECVAM First class 100 First class 100

Second class 100 Second class 100

Others 0 Others 0

Greenbelt

a

All area

b

100 All area

c

0

(6)

grade of 1 in ECVAM are set as the top-priority conservation areas. Scenario 2, which focused on development, assumed greenbelt removal and relaxation of restrictions regarding slope, elevation, and area. Therefore, slope was set to a value of 75 for areas of 15 to 20° slopes and to 100 for areas of slope greater than 20°. ECVAM were all applied, just as in scenario 1. Moreover, greenbelt areas that did not overlap with the ECVAM conservation area were set to a value of zero to allow urban development. The scenarios were applied to the model according to an excluded area layer (Fig. 2).

4. Results and Discussion

4.1. SLEUTH calibration and prediction

This study adopted the standard three calibration phases described above and used the OSM to evaluate a goodness of fi t. The calibration was conducted over the data between 1990 and 2010. The full spatial resolution the input layers (100- m) was applied in three calibration phases. For the coarse calibration phase, the entire range from 0 to 100 of coeffi cient values was assigned with an increment step of 25. A low number, 4, of Monte Carlo iterations was assigned (Table 3). The result of the coarse calibration phase was evaluated using the OSM, and then the ranges were selected from the top fi ve OSM scores for the fi ne calibration phase. In the fi ne calibration phase, the number of Monte Carlo iterations was increased to 6. Diffusion, breed, spread, slope, and road gravity coeffi cients covered values of 75–100, 80–100, 25–50, 20–40, and 40–60, respectively. Each calibration was successful in increasing the OSM value. The fi nal calibration

Growth coeffi cient

Coarse Fine Final Best value

for prediction Monte Carlo iterations = 4 Monte Carlo iterations = 6 Monte Carlo iterations = 8

Simulation number = 3125 Simulation number = 4500 Simulation number = 7776 Top value of OSM = 0.6713 Top value of OSM = 0.6833 Top value of OSM = 0.6967

Range Step Range Step Range Step

Diffusion 0–100 25 75–100 5 75–80 1 95

Breed 0–100 25 80–100 5 85–95 2 41

Spread 0–100 25 25–50 5 25–40 3 100

Slope 0–100 25 20–40 5 25–30 1 1

Road gravity 0–100 25 40–60 5 45–55 2 100

Table 3. Summary of growth coeffi cients during each calibration process

Fig. 3. ROC curve derived from the cumulative probability of urbanization for the year 2010 and the real

urban area of 2010

produced an acceptable top OSM value of 0.6967. After we calibrated the model successfully, the fi nal coeffi cient values (diffusion = 95, breed = 41, spread = 100, slope = 1, and road gravity = 100) were used in prediction mode to simulate the future of study area. Prediction was completed using the full resolution data and 100 Monte Carlo iterations.

The accuracy of the predicted results was evaluated using the receiver operating characteristic (ROC) method.

The area under the ROC curve (AUC) can be used to

qualitatively assess the prediction accuracy. The AUC

values between 0.7 and 0.9 show reliable precision, whereas

scores higher than 0.9 or lower than 0.7 indicate high or

low precision, respectively (Wu et al., 2009). Fig. 3 presents

the ROC curve comparing the cumulative probability map

image of the year 2010 and the binary urban map of the

corresponding year. The AUC value was 0.852, which can

be taken as reliable precision.

(7)

The results of the prediction for each scenario are shown in Fig. 4. The Scenario 2 showed more rapid urban growth than the scenario 1, because the scenario 1 indicated that a greenbelt in the current development-restriction area will still be preserved by restricting development. Table 4 shows each area class in the future land use maps produced by scenario 1 and 2 and the change rate (%) of each future land use class compared to 2010 land use map. In the current land use map, forests cover more than 56% of the area, with farmland and urban land accounting for 13.2% of the whole area, respectively. In scenario 1, the urban area grew in a constant manner by 2060. The urban area in 2060 was predicted to be 2.1% larger than the area in 2010. In

the case of scenario 2, the urban area in 2060 increased by 36.1 km

2

, representing growth of 54.5% compared to 2010. This increase in the extent of the urban area reduced farmland, forest, and grassland to 10.6 km

2

, 16.5 km

2

, and 7.8 km

2

by 2060, respectively. The scenario 1 results showed no signifi cant change in forest and grassland area, with a reduction of only 0.1%, whereas scenario 2 indicated forest and grassland area of 266.8 km

2

and 69.6 km

2

by 2060, respectively, representing 5.8 and 10.1% reduction in comparison to 2010. In conclusion, scenario 2 indicated greater urban growth than scenario 1, and this urban growth would be achieved by losses of farmland, forest, and grasslands.

Fig. 4. Predicted urban growth under each scenario in the Gyungan River watershed in 2020, 2040 and 2060

(a) Scenario 1: conservation. (b) Scenario 2: development

(8)

4.2. SWAT calibration and validation

In this study, model parameter optimization was carried out using Sequential Uncertainty Fitting Ver. 2 (SUFI-2), which is an uncertainty analysis algorithm built into SWAT Calibration and Uncertainty Programs (SWAT-CUP).

For model calibration and validation, daily streamfl ow observed at the watershed outlet from 2005 to 2009 were used (Table 1). The data from 2005 to 2007 were used for model calibration, and the data from 2008-2009 were used for model validation (Fig. 5). The predictive power of hydrological models was evaluated using the correlation coeffi cient (R

2

), and the Nash and Sutcliffe model effi ciency coeffi cient (E

NS

) (Nash and Sutcliffe, 1970).

Fig. 5 shows the relationship between observed and simulated streamfl ow for the calibration and validation periods. In this study area, the R-squared (R

2

) and E

NS

of streamfl ow were 0.86 and 0.79, respectively, for each

calibration period, and 0.90 and 0.85, respectively, for each validation period. The simulated streamfl ow was considered accurate for values of E

NS

> 0.75. Therefore, these results suggest that the calibrated model can describe the streamfl ow in the Gyungan River watershed and confi rm that the calibrated model with optimized parameters can be applied to determine the responses of this area’s streamfl ow to urban growth.

4.3. Potential effects of urban growth on streamflow

Streamfl ow in the watershed from 2020 to 2069 was simulated according to each scenario for three periods:

the 2020s (i.e., 2020–2029), the 2040s, and the 2060s. The simulated streamfl ow for each future period under each scenario was compared to the corresponding values for the baseline period (2000–2009) under the no-change scenario.

It has been widely reported that urban growth affects both quantity and quality of water resources. Fig. 6 shows the changes in seasonal and annual streamfl ow for the future periods according to future urban growth. There appeared to be little change in streamfl ow (< 6%), but it confi rms that changes in seasonal and annual streamfl ows are signifi cantly affected by future urban growth. The general pattern indicated decreases in all seasons and annual streamfl ow. This can be explained by urban growth in the watershed and changes in wet and dry seasons. The Table 4. Areas of future land use under each scenario (unit: km

2

). Figures in brackets represent future land use class change

(%) compared to land use in 2010

Baseline Scenario 1 Scenario 2

2010 2020 2040 2060 2020 2040 2060

Urban 66.2 67.3

(1.7) 67.4

(1.8) 67.6

(2.1) 87.2

(31.7) 102.3

(54.5) 102.3

(54.5)

Farmland 66.1 65.5

(-0.9) 65.4

(-1.1) 65.3

(-1.2) 59.0

(-10.7) 55.4

(-16.2) 55.5 (-16.0)

Forest 283.3 283.0

(-0.1) 283.0

(-0.1) 283.0

(-0.1) 275.4

(-2.8) 266.8

(-5.8) 266.8

(-5.8)

Grassland 77.4 77.4

(0.0) 77.4

(0.0) 77.3

(-0.1) 72.2

(-6.7) 69.7

(-9.9) 69.6

(-10.1)

Bare land 4.0 3.9

(-2.5) 3.9

(-2.5) 3.9

(-2.5) 3.2

(-20.0) 2.9

(-27.5) 2.9

(-27.5)

Water 3.4 3.4

(0.0) 3.4

(0.0) 3.4

(0.0) 3.4

(0.0) 3.4

(0.0) 3.4

(0.0)

Fig. 5. Observed and simulated daily streamfl ow for the

calibration and validation period during 2005-2009

(9)

ranges of decreases become larger closer to the 2060s with the huge growth in urban areas. With scenario 1, streamfl ow decreased by 0.3–0.9% in the spring and summer, whereas with scenario 2, streamfl ow decreased by 0.4–1.0% (Fig. 6a). In particular, in autumn and winter, which are the dry seasons, scenario 1 and 2 appeared to have the greatest decreases, with values of 1.5–4.2% and 1.9–5.6%, respectively. Previous studies have also reported reductions in streamfl ow with dry periods, caused by decreased infi ltration of precipitation as a result of urban growth and lager areas of impervious surfaces (Kim et al., 2013; Paul and Meyer, 2001).

Fig. 6b shows relative changes in seasonal and annual streamfl ows as box and whisker plots by future period under scenario 1 and 2. The ranges of relative changes in annual streamfl ow were smaller than those in seasonal streamfl ow, and similar changes appeared under scenario 1 and 2. The relative changes in seasonal streamfl ow in dry seasons (autumn and winter) appeared to be more uncertain than those in other seasons. To decrease the uncertainty in the model, a calibration process with additional comparison between soil moisture and actual evapotranspiration is required.

5. Summary and Conclusions

This study investigated the potential effects of urban growth under two urban containment scenarios (conservation and development) on streamfl ow in the Gyungan River watershed, Korea. SLEUTH model was adapted to predict urban growth into the year 2060 under two scenarios in the watershed. Urban growth was larger under scenario 2, focusing on development, than under scenario 1, focusing on conservation. Most urban growth was predicted to involve the conversion of farmland, forest, and grasslands to urban areas. The potential effects of each scenario were especially clear in the seasonal variations of streamfl ow. Although urban growth had a small effect on streamfl ow, it confi rms that changes in seasonal and annual streamfl ows are signifi cantly affected by future urban growth. As urban growth decrease fl ow in dry seasons, it is essential to consider urban growth and associated drought pattern when developing water resource management plans. Understanding the changes in streamfl ow caused by urban growth under urban containment policy is crucial for sustainable water resource planning and management. In addition, planner and policy makers should work together to develop urban containment plans to mitigate the negative effects of urban growth.

References

Arnold, J.G., Srinivasan, R., Muttiah, R.S., and Williams, J.R.

(1998), Large area hydrologic modeling and assessment - part 1: model development, Journal of the American Water Resources Association, Vol. 34, pp. 73-89.

Clarke, K.C., Hoppen, S., and Gaydos, L. (1997), A self- modifying cellular automaton model of historical urbanization in the San Francisco Bay area, Environmental and Planning B: Planning and Design, Vol. 24, pp. 247- 261.

Dietzel, C. and Clarke, K.C. (2004), Replication of spatio- temporal land use patterns at three levels of aggregation by an urban cellular automata, Lecture Notes in Computer Science, Vol. 3304, pp. 523-532.

Fig. 6. Changes in streamfl ow under each scenario for

future periods relative to the baseline period. (a) Changes in

mean seasonal and annual streamfl ow. (b) Box-and-whisker

plots showing changes in seasonal and annual streamfl ows

(10)

Dietzel, C. and Clarke, K.C. (2007), Toward optimal calibration of the SLEUTH land use change model, Transactions in GIS, Vol. 11, No. 1, pp. 29-45.

Dixon, B. and Earls, J. (2012), Effects of urbanization on streamflow using SWAT with real and simulated meteorological data, Applied Geography, Vol. 35, No. 1-2, pp. 174-190.

Dong, C., Huang, G., Tan, Q., and Cai, Y. (2014), Coupled planning of water resources and agricultural landuse based on an inexact-stochastic programming model, Frontiers of Earth Science, Vol. 8, No. 1, pp. 70-80.

Flügel, W. (1995), Delineating hydrological response units by geographical information system analyses for regional hydrological modeling using PRMS/MMS in the drainage basin of the River Bröl, Germany, Hydrological Process, Vol. 9, pp. 423-436.

Guo, H., Hu, Q., and Jiang, T. (2008), Annual and seasonal streamflow responses to climate and land-cover changes in the Poyang Lake Basin, China, Journal of Hydrology, Vol.

355, pp. 106-122.

Jeon, S., Park, Y., Hong, H., Choi, H., and Kang, S. (2013), Sustainable Management of Green Belt by Changing Land Environment Management, Korea Environmental Institute (KEI), Climate Change Policy Research 2013-08.

Jeon, S., Song, W., Lee, M., and Kang, B. (2010), Improvement of the environmental conservation value assessment map (ECVAM) by complement of the vegetation community stability item, Journal of the Korea Society of Environmental Restoration Technology, Vol. 13, No. 2, pp.

114-123. (in Korean with English abstract)

Kim, J., Choi, J., Choi, C., and Park, S. (2013), Impacts of changes in climate and land use/land cover under IPCC RCP scenarios on streamflow in the Hoeya River Basin, Korea, Science of the Total Environment, Vol. 452-453, pp.

181-195.

Nash, J.E. and Sutcliffe, J.V. (1970), Review flow forecasting through conceptual models I : a discussion of principles, Journal of Hydrology, Vol. 10, pp. 282-290.

Paul, M.J. and Meyer, J.L. (2001), Streams in the urban landscape, Annual Review Ecology, Evolution, and Systematics, Vol. 32, pp. 333-365.

Qi, S., Sun, G., Wang, Y., McNulty, S.G., and Moore Myers,

J.A. (2009), Streamflow response to climate and landuse changes in a coastal watershed in North Carolina, Transactions of the ASABE, Vol. 52, No. 3, pp. 739-749.

Silva, E.A. and Clarke, K.C. (2002), Calibration of the SLEUTH urban growth model for Lisbon and Porto, Portugal, Computers, Environment and Urban Systems, Vol. 26, No. 6, pp. 525 -552.

White, M.D. and Greer, K.A. (2006), The effects of watershed urbanization on the stream hydrology and riparian vegetation of Los Peñasquitos Greek, California, Landscape and Urban Planning, Vol. 74, pp. 125-138.

Williams, J.R. (1975), Sediment-yield prediction with universal equation using runoff energy factor, Proceedings of the Sediment Yield Workshop: Present and Prospective Technology for Predicting Sediment Yield and Sources;

1972 Nov 28-30; USDA Sedimentation Lab. Oxford, pp.

244-252.

Wu, X., Hu, Y., He, H.S., Bu, R., Onsted, J., and Xi, F.

(2009), Performance evaluation of the SLEUTH model in the Shenyang metropolitan area of northeastern China, Environmental Modeling and Assessment, Vol. 14, No. 2, pp. 221-230.

Yokohari, M., Takeuchi, K., Watanabe, T., and Yokota, S.

(2008), Beyond greenbelts and zoning: a new planning

concept for the environment of asian mega–cities,

Landscape and Urban Planning, Vol. 47, No. 3, pp. 159-

171.

수치

Fig. 1. Location of this study area, land use map in  2000, and hydro-meteorological gauging stations in the
Fig. 2. Input data set for SLEUTH model used in this study
Table 2. Scenarios set up in this study
Fig. 3. ROC curve derived from the cumulative  probability of urbanization for the year 2010 and the real
+4

참조

관련 문서

Studies are on-going concerning the potential impact of the control rod material(Ag, In, Cd). In the containment, The equilibrium between iodine adsorption

The Quito Implementation Plan comprises a pledge for sustainable urban development and effective means of implementation, along with policy tasks in areas of society, the

• Urban spaces related to cultural strategies may contribute to urban well-being if they result in urban development or urban regeneration. • Translating the unique history

In the line of this, in what ways does Design Control in planning policy and the development of Urban Design Code can improve the quality of urban space.. In your opinion, what

Ÿ Package complementary policies: To counteract potential adverse effects (congestion, housing unaffordability, urban heat islands, etc.), compact city policies

The primary goal of urban renewal is to improve the structure of the urban area, housing development, infrastructure (roads, water, power supply, etc),

Reinterpreting the Right to the City in Korea: Policy Responses to

The Japanese government and urban planners of the Chinese democratic government adopted a modern urban planning theory (composition of residential areas and green belts,