Several epidemiological studies have shown that high body weights or high body mass indices (BMI) are related to a high bone mass, and that decreases in body
Relation between Obesity and Bone Mineral Density and Vertebral Fractures in Korean
Postmenopausal Women
Kyong-Chol Kim,
1,2Dong-Hyuk Shin,
1Sei-Young Lee,
1Jee-Aee Im,
3and Duk-Chul Lee
41Department of Family Medicine, Mizmedi Hospital, Seoul;
2Graduate Program in Science for Aging, The Graduate School, Yonsei University College of Medicine, Seoul;
3Sports and Medicine Research Center, INTOTO Inc., Seoul;
4Department of Family Medicine, Yonsei University College of Medicine, Seoul, Korea.
Purpose:The traditional belief that obesity is protective against osteoporosis has been questioned. Recent epidemiologic studies show that body fat itself may be a risk factor for osteoporosis and bone fractures. Accumulating evidence suggests that metabolic syndrome and the individual components of metabolic syndrome such as hypertension, increased triglycerides, and reduced high-density lipoprotein choles- terol are also risk factors for low bone mineral density. Using a cross sectional study design, we evaluated the associations between obesity or metabolic syndrome and bone mineral density (BMD) or vertebral fracture. Materials and Methods:A total of 907 postmenopausal healthy female subjects, aged 60-79 years, were recruited from woman hospitals in Seoul, South Korea. BMD, vetebral fracture, bone markers, and body composition including body weight, body mass index (BMI), percentage body fat, and waist circumference were measured. Results:After adjusting for age, smoking status, alcohol consumption, total calcium intake, and total energy intake, waist circumference was negatively related to BMD of all sites (lumbar BMD p = 0.037, all sites of femur BMD p < 0.001) whereas body weight was still positively related to BMD of all sites (p < 0.001). Percentage body fat and waist circumference were much higher in the fracture group than the non-fracture group (p = 0.0383, 0.082 respectively). Serum glucose levels were postively cor- related to lumbar BMD (p = 0.016), femoral neck BMD (p = 0.0335), and femoral trochanter BMD (p = 0.0082). Serum high density lipoprotein cholesterol (HDLC) was positively related to femoral trochanter BMD (p = 0.0366) and was lower in the control group than the fracture group (p = 0.011). Conclusion:In contrast to the effect favorable body weight on bone mineral density, high percentage body fat and waist circumference are related to low BMD and a vertebral fracture. Some com- ponents of metabolic syndrome were related to BMD and a vertebral fracture.
Key Words: Obesity, metabolic syndrome, bone mineral density, vertebral fracture
Received: April 27, 2010 Revised: May 27, 2010 Accepted: May 27, 2010
Corresponding author: Dr. Duk-Chul Lee, Department of Family Medicine, Yonsei University College of Medicine, 250 Seongsan-ro, Seodaemun-gu, Seoul 120-753, Korea.
Tel: +82-2-2228-2330, Fax: +82-2-362-6835 E-mail: [email protected]
∙The authors have no financial conflicts of interest.
© Copyright:
Yonsei University College of Medicine 2010 This is an Open Access article distributed under the terms of the Creative Commons Attribution Non- Commercial License (http://creativecommons.org/
licenses/by-nc/3.0) which permits unrestricted non- commercial use, distribution, and reproduction in any medium, provided the original work is properly cited.
INTRODUCTION
weight may cause bone loss.1-3The following hypothetical mechanisms are thought to underlie these epidemiologic observations. First, it is generally accepted that a higher body mass results in heavier mechanical loading of bone, enhancing the differentiation of osteoblasts. Weight gain in the postmenopausal period results in an increase in the number of adipocytes, which are important sources of estrogen derived from aromatization, resulting in increas- ing a bone mineral density (BMD) in postmenopausal women.1,4 Furthermore, the insulin resistance of fat cells may increase circulating quantities of sex hormones such as androgens and estrogen, thereby increasing bone mass.5
However, an opposing theory that fat mass is negatively related to BMD has been suggested. To evaluate the rela- tionship between obesity and bone mass, it is necessary to differentiate between fat body mass and lean body mass.
Zhao, et al.6showed that fat mass is negatively related to bone mass when adjusted for body weight. In another study, risks of osteoporosis, osteopenia, and non-spine fractures were significantly elevated in subjects with higher percen- tages body fat after accounting for body weight.7In adoles- cents and young adults, fat mass adjusted by lean mass had negative or no associations with bone markers and BMD.8 There are several possible molecular mechanisms that can explain these findings. With increasing age, osteoblasts in the bone marrow are replaced by adipocytes and it is report- ed that increased bone marrow fat is inversely correlated with decreased trabecular bone volume.9,10In the bone mar- row, peroxisome proliferator-activated receptor-gamma (PPAR-γ) stimulates adipocyte differentiation but inhibits osteoblast development from mesenchymal stem cells.11In vivo, increased PPAR-γactivity leads to bone loss whereas decreased PPAR-γactivity results in increased bone mass.12 Two adipokines, leptin and adiponectin, which are derived from adipocytes, also play critical roles in bone formation and bone resorption.13-16
With these backgrounds, we measured different adipo- sities including body weight, BMI, percentage body, fat and waist circumference to investigate the relation to BMD of all sites and vertebral fracture. Further, we observed the relation between metabolic parameters such as serum tri- glyceride (TG), high density lipoprotein (HDL), glucose, blood pressure, and BMD of all sites and vertebral fractures.
Study participants
Healthy postmenopausal female subjects between the ages of 60-79 years, who were currently living in the community, were recruited from the visitors who came to the National Health Assessment Center in woman hospitals in Seoul,
South Korea for a periodic health check-up. Subjects who had a history of co-morbidities known to affect bone meta- bolism such as cancer, inflammatory bowel disease, pitui- tary diseases, hyperthyroidism, primary hyperparathyroi- dism, renal failure, rheumatic disease, or adrenal disease were excluded. Subjects who had used glucocorticoids over the last five years and any hormone replacement therapy (HRT) or selective estrogen receptor modulator (SERM), bisphosphonate, or calcitonin for the past year were also excluded. Any patient with vertebral fractures due to known accidental traumas were also excluded.
Data collection
Body weight (kg), BMI (kg/cm2), percent body fat (%), and abdominal circumference (cm) were measured and serum glucose (mg/dL) to evaluate adiposity, triglyceride (mg/dL), HDL cholesterol (mg/dL), and low density lipoprotein (LDL) cholesterol (mg/dL) were measured in fasting blood samples. Systolic and diastolic blood pressures were mea- sured by nurses. The definition of metabolic syndrome was followed by the National Cholesterol Education Program’s Adult Treatment Panel III (NCEP III) guidelines.17
Osteoporosis parameters included BMD (g/cm2) in the hip and spine, vertebral fractures, urine deoxypyridinoline (DPD), and serum total osteocalcin (OC). Lateral radio- graphs of the thoracic and lumbar spine demonstrating the presence of vertebral fractures were interpreted by radio- graphic morphometry using Genant’s semi-quantitative method.18BMD determined at the lumbar spine (L2-L4) was assessed using dual energy X-ray absorptiometry (DEXA).
Lunar (Madison, WI, USA) scanners were used in this study. Nutritional assessment was performed by dietitians using a 24 hr diet recall method.19From this, we calculated the status of energy expenditure, total calorie intake, cal- cium intake, and fat intake.
This study was conducted after approval of all research procedures by the hospital institutional review board (IRB). Written informed consent was obtained from all subjects.
Statistical analysis
Statistical analyses were performed using SAS software for Windows (v.9.1, Cary, NC, USA). Categorical variables were summarized using frequencies and percentages, while continuous variables were summarized using sample size, mean, median, standard deviation, and minimum and maximum values. Significance was declared at a two-sided 0.05 level, unless otherwise specified. To adjust for age, body weight, percentage body fat, smoking status, alcohol consumption, total energy expenditure, total calcium intake, and total fat and cholesterol intake, we used a general linear model for continuous dependent variables (BMD,
MATERIALS AND METHODS
bone marker, lipid profile, etc.) and a logistic regression model for categorical dependent variables (risk of osteopo- rotic fracture and metabolic syndrome). An association between the independent variables group and the risk of osteoporotic fracture and metabolic syndrome was cal- culated using odds ratios and 95% confidence intervals (CI).
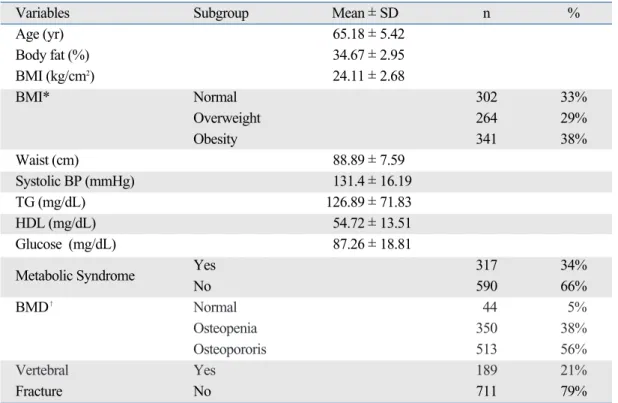
The major characteristics of the 907 subjects are shown in Table 1. The average age of the recruited patients was 65.18 ± 5.42 years. Among the 907 subjects, 302 (33%) individuals were overweight and 341 (38%) were obese.
The prevalence of metabolic syndrome was 34%, which is close to the value of 32.6% reported for the Korean popula- tion (2005, the Third Korea National Health and Nutrition Examination Survey, KNHANES III ).20The average lum- bar BMD (L BMD) was 0.84 ± 0.26 g/cm2, while the aver- age femoral BMD (neck, trochanter, ward) was 0.67 ± 0.12, 0.54 ± 0.09, and 0.45 ± 0.11 g/cm2, respectively. Among the 907 subjects, 44 (5%) individuals had a normal BMD, 350 (38%) were osteopenia, and 513 (56%) were osteopo- rosis. The prevalence of osteoporotic lumbar fractures was 21% in this study. Because no official statistics for osteo- porotic vertebral fractures are available for Korea, we were not able to determine whether this value is representative
of the general Korean population.
A simple correlation analysis revealed that both body weight (r = 0.2947, p < 0.001) and percentage body fat (r = 0.1935, p < 0.0001) were significantly and positively relat- ed to lumbar BMD (data not shown). However, waist cir- cumference was negatively related to the lumbar and all femur site BMD after adjusting for age, smoking status, alcohol consumption, total calcium intake, total energy intake, and body weight (Table 2). Percentage body fat was also negatively correlated to trochanter BMD but not to other sites.
The serum glucose level was postively correlated to lum- bar BMD (p = 0.016), femoral neck BMD (p = 0.0335), and femoral trochanter BMD (p = 0.0082). Serum high density lipoprotein cholesterol (HDLC) was only related to femoral trochanter BMD (p = 0.0366). Serum TG and systolic blood pressure (BP) were not related to BMD at any site.
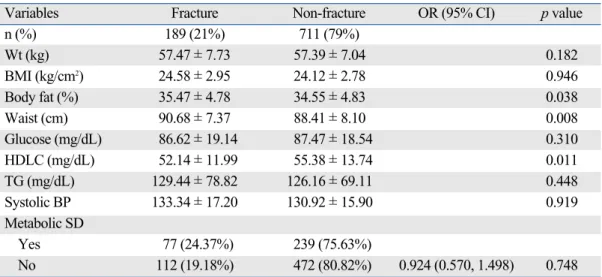
Table 3 demonstrates differences in independent varia- bles between the fracture and non-fracture groups. The average age of subjects in the fracture group was higher than that of the non-fracture group (odds ratio 1.077, 95% CI 1.042-1.114). The average body weights and BMIs of the two groups were not signifcantly different. However, the percentage body fat and waist circumference were much higher in the fracture group than the non-fracture group (odds ratio 1.064, 95% CI 1.003-1.129, odds ratio 1.043, 95% CI 1.011-1.077, respectively Fig. 1).
RESULTS
Table 1. Characteristics of the Subjects
Variables Subgroup Mean ± SD n %
Age (yr) 65.18 ± 5.42
Body fat (%) 34.67 ± 2.95
BMI (kg/cm2) 24.11 ± 2.68
BMI* Normal 302 33%
Overweight 264 29%
Obesity 341 38%
Waist (cm) 88.89 ± 7.59
Systolic BP (mmHg) 131.4 ± 16.19
TG (mg/dL) 126.89 ± 71.83
HDL (mg/dL) 54.72 ± 13.51
Glucose (mg/dL) 87.26 ± 18.81
Metabolic Syndrome Yes 317 34%
No 590 66%
BMD� Normal 44 5%
Osteopenia 350 38%
Osteopororis 513 56%
Vertebral Yes 189 21%
Fracture No 711 79%
BMI, body mass index; BMD, bone mineral density; HDL, high density lipoprotein; TG, triglyceride; BP, blood pressure.
*Normal, BMI < 23; overweight, 23 ≤ BMI < 25; obese, BMI ≥ 25.
�Normal, T score > -1.0; osteopenia, -1.0 ≤ T score < -2.5; osteoporosis, T score ≥ -2.5.
Both obesity and osteoporosis are common diseases that affect millions of people. In recent decades, the association between obesity and osteoporosis has been actively inves- tigated both from an epidemiological standpoint and from a basic research standpoint, and common pathogenic links have been proposed.1-3,6,18Although it is generally accepted that obesity has a protective effect on bone tissue, some studies have revealed the opposite: that obesity is not bene- ficial or has a negative effect on osteoporosis.21The relation- ship between obesity and osteoporosis varies depending on how obesity is defined. If obesity is defined on the basis of BMI or body weight, obesity appears to be a protective fac- tor against bone mineral loss or vertebral fractures. How- ever, if obesity is based on the percentage body fat, obesity
DISCUSSION
Table 3. Metabolic Variables Affecting the Incidence of Osteoporotic Fractures
Variables Fracture Non-fracture OR (95% CI) p value
n (%) 189 (21%) 711 (79%)
Wt (kg) 57.47 ± 7.73 57.39 ± 7.04 0.182
BMI (kg/cm2) 24.58 ± 2.95 24.12 ± 2.78 0.946
Body fat (%) 35.47 ± 4.78 34.55 ± 4.83 0.038
Waist (cm) 90.68 ± 7.37 88.41 ± 8.10 0.008
Glucose (mg/dL) 86.62 ± 19.14 87.47 ± 18.54 0.310
HDLC (mg/dL) 52.14 ± 11.99 55.38 ± 13.74 0.011
TG (mg/dL) 129.44 ± 78.82 126.16 ± 69.11 0.448
Systolic BP 133.34 ± 17.20 130.92 ± 15.90 0.919
Metabolic SD
Yes 77 (24.37%) 239 (75.63%)
No 112 (19.18%) 472 (80.82%) 0.924 (0.570, 1.498) 0.748
BMI, body mass index; HDLC, high density lipoprotein cholesterol; TG, triglyceride; BP, blood pressure.
All variables are adjusted for age, smoking status, alcohol consumption, total calcium intake, total energy expenditure, and total calorie intake and variable of Wt (kg) is additionally adjusted by body fat (%), whereas variable of body fat (%) and waist (cm) are adjusted by Wt (kg), respectively.
Table 2. Metabolic Variables Relating to BMD
Lumbar Neck Trochanter Ward
F value p value F value p value F value p value F value p value Wt (kg) 5.53 < 0.001 6.21 < 0.001 7.51 < 0.001 4.91 < 0.001
Body fat (%) - 0.93 0.096 - 0.78 0.432 - 2.31 0.021 - 1.36 0.173
Waist (cm) - 2.09 0.037 - 5.07 < 0.001 - 4.58 < 0.001 - 5.01 < 0.001
Glucose (mg/dL) 2.36 0.016 2.13 0.033 2.65 0.008 1.02 0.309
HDL (mg/dL) 1.57 0.107 1.25 0.212 2.09 0.036 0.73 0.465
TG (mg/dL) 1.98 0.060 - 0.2 0.840 1.03 0.302 - 0.2 0.843
Systolic BP 0.6 0.592 - 0.77 0.438 - 1.45 0.148 - 1.26 0.207
BMD, bone mineral density; HDL, high density lipoprotein; TG, triglyceride; BP, blood pressure.
All variables are adjusted for age, smoking status, alcohol consumption, total calcium intake, total energy expenditure, and total calorie intake and variable of Wt (kg) is additionally adjusted by body fat (%), whereas variable of body fat (%) and waist (cm) are adjusted by Wt (kg), respectively.
Fig. 1. Odds ratios of vertebral fractures according to adiposity variables. All variables are adjusted for age, smoking status, alcohol consumption, total calcium intake, total energy expenditure, and total calorie intake and variable of Wt (kg) and BMI are additionally adjusted by body fat (%), whereas variable of body fat (%) and waist (cm) are adjusted by Wt (kg), respectively. BMI: body mass indices.
Weight 0.974 (0.938,1.012)
0.999 (0.916, 1.086)
1.064 (1.003, 1.029)
1.043 (1.011, 1.077)
BMI % Fat Waist
0.8 1 1.2
may be a risk factor for osteoporosis. Our data support that body weight is positively related with BMD and a protective factor for vertebral fractures, whereas percentage body fat and waist circumference are negatively related to BMD and a risk factor for vertebral fractures. These results are consistent with those of previous studies in the Chinese population.6,7Some studies have demonstrated that not only lean mass, but also fat mass contribute positively to
BMD.22-25 In one study, fat mass appeared to contribute
inversely to BMD at all sites in young men, but was posi- tively related to BMD at the forearm and calcaneous in older men.22However, the authors of this study did not adjust for body weight when calculating the effect of fat mass on BMD. We found that percentage body fat was positively related to BMD at all sites except the femur ward (p <
0.001, data not shown) when not adjusting for body weight.
When other variables including body weight were account- ed for, this direction became opposite. Waist circumference, which provides an indication of central obesity (visceral fat mass), is related to radius bone mineral density in postme- nopausal obese women, although BMI was not related to BMD in the same study.26,27Our data indicate that waist circumference (cm) is related to BMD (Table 2) and osteo- porotic vertebral fractures (Table 3).
Metabolic syndrome in relation to osteoporosis has been studied. In the Rancho Bernardo Study, after adjusting for BMI, metabolic syndrome was related to lower BMD.28 Furthermore, the incidence of osteoporotic non-vertebral fractures was elevated in subjects with metabolic synd- rome (MS). Therefore, metabolic syndrome could be a novel risk factor for osteoporosis. Accumulating evidence suggests that individual components of metabolic synd- rome such as hypertension, increased triglycerides, and reduced high-density lipoprotein cholesterol are also risk factors for low bone mineral density.29-31Clinical observa- tions of diabetes patients suggest that hyperglycemia is likely to reduce BMD and to increase the risk of osteoporo- tic fracture.32,33The high vertebral fracture of diabetes pati- ents can be explained by the fact that they are inclined to fall due to neuropathy or retinopathy. However, we found that serum glucose was positively correlated to lumbar, femur neck, and femur trochanter BMD (Table 2). As we excluded diabetic patients in our study, the average fasting serum glucose level among participating subjects were 87.26 ± 18.81 mg/dL. This relatively low glucose level could account for the apparently contradictory results. In another study, serum glucose levels were also positively related to BMD at the lumbar spine and femoral neck in postmenopausal women with primary hyperparathyroi- dism.34 Further investigation is required to evaluate whe- ther serum glucose levels have an effect on bone mineral density and risk of fractures.
The association between lipid profiles and BMD is also controversial. Turkish postmenopausal women with spine fractures had lower levels of total cholesterol, TG, and LDL- C than patients without fractures.35However, another study reported that elevated lipids, including total cholesterol and TG, are positively related to high BMD.36Some studies have demonstrated that high serum HDL is related to lower BMD in both pre- and postmenopausal women.37-39 Our data shows that high HDL protects against osteoporo- sis, increasing BMD, and lowering the odds ratio of osteo- porotic fractures (Tables 2 and 3). The mechanism by which lipids affect BMD and the risk of osteoporotic fractures is unclear, and needs to be investigated. The overall preval- ence of metabolic syndrome was not related to osteopo- rotic fractures (Table 3).
Our study has some limitations. To demonstrate that body composition is related to bone mineral density, body fat mass should be analyzed as visceral fat and subcutan- eous fat. Peripheral fat mass is not correlated to bone mine- ral density,40 whereas visceral fat (intra-abdominal fat) mass might have a linkage with BMD.41Imaging analysis using CT scans is also essential to evaluate the exact distribution of visceral fat and subcutaneous fat and their effects on bone.41There are possible errors to interpret the effect of fat tissue on low bone mineral density because fat tissue absorbs less radiation than lean tissue, so high per- centage fat could yield a false low BMD.42
In conclusion, high body weight and BMI are positively related to high BMD and might decrease the risk of verteb- ral fractures, whereas waist circumference and percentage body fat are negatively related to BMD and might increase the risk of vertebral fractures. Some components of meta- bolic syndrome were related to BMD and vertebral frac- tures. This common clinical linkage between obesity and osteoporosis indicates that co-treatment drugs or nutrients that can prevent and treat these chronic illnesses need to be developed in the future.
This study was partially supported by Korean Academy of Family Medicine in 2008. Also the authors thank to Drs.
Yangsoo Jang, Jong Ho Lee, and Sung Il Rho for support- ing this research.
1. Douchi T, Yamamoto S, Oki T, Maruta K, Kuwahata R, Yama- saki H, et al. Difference in the effect of adiposity on bone density between pre- and postmenopausal women. Maturitas 2000;34:
ACKNOWLEDGEMENTS
REFERENCES
261-6.
2. Guney E, Kisakol G, Ozgen G, Yilmaz C, Yilmaz R, Kabalak T.
Effect of weight loss on bone metabolism: comparison of vertical banded gastroplasty and medical intervention. Obes Surg 2003;
13:383-8.
3. Radak TL. Caloric restriction and calcium’s effect on bone meta- bolism and body composition in overweight and obese premeno- pausal women. Nutr Rev 2004;62:468-81.
4. Filip R, Raszewski G. Bone mineral density and bone turnover in relation to serum leptin, alpha-ketoglutarate and sex steroids in overweight and obese postmenopausal women. Clinical Endocri- nol (Oxf) 2009;70:214-20.
5. Reid IR. Relationships among body mass, its components, and bone. Bone 2002;31:547-55.
6. Zhao LJ, Liu YJ, Liu PY, Hamilton J, Recker RR, Deng HW.
Relationship of obesity with osteoporosis. J Clin Endocrinol Metab 2007;92:1640-6.
7. Hsu YH, Venners SA, Terwedow HA, Feng Y, Niu T, Li Z, et al.
Relation of body composition, fat mass, and serum lipids to osteo- porotic fractures and bone mineral density in Chinese men and women. Am J Clin Nutr 2006;83:146-54.
8. Janicka A, Wren TA, Sanchez MM, Dorey F, Kim PS, Mittelman SD, et al. Fat mass is not beneficial to bone in adolescents and young adults. J Clin Endocrinol Metab 2007;92:143-7.
9. Rosen CJ, Bouxsein ML. Mechanisms of disease: is osteoporosis the obesity of bone? Nat Clin Pract Rheumatol 2006;2:35-43.
10. Meunier P, Aaron J, Edouard C, Vignon G. Osteoporosis and the replacement of cell populations of the marrow by adipose tissue.
A quantitative study of 84 iliac bone biopsies. Clin Orthop Relat Res 1971;80:147-54.
11. Lecka-Czernik B, Moerman EJ, Grant DF, Lehmann JM, Manolagas SC, Jilka RL. Divergent effects of selective peroxi- some proliferator-activated receptor-gamma 2 ligands on adipocyte versus osteoblast differentiation. Endocrinology 2002;143:2376-84.
12. Akune T, Ohba S, Kamekura S, Yamaguchi M, Chung UI, Ku- bota N, et al. PPARgamma insufficiency enhances osteogenesis through osteoblast formation from bone marrow progenitors. J Clin Invest 2004;113:846-55.
13. Cornish J, Callon KE, Bava U, Lin C, Naot D, Hill BL, et al.
Leptin directly regulates bone cell function in vitro and reduces bone fragility in vivo. J Endocrinol 2002;175:405-15.
14. Luo XH, Guo LJ, Xie H, Yuan LQ, Wu XP, Zhou HD, et al.
Adiponectin stimulates RANKL and inhibits OPG expression in human osteoblasts through the MAPK signaling pathway. J Bone Miner Res 2006;21:1648-56.
15. Luo XH, Guo LJ, Yuan LQ, Xie H, Zhou HD, Wu XP, et al.
Adiponectin stimulates human osteoblasts proliferation and differ- entiation via the MAPK signaling pathway. Exp Cell Res 2005;
309:99-109.
16. Steppan CM, Crawford DT, Chidsey-Frink KL, Ke H, Swick AG. Leptin is a potent stimulator of bone growth in ob/ob mice.
Regul Pept 2000;92:73-8.
17. Tong PC, Kong AP, So WY, Yang X, Ho CS, Ma RC, et al. The usefulness of the International Diabetes Federation and the National Cholesterol Education Program’s Adult Treatment Panel III definitions of the metabolic syndrome in predicting coronary heart disease in sub-jects with type 2 diabetes. Diabetes Care 2007;30:1206-11.
18. Ferrar L, Jiang G, Adams J, Eastell R. Identification of vertebral fractures: an update. Osteoporos Int 2005;16:717-28.
19. Ribas-Barba L, Serra-Majem L, Román-Viñas B, Ngo J, García- Alvarez A. Effects of dietary assessment methods on assessing risk of nutrient intake adequacy at the population level: from theory to practice. Br J Nutr 2009;101 Suppl 2:S64-72.
20. Kim WY, Kim JE, Choi YJ, Huh KB. Nutritional risk and meta- bolic syndrome in Korean type 2 diabetes mellitus. Asia Pac J Clin Nutr 2008;17 Suppl 1:47-51.
21. Holecki M, Zahorska-Markiewicz B, Wiecek A, Nieszporek T, Zak-Golab A. [Obesity and bone metabolism]. Endokrynol Pol 2008;59:218-23.
22. Cui LH, Shin MH, Kweon SS, Park KS, Lee YH, Chung EK, et al. Relative contribution of body composition to bone mineral density at different sites in men and women of South Korea. J Bone Miner Metab 2007;25:165-71.
23. El Hage RP, Courteix D, Benhamou CL, Jacob C, Jaffré C.
Relative importance of lean and fat mass on bone mineral density in a group of adolescent girls and boys. Eur J Appl Physiol 2009;
105:759-64.
24. Lekamwasam S, Weerarathna T, Rodrigo M, Arachchi WK, Munidasa D. Association between bone mineral density, lean mass, and fat mass among healthy middle-aged premenopausal women: a cross-sectional study in southern Sri Lanka. J Bone Miner Metab 2009;27:83-8.
25. Leslie WD, Miller N, Rogala L, Bernstein CN. Body mass and composition affect bone density in recently diagnosed inflamma- tory bowel disease: the Manitoba IBD Cohort Study. Inflamm Bowel Dis 2009;15:39-46.
26. Tarquini B, Navari N, Perfetto F, Piluso A, Romano S, Tarquini R. Evidence for bone mass and body fat distribution relationship in postmenopausal obese women. Arch Gerontol Geriatr 1997;
24:15-21.
27. Carrasco F, Ruz M, Rojas P, Csendes A, Rebolledo A, Codoceo J, et al. Changes in bone mineral density, body composition and adiponectin levels in morbidly obese patients after bariatric surgery.
Obes Surg 2009;19:41-6.
28. von Muhlen D, Safii S, Jassal SK, Svartberg J, Barrett-Connor E.
Associations between the metabolic syndrome and bone health in older men and women: the Rancho Bernardo Study. Osteoporos Int 2007;18:1337-44.
29. McFarlane SI. Bone metabolism and the cardiometabolic syndro- me: pathophysiologic insights. J Cardiometab Syndr 2006;1:53-7.
30. Cui LH, Shin MH, Chung EK, Lee YH, Kweon SS, Park KS, et al. Association between bone mineral densities and serum lipid profiles of pre- and post-menopausal rural women in South Korea. Osteoporos Int 2005;16:1975-81.
31. Yamaguchi T, Sugimoto T, Yano S, Yamauchi M, Sowa H, Chen Q, et al. Plasma lipids and osteoporosis in postmenopausal women. Endocr J 2002;49:211-7.
32. Pinheiro MM, Ciconelli RM, Martini LA, Ferraz MB. Clinical risk factors for osteoporotic fractures in Brazilian women and men:
the Brazilian Osteoporosis Study (BRAZOS). Osteoporos Int 2009;20:399-408.
33. Melton LJ 3rd, Leibson CL, Achenbach SJ, Therneau TM, Khosla S. Fracture risk in type 2 diabetes: update of a population- based study. J Bone Miner Res 2008;23:1334-42.
34. Hisa I, Kaji H, Inoue Y, Sugimoto T, Chihara K. Fasting plasma glucose levels are related to bone mineral density in postmeno- pausal women with primary hyperparathyroidism. Int J Clin Exp Med 2008;1:319-26.
35. Sivas F, Alemdaroǧlu E, Elverici E, KuluǧT, Ozoran K. Serum
lipid profile: its relationship with osteoporotic vertebrae fractures and bone mineral density in Turkish postmenopausal women.
Rheumatol Int 2009;29:885-90.
36. Brownbill RA, Ilich JZ. Lipid profile and bone paradox: higher serum lipids are associated with higher bone mineral density in postmenopausal women. J Womens Health (Larchmt) 2006;15:
261-70.
37. D’Amelio P, Di Bella S, Tamone C, Ravazzoli MG, Cristofaro MA, Di Stefano M, et al. HDL cholesterol and bone mineral density in normal-weight postmenopausal women: is there any possible association? Panminerva Med 2008;50:89-96.
38. Dennison EM, Syddall HE, Aihie Sayer A, Martin HJ, Cooper C;
Hertfordshire Cohort Study Group. Lipid profile, obesity and bone mineral density: the Hertfordshire Cohort Study. QJM 2007;100:297-303.
39. Makovey J, Chen JS, Hayward C, Williams FM, Sambrook PN.
Association between serum cholesterol and bone mineral density.
Bone 2009;44:208-13.
40. Kuwahata A, Kawamura Y, Yonehara Y, Matsuo T, Iwamoto I, Douchi T. Non-weight-bearing effect of trunk and peripheral fat mass on bone mineral density in pre- and post-menopausal women.
Maturitas 2008;60:244-7.
41. Chen C, Tong N, Ran X, Yang D. [The relationship between obesity, intra-abdominal fat area and bone mineral density and bone strength]. Sheng Wu Yi Xue Gong Cheng Xue Za Zhi 2002;
19:471-2, 475.
42. Farrell TJ, Webber CE. The error due to fat inhomogeneity in lumbar spine bone mineral measurements. Clin Phys Physiol Meas 1989;10:57-64.