Association between Abdominal Obesity and Lumbar Bone Mineral Density According to the
Postmenopausal Period in Korean Women
Hyun Young Kim1, Sung Soo Kim1,2,*, Jong Sung Kim1,2, Jin Gyu Jung1,2, Seok Joon Yoon1,2, Young Hee Jo1
1Department of Family Medicine, Chungnam National University Hospital, Daejeon; 2Department of Family Medicine, Chungnam National University College of Medicine, Daejeon, Korea
Background: This study aimed to evaluate the association between abdominal obesity and lumbar bone min- eral density (BMD) according to the postmenopausal period of Korean women.
Methods: This was a cross-sectional study. Among the 1,923 women enrolled, 1,138 were included in the study; 785 women were excluded based on conditions that might have affected their bone density. Subjects were divided into short postmenopausal period (SPP, 0-5 years after menopause) and long postmenopausal pe- riod (LPP, 6-10 years after menopause). The association between abdominal obesity (waist circumference ≥85 cm) and lumbar BMD according to postmenopausal period in Korean women was assessed.
Results: After adjusting for age, exercise amount, alcohol consumption, skeletal muscle mass, and body fat mass, the adjusted odds ratio (OR) for osteoporosis in the group with abdominal obesity compared to the group without abdominal obesity was 0.38 (95% confidence interval [CI], 0.16-0.88; P=0.023) in the SPP group. How- ever, in the LPP and total groups, the adjusted ORs were not significant. The adjusted ORs for low bone mass showed no significance in the SPP, LPP, and total groups.
Conclusion: In the SPP group, the risk of osteoporosis was lower in the group with abdominal obesity than in the group without abdominal obesity. However, in the LPP group, no significant difference was found. Therefore, the effect of abdominal obesity on lumbar BMD may be just for a short period after menopause (0-5 years).
Key words: Abdominal obesity, Bone mineral density, Menopause
Received June 5, 2017 Reviewed July 3, 2017 Accepted September 12, 2017
* Corresponding author Sung Soo Kim
http://orcid.org/0000-0001-9417-7728 Department of Family Medicine, Chungnam National University Hospital, 282 Munhwa-ro, Jung-gu, Daejeon 35015, Korea
Tel: +82-42-280-8111 Fax: +82-42-280-8373 Email: [email protected]
INTRODUCTION
Osteoporosis is a common metabolic disorder, with a prevalence of approximately 24% among Korean women. The risk of osteopo- rosis increases by more than 7 times after menopause than before menopause.
1Postmenopausal osteoporosis is associated with bone loss due to postmenopausal estrogen deficiency. Such bone loss progresses rapidly during 5-10 years after menopause, after which point it begins to slow.
2Obesity occurs mostly due to genetic and environmental factors.
Estrogen deficiency in postmenopausal women is associated with
obesity. As women experience menopause, their risk of developing obesity and metabolic syndrome increases by more than 3 times compared to before menopause, while estrogen therapy can reduce visceral fat tissue.
3Considering these points, it is expected that the risk of post- menopausal osteoporosis would increase in obese postmenopausal women. Based on actual clinical trials, the association between body mass index (BMI) and bone mineral density (BMD) is al- ready well-known. However, reported associations between ab- dominal obesity and bone density in postmenopausal women have varied, with some reporting a positive correlation
4-6while others
Copyright © 2017 Korean Society for the Study of Obesity
This is an Open Access article distributed under the terms of the Creative Commons Attribution Non-Commercial License (http://creativecommons.org/licenses/by-nc/4.0/) which per- mits unrestricted non-commercial use, distribution, and reproduction in any medium, provided the original work is properly cited.
Original Article
eISSN 2508-75762017-03-16 https://crossmark-cdn.crossref.org/widget/v2.0/logos/CROSSMARK_Color_square.svg
Association between Abdominal Obesity and Lumbar Bone Mineral Density According to the
Postmenopausal Period in Korean Women
Hyun Young Kim1, Sung Soo Kim1,2,*, Jong Sung Kim1,2, Jin Gyu Jung1,2, Seok Joon Yoon1,2, Young Hee Jo1
1Department of Family Medicine, Chungnam National University Hospital, Daejeon; 2Department of Family Medicine, Chungnam National University College of Medicine, Daejeon, Korea
Background: This study aimed to evaluate the association between abdominal obesity and lumbar bone min- eral density (BMD) according to the postmenopausal period of Korean women.
Methods: This was a cross-sectional study. Among the 1,923 women enrolled, 1,138 were included in the study; 785 women were excluded based on conditions that might have affected their bone density. Subjects were divided into short postmenopausal period (SPP, 0-5 years after menopause) and long postmenopausal pe- riod (LPP, 6-10 years after menopause). The association between abdominal obesity (waist circumference ≥85 cm) and lumbar BMD according to postmenopausal period in Korean women was assessed.
Results: After adjusting for age, exercise amount, alcohol consumption, skeletal muscle mass, and body fat mass, the adjusted odds ratio (OR) for osteoporosis in the group with abdominal obesity compared to the group without abdominal obesity was 0.38 (95% confidence interval [CI], 0.16-0.88; P=0.023) in the SPP group. How- ever, in the LPP and total groups, the adjusted ORs were not significant. The adjusted ORs for low bone mass showed no significance in the SPP, LPP, and total groups.
Conclusion: In the SPP group, the risk of osteoporosis was lower in the group with abdominal obesity than in the group without abdominal obesity. However, in the LPP group, no significant difference was found. Therefore, the effect of abdominal obesity on lumbar BMD may be just for a short period after menopause (0-5 years).
Key words: Abdominal obesity, Bone mineral density, Menopause
Received June 5, 2017 Reviewed July 3, 2017 Accepted September 12, 2017
* Corresponding author Sung Soo Kim
http://orcid.org/0000-0001-9417-7728 Department of Family Medicine, Chungnam National University Hospital, 282 Munhwa-ro, Jung-gu, Daejeon 35015, Korea
Tel: +82-42-280-8111 Fax: +82-42-280-8373 Email: [email protected]
reporting negative correlation
7or no association.
8,9Most of the studies that examined the association between ab- dominal obesity and bone density in women considered the meno- pausal status, but not the postmenopausal period. Since bone loss due to estrogen deficiency progresses rapidly about 5-10 years after menopause, the postmenopausal period is an important factor when assessing bone density. Therefore, we evaluated the associa- tion between abdominal obesity and lumbar BMD according to postmenopausal period in Korean women.
METHODS Subjects
Among women who underwent bone density testing at Chun- gnam National University Hospital Health Promotion Center be- tween March 2014 and July 2016, a total of 1,923 women within 10 years after menopause were identified as candidates for our study. Subsequently, 785 women were excluded based on condi- tions that might have affected their bone density (16 patients with hyperthyroidism or rheumatoid arthritis; 155 women taking cal- cium, vitamin D, or drugs for osteoporosis; 31 patients receiving estrogen therapy; 104 patients with restrictions on bone density as- sessment due to scoliosis, artifact, severe osteoarthritis, soft tissue calcification or spinal operation; 446 women whose menopausal age could not be confirmed due to missing medical records or hys- terectomy; 27 current or ex-smokers; and 6 women whose diet in- cluded functional foods for menopause). As a result, a final total of 1,138 women were selected as study subjects. This study was ap- proved by the Institutional Review Board of Chungnam National University Hospital (IRB No. 2016-08-010). The informed con- sent was exempted from the Institutional Review Board because this study is a retrospective and analytical study.
Data collection
Patient information including medical history, current medica- tions, menopausal age, smoking status, amount of alcohol con- sumption per week, occupation, and amount of exercise per week was obtained from a self-report questionnaire filled out during health screening.
The study selected women within 10 years after menopause
since postmenopausal bone loss progresses rapidly from 5 to 10 years after menopause and slows down thereafter.
2The subjects were divided into 2 groups; postmenopausal period of 0 to 5 years (short postmenopausal period, SPP) and postmenopausal period of 6 to 10 years (long postmenopausal period, LPP).
The amount of alcohol consumption was assessed by the frequen- cy of alcohol consumption per week and amount of alcohol con- sumption per sitting for the past 1 year as reported in the health questionnaire, with 14 g of alcohol defined as 1 standard drink (here- after “drink”) based on National Institute on Alcohol Abuse and Al- coholism (NIAAA) criteria.
10For the amount of exercise per week, those who exercised at least 30 minutes per week were assigned to the exercise group, while those who exercised less than 30 min or did not exercise at all were assigned to the non-exercise group.
Height was measured in cm using an automatic height meter.
Weight was measured after at least 12 hours of fasting in kg with the patient wearing an examination gown. BMI was calculated as weight (kg) divided by height squared (m
2). A BMI 18.4 or less was defined as underweight; 18.5 to 24.9 as normal; 25 to 29.9 as class 1 obesity; and 30 or more as class 2 obesity. Waist circumfer- ence (WC) was measured in cm at late expiration with a tape mea- sure place above the iliac crest and parallel to the floor. A WC of 84.9 or less cm was defined as a normal waist and 85 or more cm was defined as abdominal obesity. The definition of obesity (BMI and WC) was obtained from the Korean Society for the Study of Obesity.
11We measured skeletal muscle mass and body fat mass with a Bioimpedance fat analyzer (InBody 770, Biospace Inc., Seoul, Korea).
BMD was measured in the lumbar spine (1st to 4th lumbar ver- tebrae) using dual energy X-ray absorptiometry (DXA). A Discov- ery (Hologic Inc., MA, USA) scanner was used in this study. The lumbar BMD of 30 patients was measured with two consecutive measurements per patient. The precision error of the lumbar BMD measurement was 1.4%, which was lower than the minimum ac- ceptable precision error of 1.9% for the lumbar spine.
12Since postmenopausal osteoporosis mostly involves the loss of trabecular bone, the femur, which is comprised mostly of cortical bone, was not included.2 Based on their T-scores, the patients were classified as normal BMD (≥ -1.0), low bone mass (> -2.5 and<
-1.0) and osteoporosis (≤ -2.5).
12Statistical analysis
The general characteristics of each group were analyzed with t- tests and the Chi-square test. To assess the effects of age, meno- pausal age, height, weight, WC, skeletal muscle mass, body fat mass, amount of exercise per week, and alcohol consumption per week on bone density according to postmenopausal period, one- way ANOVA was performed after dividing the subjects into nor- mal BMD, low bone mass, and osteoporosis groups.
A logistic regression analysis was performed to assess the effects of abdominal obesity on bone density. The odds ratios based on
abdominal obesity were calculated after adjusting for age, exercise amount, alcohol consumption, skeletal muscle mass, and body fat mass. The statistics program used was SPSS for Window version 18.0 (SPSS Inc., Chicago, USA), while the significance level was set to P=0.05.
RESULTS Subject general characteristics
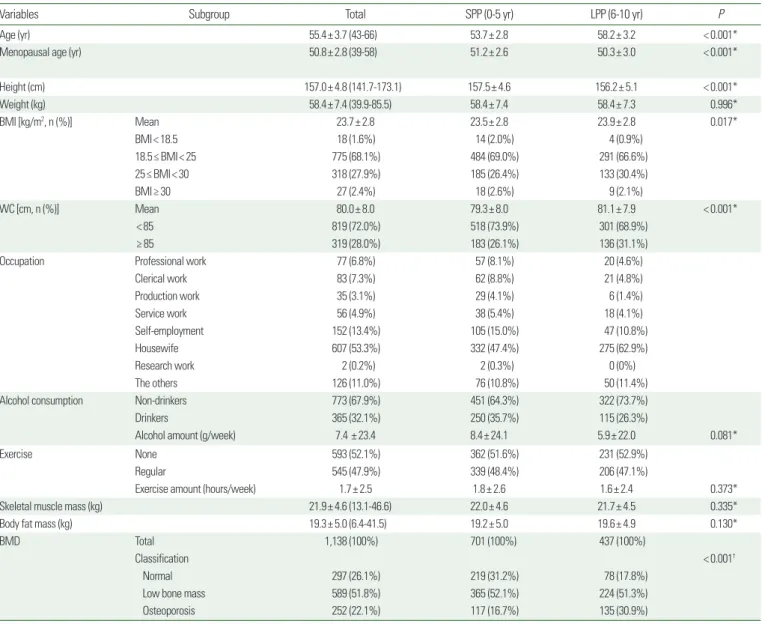
General characteristics of the subjects are summarized in Table 1.
Table 1. Subject general characteristics
Variables Subgroup Total SPP (0-5 yr) LPP (6-10 yr) P
Age (yr) 55.4± 3.7 (43-66) 53.7± 2.8 58.2± 3.2 < 0.001*
Menopausal age (yr) 50.8± 2.8 (39-58) 51.2± 2.6 50.3± 3.0 < 0.001*
Height (cm) 157.0± 4.8 (141.7-173.1) 157.5± 4.6 156.2± 5.1 < 0.001*
Weight (kg) 58.4± 7.4 (39.9-85.5) 58.4± 7.4 58.4± 7.3 0.996*
BMI [kg/m2, n (%)] Mean 23.7± 2.8 23.5± 2.8 23.9± 2.8 0.017*
BMI< 18.5 18 (1.6%) 14 (2.0%) 4 (0.9%)
18.5≤ BMI< 25 775 (68.1%) 484 (69.0%) 291 (66.6%)
25≤ BMI< 30 318 (27.9%) 185 (26.4%) 133 (30.4%)
BMI≥ 30 27 (2.4%) 18 (2.6%) 9 (2.1%)
WC [cm, n (%)] Mean 80.0± 8.0 79.3± 8.0 81.1± 7.9 < 0.001*
< 85 819 (72.0%) 518 (73.9%) 301 (68.9%)
≥ 85 319 (28.0%) 183 (26.1%) 136 (31.1%)
Occupation Professional work 77 (6.8%) 57 (8.1%) 20 (4.6%)
Clerical work 83 (7.3%) 62 (8.8%) 21 (4.8%)
Production work 35 (3.1%) 29 (4.1%) 6 (1.4%)
Service work 56 (4.9%) 38 (5.4%) 18 (4.1%)
Self-employment 152 (13.4%) 105 (15.0%) 47 (10.8%)
Housewife 607 (53.3%) 332 (47.4%) 275 (62.9%)
Research work 2 (0.2%) 2 (0.3%) 0 (0%)
The others 126 (11.0%) 76 (10.8%) 50 (11.4%)
Alcohol consumption Non-drinkers 773 (67.9%) 451 (64.3%) 322 (73.7%)
Drinkers 365 (32.1%) 250 (35.7%) 115 (26.3%)
Alcohol amount (g/week) 7.4 ± 23.4 8.4± 24.1 5.9± 22.0 0.081*
Exercise None 593 (52.1%) 362 (51.6%) 231 (52.9%)
Regular 545 (47.9%) 339 (48.4%) 206 (47.1%)
Exercise amount (hours/week) 1.7± 2.5 1.8± 2.6 1.6± 2.4 0.373*
Skeletal muscle mass (kg) 21.9± 4.6 (13.1-46.6) 22.0± 4.6 21.7± 4.5 0.335*
Body fat mass (kg) 19.3± 5.0 (6.4-41.5) 19.2± 5.0 19.6± 4.9 0.130*
BMD Total 1,138 (100%) 701 (100%) 437 (100%)
Classification < 0.001†
Normal 297 (26.1%) 219 (31.2%) 78 (17.8%)
Low bone mass 589 (51.8%) 365 (52.1%) 224 (51.3%)
Osteoporosis 252 (22.1%) 117 (16.7%) 135 (30.9%)
Values are expressed as mean± standard deviation (SD) or number (min. to max. or %).
*Obtained by t-test; †Obtained by Chi-square test for categorical variables in BMD.
SPP, short postmenopausal period (0-5 years after menopause); LPP, long postmenopausal period (6-10 years after menopause); BMI, body mass index; WC, waist circumference; Regular exer- cise, more than 30 min per week; BMD, bone mineral density (L1 to L4); Normal, T-score ≥ -1.0; Low bone mass, -2.5 < T-score < -1.0; Osteoporosis, T-score ≤ -2.5.
Weight, skeletal muscle mass, body fat mass, alcohol consumption, and exercise amount were not significantly different between the SPP and LPP groups. Menopausal age and height were significantly higher in the SPP than in the LPP. WC and BMI were significantly higher in the LPP than in the SPP.
Lumbar BMD was significantly higher in the SPP group than in the LPP group (0.893± 0.115, 0.845± 0.114, P<0.001). There was a significant difference between the SPP and the LPP groups in terms of the proportion of normal, low bone mass, and osteopo- rosis groups (P<0.001). The proportions of normal, low bone mass, and osteoporosis groups were 31.2%, 52.1%, and 16.7% in the SPP group, versus 17.8%, 51.3%, and 30.9% in the LPP group, respectively.
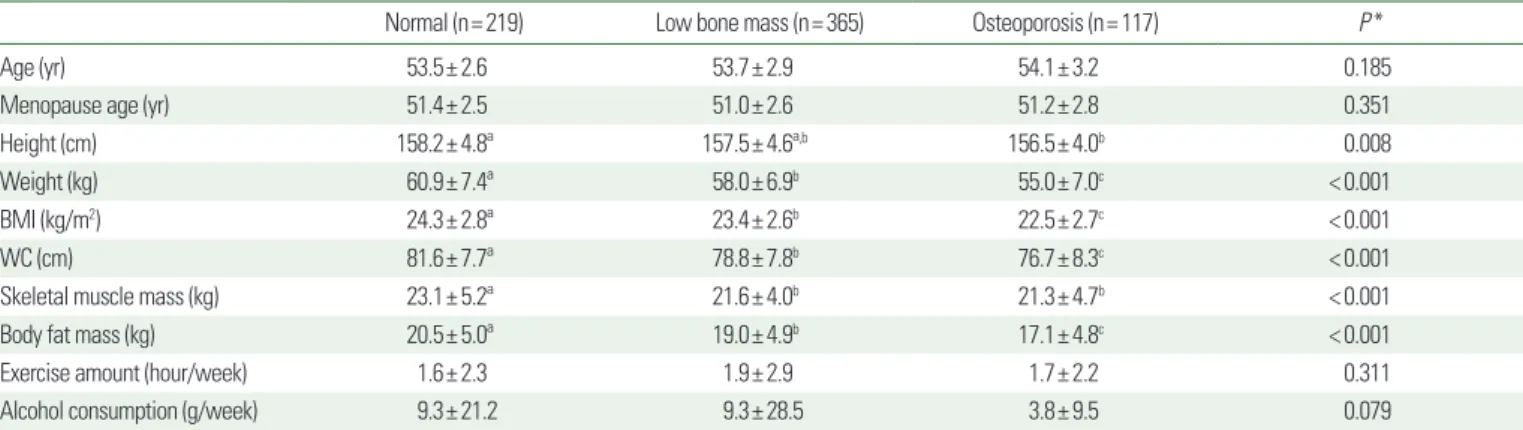
Factors related to BMD in women with a short postmenopausal period (0 to 5 years)
Table 2 shows the factors related to BMD in women with a post- menopausal period of 0 to 5 years. Height was significantly less in the osteoporosis group than in the normal BMD group (P=0.008).
Skeletal muscle mass was significantly higher in the normal BMD group than in the low bone mass and osteoporosis groups (P<
0.001). Weight, BMI, WC, and body fat mass were significantly the highest to lowest in the normal, low bone mass, and osteoporosis groups (P<0.001). Age, menopausal age, exercise amount, and al- cohol consumption were not significantly different among the three groups.
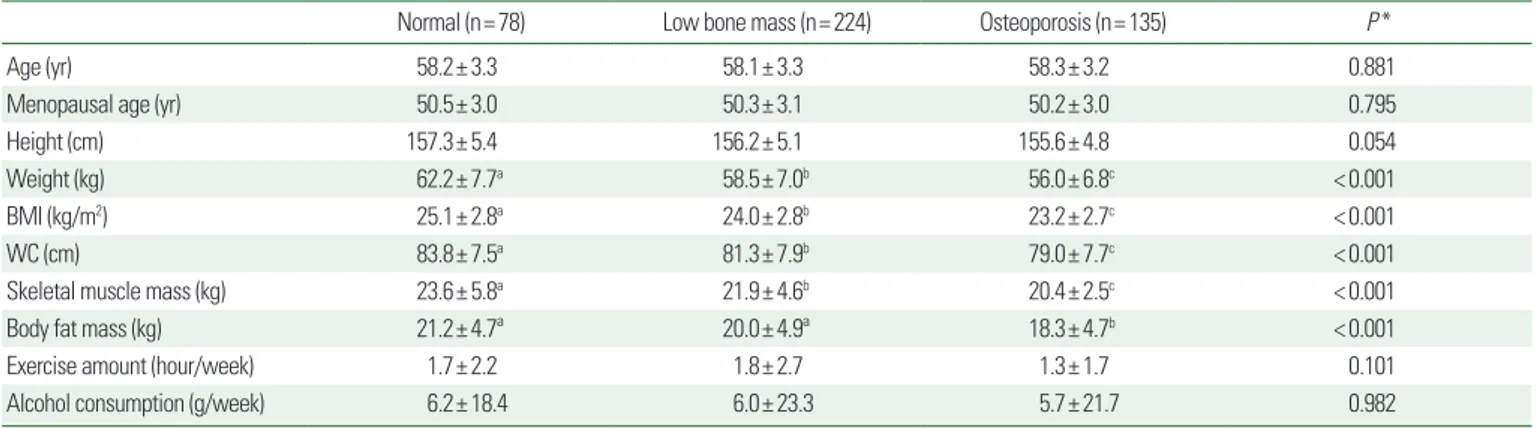
Factors related to BMD in women with a long postmenopausal period (6 to 10 years)
Table 3 shows factors related to BMD in women with a post- menopausal period of 6 to 10 years. Weight, BMI, WC, and skeletal muscle mass were significantly the highest to lowest in the normal, low bone mass, and osteoporosis groups (P <0.001). Body fat mass was significantly higher in the normal and low bone mass groups than in the osteoporosis groups (P<0.001). Age, meno- pausal age, height, exercise amount, and alcohol consumption were not significantly different among the three groups.
Odds ratios for low bone mass and osteoporosis according to abdominal obesity
After adjusting for age, exercise amount, alcohol consumption, skeletal muscle mass, and body fat mass, the adjusted odds ratio (OR) for low bone mass in the group with abdominal obesity in comparison with the group without abdominal obesity in the SPP group was 0.76 (95% confidence interval [CI], 0.45-1.29; P = 0.314), 1.20 (95% CI, 0.56-2.54; P=0.642) in the LPP group and 0.89 (95% CI, 0.58-1.36; P=0.592) in the total group, which were not significant. In addition, after adjusting for age, exercise amount, alcohol consumption, skeletal muscle mass, and body fat mass, the adjusted OR for osteoporosis in the group with abdominal obesity in comparison with the group without abdominal obesity in the SPP group was 0.38 (95% CI, 0.16-0.88; P=0.023), which was sig- nificant. However, in the LPP and total groups, the ORs were 1.33
Table 2. Factors related to BMD in women with a short postmenopausal period (0-5 yr)Normal (n= 219) Low bone mass (n= 365) Osteoporosis (n= 117) P *
Age (yr) 53.5± 2.6 53.7± 2.9 54.1± 3.2 0.185
Menopause age (yr) 51.4± 2.5 51.0± 2.6 51.2± 2.8 0.351
Height (cm) 158.2± 4.8ª 157.5± 4.6ª,b 156.5± 4.0b 0.008
Weight (kg) 60.9± 7.4ª 58.0± 6.9b 55.0± 7.0c < 0.001
BMI (kg/m2) 24.3± 2.8ª 23.4± 2.6b 22.5± 2.7c < 0.001
WC (cm) 81.6± 7.7ª 78.8± 7.8b 76.7± 8.3c < 0.001
Skeletal muscle mass (kg) 23.1± 5.2ª 21.6± 4.0b 21.3± 4.7b < 0.001
Body fat mass (kg) 20.5± 5.0ª 19.0± 4.9b 17.1± 4.8c < 0.001
Exercise amount (hour/week) 1.6± 2.3 1.9± 2.9 1.7± 2.2 0.311
Alcohol consumption (g/week) 9.3± 21.2 9.3± 28.5 3.8± 9.5 0.079
Values are expressed as mean± standard deviation (SD).
*Obtained by one-way ANOVA test, the same letters indicate non-significant differences between groups based on Tukey’s multiple comparison test.
BMD, bone mineral density; Short postmenopausal period, 0-5 years after menopause; Normal, T-score ≥ -1.0; Low bone mass, -2.5 < T-score < -1.0; Osteoporosis, T-score ≤ -2.5;
BMI, body mass index; WC, waist circumference.
(95% CI, 0.52-3.37; P=0.551) and 0.66 (95% CI, 0.36-1.22; P=
0.186), respectively, which were not significant (Table 4).
DISCUSSION
The purpose of this study was to evaluate the association be- tween abdominal obesity and lumbar BMD according to post- menopausal period in Korean women. The association between abdominal obesity and BMD is controversial.
In this study, patients in the LPP group (6 to 10 years after menopause) showed a lower BMD and a higher proportion of os- teoporosis than those in the SPP group (0 to 5 years after meno- pause) (Table 1). This result correlates with a previous study that showed decreased BMD and increased incidence of osteoporosis as age increased occurred in postmenopausal women.
13Weight, BMI, WC, skeletal muscle mass, and body fat mass in the osteoporotic group were significantly lower than in the normal BMD group regardless of short and long postmenopausal periods (Tables 2 and 3). These results were similar to study results that showed BMD was positively associated with WC, and that WC in osteoporotic women was significantly lower than in women with- out osteoporosis.
4-6The BMI of Korean men is the highest when they are in their thirties to fifties and decreases when they are in their sixties, where- as the BMIs of Korean women increase continuously until they are in their sixties. The WC of men remain consistent from when they are in their thirties to when they are in their seventies, whereas those of women increase gradually with age and increase rapidly af- ter their fifties.
14This study similarly found that the LPP group with a higher age had a significantly higher BMI and WC than the SPP
Table 3. Factors related to BMD in women with a long postmenopausal period (6-10 yr)Normal (n= 78) Low bone mass (n= 224) Osteoporosis (n= 135) P *
Age (yr) 58.2± 3.3 58.1± 3.3 58.3± 3.2 0.881
Menopausal age (yr) 50.5± 3.0 50.3± 3.1 50.2± 3.0 0.795
Height (cm) 157.3± 5.4 156.2± 5.1 155.6± 4.8 0.054
Weight (kg) 62.2± 7.7a 58.5± 7.0b 56.0± 6.8c < 0.001
BMI (kg/m2) 25.1± 2.8a 24.0± 2.8b 23.2± 2.7c < 0.001
WC (cm) 83.8± 7.5a 81.3± 7.9b 79.0± 7.7c < 0.001
Skeletal muscle mass (kg) 23.6± 5.8a 21.9± 4.6b 20.4± 2.5c < 0.001
Body fat mass (kg) 21.2± 4.7ª 20.0± 4.9ª 18.3± 4.7b < 0.001
Exercise amount (hour/week) 1.7± 2.2 1.8± 2.7 1.3± 1.7 0.101
Alcohol consumption (g/week) 6.2± 18.4 6.0± 23.3 5.7± 21.7 0.982
Values are expressed as mean± standard deviation (SD).
*Obtained using the one-way ANOVA test, the same letters indicate non-significant differences between groups based on Tukey’s multiple comparison test.
BMD, bone mineral density; Long postmenopausal period, 6-10 years after menopause; Normal, T-score ≥ -1.0; Low bone mass, -2.5 < T-score < -1.0; Osteoporosis, T-score ≤ -2.5;
BMI, body mass index; WC, waist circumference.
Table 4. Odds ratios for low bone mass and osteoporosis according to abdominal obesity
Postmenopausal period (yr) WC (cm) N Low bone mass Osteoporosis
OR* P † OR* P †
SPP (0 to 5) < 85 518 1 1
≥ 85 183 0.76 (0.45-1.29) 0.314 0.38 (0.16-0.88) 0.023
LPP (6 to 10) < 85 301 1 1
≥ 85 136 1.20 (0.56-2.54) 0.642 1.33 (0.52-3.37) 0.551
Total (0 to 10) < 85 819 1 1
≥ 85 319 0.89 (0.58-1.36) 0.592 0.66 (0.36-1.22) 0.186
All values are adjusted by age, amount of exercise per week, alcohol consumption per week, skeletal muscle mass, and body fat mass with a 95% confidence interval.
*Odds ratios were obtained using multiple logistic regression analysis; †Obtained by logistic regression analysis.
SPP, short postmenopausal period (0-5 years after menopause); LPP, long postmenopausal period (6-10 years after menopause); WC, waist circumference; WC ≥ 85 cm, abdominal obesity.