Copyright © 2017 The Korean Society for Bone and Mineral Research
This is an Open Access article distributed under the terms of the Creative Commons Attribution Non-Commercial Li- cense (http://creativecommons.org/licenses/by-nc/4.0/) which permits unrestricted non-commercial use, distribu- tion, and reproduction in any medium, provided the original work is properly cited.
Comparison of Bone Mineral Density and Appendicular Lean Body Mass between Osteoporotic Distal Radius Fracture and
Degenerative Rotator Cuff Tear in Women Patients
Jun-Ku Lee1, Byung-Ho Yoon1, Kyunghun Jung2, Gotak Kim2, Soo-Hong Han2
1Department of Orthopaedic Surgery, Seoul Paik Hospital, Inje University College of Medicine, Seoul;
2Department of Orthopaedic Surgery, Bundang CHA Medical Center, CHA University School of Medicine, Seongnam, Korea
Background: Authors assessed lean body mass (fat free tissue), upper and lower, and bone mineral density (BMD) in patients of osteoporotic bone distal radius fracture (DRF) and degenerative rotator cuff tear (RCT) patients of shoulder. We predict inferior muscle mass and osteoporosis are more frequent in DRF group than RCT group. Methods: Be- tween January 2016 and June 2017, overall 38 of DRF and 30 of RCT were eligible for this retrospective comparison study after excluding of patients with compounding fac- tors. BMD and other body composition, fat and lean body mass, were assessed with a single dual energy X-ray absorptiometry in one hospital. Results: T-score of spine were -2.2 and -1.6 in DRF and RCT patients with significant difference (P=0.040). Final BMD score, lower score of patient between spine and femoral score, of both group also pre- sented difference with significance, -2.4 of DRF and -1.9 of RCT patients (P=0.047). Diag- nosis of osteoporosis was confirmed in 19 patients (50%) from DRF compared with 9 pa- tients (30%) from RCT. The mean lean soft tissue mass of the arm was 3.7 kg and 3.8 kg in the DRF and RCT, respectively, without significant difference (P=0.882). The mean lean body mass of the leg was 11.0 kg and 10.5 kg in the DRF and RCT, respectively, with- out significant difference (P=0.189). The relative overall appendicular lean mass was not significantly different between groups. Conclusions: Even though BMD difference, we did not find muscle mass difference between DRF and RCT patients.
Key Words: Bone density, Muscle strength, Osteoporosis, Radius fractures, Upper ex- tremity
INTRODUCTION
With ageing process, bone mineral density (BMD) and muscle mass progres- sively reduce. Significant BMD downward, osteoporosis, is related with fragile bone fracture and has been empathized in previous literatures.[1,2] Recently not only bone density, quantitative and qualitative muscular impairment, known as sarcopenia, is drawing attentions and is related with muscle strength decrease, functional impairment, risks of daily activity fall and fracture, delayed recovery from injury, and even mortality.[3-6]
Corresponding author Soo-Hong Han
Department of Orthopaedic Surgery, Bundang CHA Medical Center, CHA University School of Medicine, 59 Yatap-ro, Bundang-gu, Seongnam 13496, Korea
Tel: +82-31-780-5273 Fax: +82-31-708-3578 E-mail: [email protected] Received: October 23, 2017 Revised: November 23, 2017 Accepted: November 24, 2017
No potential conflict of interest relevant to this article was reported.
Original Article
pISSN 2287-6375 eISSN 2287-7029
Distal radius fracture (DRF) accounts for approximately 16% of all fractures treated by orthopedic surgeons.[7]
Contrast to high energy induced DRF, relatively young (5- 24 years old) and predominantly male population, DRF in an elderly, predominantly female population commonly occurred with low energy like trivial daily activity.[8]
On the contrary, rotator cuff tear (RCT) of shoulder are prevalent in aged, dominant arm, and male patient, over- use, micro-trauma, impingement.[9-12] Occupational health data have shown that physically demanding work tasks are an independent risk factor for the development of symp- tomatic rotator cuff disease.[13-15] Moreover, dominant arm prevalence indirectly means activity level has a risk factor for RCT.[10]
There have been studies in lower extremity about mus- cle mass and resulting sarcopenia, however, relatively rare studies were carried out in upper extremity.[5,16-20] There- fore, we started surveying of muscle mass in patients of osteoporotic DRF and symptomatic degenerative RCT.
Roh et al.[18] reported a higher prevalence of sarcopenia in patients with DRF compared to age- and sex-matched controls.[7,21,22] Authors assumed that as well as BMD, muscle mass in lower and upper extremity can affect os- teoporotic upper extremity fracture, distal radius, compared with overuse and rather activity related RCT in women pop- ulation.
Dual energy X-ray absorptiometry (DXA) can assess body
composition, fat and muscle mass as well as BMD. Though several tools for measurement of muscle mass including bioelectrical impedance analysis, DXA, magnetic resonance imaging (MRI), and computed tomography (CT), DXA are relatively inexpensive and easy to access with low radia- tion exposure.[4,23-26]
Authors assessed lean body mass (fat free tissue), upper and lower, and BMD in female patients of DRF and RCT. We predict inferior muscle mass and osteoporosis are more frequent in DRF group than RCT group.
METHODS
1. MethodsWe conducted retrospective case control study under In- stitutional Review Board approval. Patients of DRF and symp- tomatic RCT of shoulder over 50 years have been recom- mended of BMD as well as body composition assessment under patient’s consents in one hospital. Between January 2016 and June 2017, we found 70 patients of DRF and 105 patients of RCT with above examination. Patients of male gender, 8 of DRF and 55 of RCT, and age under 50 years, 2 of DRF and 1 of RCT, were excluded remaining in 60 of DRF and 49 of RCT patients. We reviewed medical records by 4 of orthopedic surgeons and identified patient’s history in- cluding medical diseases, current occupation and activity of daily life, medication history, previous fall and fracture,
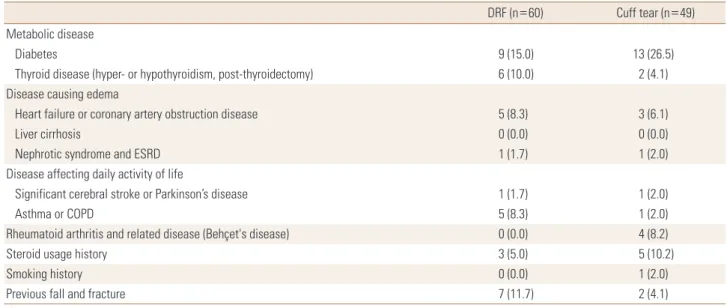
Table 1. Exclusion criteria and relevant patients of each group
DRF (n=60) Cuff tear (n=49)
Metabolic disease
Diabetes 9 (15.0) 13 (26.5)
Thyroid disease (hyper- or hypothyroidism, post-thyroidectomy) 6 (10.0) 2 (4.1)
Disease causing edema
Heart failure or coronary artery obstruction disease 5 (8.3) 3 (6.1)
Liver cirrhosis 0 (0.0) 0 (0.0)
Nephrotic syndrome and ESRD 1 (1.7) 1 (2.0)
Disease affecting daily activity of life
Significant cerebral stroke or Parkinson’s disease 1 (1.7) 1 (2.0)
Asthma or COPD 5 (8.3) 1 (2.0)
Rheumatoid arthritis and related disease (Behçet's disease) 0 (0.0) 4 (8.2)
Steroid usage history 3 (5.0) 5 (10.2)
Smoking history 0 (0.0) 1 (2.0)
Previous fall and fracture 7 (11.7) 2 (4.1)
The data is presented as number (%).
DRF, distal radius fracture; ESRD, end-stage renal disease; COPD, chronic obstructive pulmonary disease.
Table 2. Descriptive statistics
Group DRF (n=38) Cuff tear (n=30) P-value
Age (year) 61.8±6.4 65.9±8.5 0.025
Height (m) 1.56±0.05 1.54±0.06 0.076
Weight (kg) 56.2±8.2 57.4±5.6 0.479
BMI (kg/m2) 23.0±3.2 24.3±2.6 0.079
The data is presented as mean±standard deviation.
DRF, distal radius fracture; BMI, body mass index.
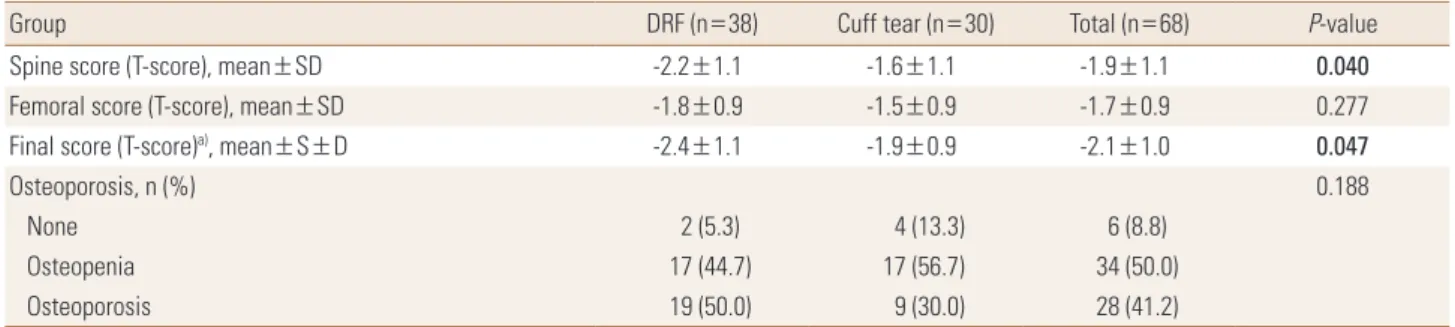
Table 3. Comparison of bone mineral density
Group DRF (n=38) Cuff tear (n=30) Total (n=68) P-value
Spine score (T-score), mean±SD -2.2±1.1 -1.6±1.1 -1.9±1.1 0.040
Femoral score (T-score), mean±SD -1.8±0.9 -1.5±0.9 -1.7±0.9 0.277
Final score (T-score)a), mean±S±D -2.4±1.1 -1.9±0.9 -2.1±1.0 0.047
Osteoporosis, n (%) 0.188
None 2 (5.3) 4 (13.3) 6 (8.8)
Osteopenia 17 (44.7) 17 (56.7) 34 (50.0)
Osteoporosis 19 (50.0) 9 (30.0) 28 (41.2)
a)Final score is lower score of patient between spine and femoral score.
DRF, distal radius fracture; SD, standard deviation.
smoking. Through this process, we attempted to rule out confounding factors which can affect BMD and muscle mass in both groups (Table 1). Overall 38 of DRF and 30 of RCT were eligible for this comparison study.
BMD and other body composition, fat and lean body mass, were assessed with a single DXA in one hospital following manufacturer guideline (Lunar Prodigy Advance; GE Lunar, Madison, WI, USA). BMD from lumbar 1 (L1) vertebral body to lumbar 4 (L4) vertebral body were measured for spinal BMD. The femur neck and total excepting ward triad from of hip joint were measured for femoral BMD. Determina- tion of spinal and femoral bone mineral score were based on previously published protocol.[27] Especially in deter- mine spine bone density score, we followed International Society for Clinical Densitometry vertebrae measurement tool.[27] We calculated average value from L1 to L4 score, however, we excluded vertebrae with fractures or degen- erative changes, causing BMD more than 1 standard devia- tion greater or lower compared with the immediately ad- jacent vertebrae, cement or pedicle screw insertion site. At least two vertebral bodies should be eligible for mean val- ue of spine BMD score.
Osteopenia, BMD T-score below -1.0, and osteoporosis, BMD T-score below -2.5, were diagnosed on at any site of the lumbar spine, femur neck and total hip lumbar spine BMD according to World Health Organization criteria.[28]
The upper and lower appendicular lean mass (ALM) were assessed for skeletal muscle mass. Furthermore, as an in- dex of relative muscle mass, ALM, sum of upper and lower ALM, was divided by the height squared (ALM/ht2).[3] In- stead of western people cuff-off value for sarcopenia diag- nosis, men (<7.26 kg/m2) and women (<5.45 kg/m2), ad- justed criteria was employed to diagnose sarcopenia in the Asian population (male, <7.00 kg/m2; female, <5.40 kg/
m2).[3,29]
The DRF of 38 patients were all injured from low energy trauma, majority of simple fall from ground height and di- agnosed with plain X-ray with or not CT radiograms. Symp- tomatic shoulder RCT of 30 patients were diagnosed with MRI. All patients of two groups were treated properly, con- servative or operative management. Mean age of DRF and RCT were 61.8 and 65.9 with significant difference, respec- tively. Height and weight of each groups were assessed with subsequent body mass index (BMI) (Table 2). Even though significance were not secured, mean height (1.56 m of DRF, 1.54 m of RCT) and BMI (23.0 of DRF, 24.3 of RCT) presented more or less difference between two groups.
Eight of 38 patients (21%) in DRF had current occupation compared with 10 of 30 patients (33%) in RCT.
2. Statistical analysis
The Pearson χ2 test and Fisher’s exact test for categorical variables and the Student t-test for continuous variables were used for comparison between groups. Before the Student t-test was performed, the normality test (Shapiro- Wilk test) was applied to continuous variables. Willcoxon rank sum test was carried out in case of negative normality test of continuous value. Less than 0.05 of P-value was considered statistically significance. The statistical evalua-
tion was conducted using software R (version 3.1.0; The R Foundation for Statistical Computing, Vienna, Austria).
RESULTS
Other than ALM of arm, all continuous variables were greater than P-value of 0.05 in the Shapiro-Wilk test, satis- fying normality ahead of the independent t-test.
T-score of spine were -2.2 and -1.6 in DRF and RCT pa- tients with significant difference (P=0.040), respectively.
Although femoral T-score did not show significant differ- ence (mean score, -1.8 of DRF and -1.5 of RCT), subsequent final BMD score, lower score of patient between spine and femoral score, of both group also presented difference with significance, -2.4 of DRF and -1.9 of RCT patients (P=0.047).
Diagnosis of osteoporosis were confirmed in 19 patients (50%) from DRF compared with 9 patients from RCT group (30%) (Table 3).
The median soft tissue mass of the arm was 3.7 kg and 3.8 kg in the DRF and RCT groups, respectively, without significant difference (P=0.882). The mean lean body mass of the leg was 11.0 kg and 10.5 kg in the DRF and RCT, re- spectively, without significant difference (P=0.189). The relative overall ALM was not significantly different between groups (DRF, 6.0 kg/m2; RCT, 6.0 kg/m2; P=0.976). Nine pa- tient out of 38 patients (23.7%) in the DRF group were di- agnosed with sarcopenia based on the Asian diagnostic criteria, compared with 5 individuals (16.7%) in the RCT;
this difference was not significant by the chi square test (P=0.683) (Table 4).
DISCUSSION
Contrast to our initial argument, lean body mass, repre- sentative of muscle mass, did not result in significant dif-
ference between two groups. The ALM of arm and leg did not differ between two groups as well as adjusted param- eter, sum of arm and lower leg ALM divided by square of height. Finally 9 (23.7%) of patients belonged to sarcope- nia criteria compared with 5 patients (16.7%) of sarcopenia in RCT group.
Instead there were significant difference in T-score from spinal BMD and overall (lowest score from spina, femur neck, and total femur). Though without significance, 19 patients (50%) were diagnosed with osteoporosis in DRF compared with 9 patients (30%) were diagnosed in RCT group. Osteoporosis is well-kwon risk factor for fragile frac- ture; DRF, spine fracture, and hip fracture.[1] We expected lower BMD outcome in DRF before statistical comparison and corresponding results were followed. Although pat- ents age, critical risk factor for BMD, of DRF (average of 61.8 years) were lower than RCT (65.9), outcome presented mean- ingful BMD inferiority.
The sarcopenia is an issue of recent interest and is more defined as syndrome, loss of muscle mass and function, rather than disease.[30] Despite of numerous attempts to identity sarcopenia affecting functional impairment, there are still controversies in definition, measurement, diagno- sis algorithm, and criteria.[24,25,31-35]
Regardless of bone density, sarcopenia appears to be an independent risk factor for fragility fractures leading to a condition known as sarco-osteoporosis.[24] Authors as- sumed that inferior arm muscle mass is likely to induce DRF with trivial injury since its low protective function for distal radius. Besides the sarcopenia correlates with functional impairment in daily living; difficulty in walking, climbing upstairs, and moving slowly, it increases the risk of falls and subsequent fracture.[36] Therefore, we suspect patients of DRF also has implicit chance of compromised muscle mass as well as BMD. However, we did not find muscle mass dif- Table 4. Appendicular lean mass and subsequent sarcopenia
Group DRF (n=38) Cuff tear (n=30) Total (n=68) P-value
ALM-arm (kg), mean (range) 3.7 (3.2-4.3) 3.8 (3.5-4.1) 3.8 (3.4-4.2) 0.882
ALM-leg (kg), mean±SD 11.0±1.5 10.5±2.1 10.8±1.8 0.189
ALM/height2, mean±SD 6.0±0.8 6.0±0.8 6.0±0.8 0.976
Sarcopenia, n (%) 0.683
None 29 (76.3) 25 (83.3) 54 (79.4)
Sarcopenia 9 (23.7) 5 (16.7) 14 (20.6)
DRF, distal radius fracture; ALM, appendicular lean mass; SD, standard deviation.
ference between two groups.
Only a few studies about upper extremity patient were reported up to now.[18,19,37] Especially, only one recent study is available about relationship between sarcopenia and RCT.[37] Chung et al.[37] reported sarcopenia was more severe in patients with a chronic symptomatic full-thick- ness RCT than in the age- and sex-matched control popu- lation. However, they even could not explain mechanism of relationship and merely presented results. Our initial as- sumption, lower muscle mass in DRF than RCT, could be wrong according to Chung et al.[37]. Overall, sarcopenia of upper extremity patients are not fully understood. Our re- sult, no difference in muscle mass, might derived from both DRF and RCT inherently correlation with sarcopenia.
Although the aging process is a definite cause of sarco- penia, other reasons for sarcopenia have been reported, including reduced mobility, inadequate nutrition, neuro- degenerative diseases, malignancy, chronic renal and en- docrine disorders (mainly diabetes, abnormal thyroid func- tion and low levels of vitamin D, sex steroids, growth hor- mone and insulin-like growth factor-1), cardiometabolic disease, and nutritional deficiency.[30,36,38] Both osteo- porosis and sarcopenia share various pathophysiological pathway and subsequent risk factors explaining synchro- nous loss of bone and muscle mass.[38] Authors attempt- ed to exclude above confounding factors which can affect our comparison study.
There are several limitations of our study. We attempted to set aside compounding factures and excluded patients of relevant medical condition. As a result only 38 and 30 of DRF and RCT patients were enrolled and compared. Our study was also retrospective design. Though we meticu- lously reviewed medical records of patient by 4 of ortho- pedic surgeon, there has been chance of undetected past history. Muscle mass is not sufficient for sarcopenia diag- nosis. Muscle strength and physical performance were not considered in this study.[3] Though there was statistical significance, height and BMI average difference between two groups were not adjusted. Further study considering above factors will be better.
Finally, in different with initial argument, patients with DRF did not have significantly lower lean body mass; instead, BMD was significantly lower in patients with DRF than in controls. Further study with more patients, possible pro- spective study, will be required in next step in upper ex-
tremity sarcopenia experiment.
CONCLUSION
Even though BMD difference, we did not find muscle mass difference between DRF and RCT patients.
REFERENCES
1. Koval KJ, Harrast JJ, Anglen JO, et al. Fractures of the distal part of the radius. The evolution of practice over time. Where’s the evidence? J Bone Joint Surg Am 2008;90:1855-61.
2. Binkley N, Blank RD, Leslie WD, et al. Osteoporosis in crisis:
It's time to focus on fracture. J Bone Miner Res 2017;32:
1391-4.
3. Janssen I, Heymsfield SB, Ross R. Low relative skeletal mus- cle mass (sarcopenia) in older persons is associated with functional impairment and physical disability. J Am Geri- atr Soc 2002;50:889-96.
4. Lang T, Cauley JA, Tylavsky F, et al. Computed tomograph- ic measurements of thigh muscle cross-sectional area and attenuation coefficient predict hip fracture: the health, ag- ing, and body composition study. J Bone Miner Res 2010;
25:513-9.
5. Deren ME, Babu J, Cohen EM, et al. Increased mortality in elderly patients with sarcopenia and acetabular fractures.
J Bone Joint Surg Am 2017;99:200-6.
6. Park HM, Ha YC, Yoo JI, et al. Prevalence of sarcopenia ad- justed body mass index in the Korean woman based on the Korean national health and nutritional examination surveys. J Bone Metab 2016;23:243-7.
7. Ruch DS, McQueen MM. Distal radius and ulna fractures.
In: Bulcholz RW, Cou Brown CM, Heckman JD, et al., editors.
Rockwood and Green’s fractures in adults. 7th ed. Phila- delphia, PA: Lippincott Williams & Wilkins; 2010. p.829-77.
8. Wolfe SW. Distal radius fractures. In: Wolfe SW, Hotchkiss RN, Pederson WC, et al., editors. Green’s operative hand surgery. 7th ed. Philadelphia, PA: Elsevier; 2017. p.516-87.
9. Tempelhof S, Rupp S, Seil R. Age-related prevalence of ro- tator cuff tears in asymptomatic shoulders. J Shoulder El- bow Surg 1999;8:296-9.
10. Milgrom C, Schaffler M, Gilbert S, et al. Rotator-cuff chang- es in asymptomatic adults. The effect of age, hand domi- nance and gender. J Bone Joint Surg Br 1995;77:296-8.
11. Yamamoto A, Takagishi K, Osawa T, et al. Prevalence and
risk factors of a rotator cuff tear in the general population.
J Shoulder Elbow Surg 2010;19:116-20.
12. Abate M, Di Carlo L, Salini V, et al. Risk factors associated to bilateral rotator cuff tears. Orthop Traumatol Surg Res 2017;103:841-5.
13. Bodin J, Ha C, Chastang JF, et al. Comparison of risk factors for shoulder pain and rotator cuff syndrome in the work- ing population. Am J Ind Med 2012;55:605-15.
14. Bodin J, Ha C, Petit Le Manac'h A, et al. Risk factors for in- cidence of rotator cuff syndrome in a large working popu- lation. Scand J Work Environ Health 2012;38:436-46.
15. Silverstein BA, Bao SS, Fan ZJ, et al. Rotator cuff syndrome:
personal, work-related psychosocial and physical load fac- tors. J Occup Environ Med 2008;50:1062-76.
16. Steihaug OM, Gjesdal CG, Bogen B, et al. Sarcopenia in pa- tients with hip fracture: a multicenter cross-sectional study.
PLoS One 2017;12:e0184780.
17. Di Monaco M, Castiglioni C, Di Monaco R, et al. Association between low lean mass and low bone mineral density in 653 women with hip fracture: does the definition of low lean mass matter? Aging Clin Exp Res 2017;29:1271-6.
18. Roh YH, Koh YD, Noh JH, et al. Evaluation of sarcopenia in patients with distal radius fractures. Arch Osteoporos 2017;
12:5.
19. Roh YH, Noh JH, Gong HS, et al. Effect of low appendicular lean mass, grip strength, and gait speed on the functional outcome after surgery for distal radius fractures. Arch Os- teoporos 2017;12:41.
20. Oliveira A, Vaz C. The role of sarcopenia in the risk of os- teoporotic hip fracture. Clin Rheumatol 2015;34:1673-80.
21. Rozental TD, Makhni EC, Day CS, et al. Improving evalua- tion and treatment for osteoporosis following distal radial fractures. A prospective randomized intervention. J Bone Joint Surg Am 2008;90:953-61.
22. Xu W, Ni C, Yu R, et al. Risk factors for distal radius fracture in postmenopausal women. Orthopade 2017;46:447-50.
23. Hind K, Oldroyd B. In-vivo precision of the GE Lunar iDXA densitometer for the measurement of appendicular and trunk lean and fat mass. Eur J Clin Nutr 2013;67:1331-3.
24. Kelly TL, Wilson KE, Heymsfield SB. Dual energy X-Ray ab- sorptiometry body composition reference values from
NHANES. PLoS One 2009;4:e7038.
25. Malafarina V, Uriz-Otano F, Iniesta R, et al. Sarcopenia in the elderly: diagnosis, physiopathology and treatment.
Maturitas 2012;71:109-14.
26. Bokshan SL, DePasse JM, Daniels AH. Sarcopenia in ortho- pedic surgery. Orthopedics 2016;39:e295-300.
27. Lewiecki EM, Gordon CM, Baim S, et al. International soci- ety for clinical densitometry 2007 adult and pediatric offi- cial positions. Bone 2008;43:1115-21.
28. Kanis JA, Melton LJ 3rd, Christiansen C, et al. The diagnosis of osteoporosis. J Bone Miner Res 1994;9:1137-41.
29. Chen LK, Liu LK, Woo J, et al. Sarcopenia in Asia: consen- sus report of the Asian Working Group for Sarcopenia. J Am Med Dir Assoc 2014;15:95-101.
30. Cruz-Jentoft AJ, Baeyens JP, Bauer JM, et al. Sarcopenia:
European consensus on definition and diagnosis: report of the European Working Group on Sarcopenia in Older People. Age Ageing 2010;39:412-23.
31. Drey M, Sieber CC, Bertsch T, et al. Osteosarcopenia is more than sarcopenia and osteopenia alone. Aging Clin Exp Res 2016;28:895-9.
32. Edwards MH, Dennison EM, Sayer AA, et al. Osteoporosis and sarcopenia in older age. Bone 2015;80:126-30.
33. He H, Liu Y, Tian Q, et al. Relationship of sarcopenia and body composition with osteoporosis. Osteoporos Int 2016;
27:473-82.
34. Hong W, Cheng Q, Zhu X, et al. Prevalence of sarcopenia and its relationship with sites of fragility fractures in elder- ly Chinese men and women. PLoS One 2015;10:e0138102.
35. Scott D, Daly RM, Sanders KM, et al. Fall and fracture risk in sarcopenia and dynapenia with and without obesity: the role of lifestyle interventions. Curr Osteoporos Rep 2015;
13:235-44.
36. Serra Rexach JA. Clinical consequences of sarcopenia. Nutr Hosp 2006;21 Suppl 3:46-50.
37. Chung SW, Yoon JP, Oh KS, et al. Rotator cuff tear and sar- copenia: are these related? J Shoulder Elbow Surg 2016;
25:e249-55.
38. Hirschfeld HP, Kinsella R, Duque G. Osteosarcopenia: where bone, muscle, and fat collide. Osteoporos Int 2017;28:2781- 90.