Understanding anisotropic growth behavior of hexagonal ice on a molecular scale: A
molecular dynamics simulation study
Myungjoo Seo, Eunseon Jang, Kyeongjin Kim, Saehyun Choi, and Jun Soo Kim
Citation: The Journal of Chemical Physics 137, 154503 (2012); doi: 10.1063/1.4759113 View online: http://dx.doi.org/10.1063/1.4759113
View Table of Contents: http://scitation.aip.org/content/aip/journal/jcp/137/15?ver=pdfcov Published by the AIP Publishing
Articles you may be interested in
Understanding graphene production by ionic surfactant exfoliation: A molecular dynamics simulation study J. Appl. Phys. 116, 014304 (2014); 10.1063/1.4885159
Thermal behavior of superparamagnetic cobalt nanodots explored by anisotropic magnetic molecular dynamics simulations
J. Appl. Phys. 111, 07D126 (2012); 10.1063/1.3677932
Crystal growth investigations of ice/water interfaces from molecular dynamics simulations: Profile functions and average properties
J. Chem. Phys. 134, 014710 (2011); 10.1063/1.3518984
The effect of salt on the melting of ice: A molecular dynamics simulation study J. Chem. Phys. 129, 124504 (2008); 10.1063/1.2979247
First-principles molecular-dynamics study of surface disordering of the (0001) face of hexagonal ice J. Chem. Phys. 113, 10733 (2000); 10.1063/1.1323959
Understanding anisotropic growth behavior of hexagonal ice
on a molecular scale: A molecular dynamics simulation study
Myungjoo Seo,a)Eunseon Jang,a)Kyeongjin Kim, Saehyun Choi, and Jun Soo Kimb) Department of Chemistry and Nano Science, Ewha Womans University, Seoul 120-750, South Korea
(Received 14 August 2012; accepted 19 September 2012; published online 19 October 2012) Although distinct growth behaviors on different faces of hexagonal ice have long been suggested, their understanding on a molecular scale has been hampered due to experimental difficulties near interfaces. We present a molecular dynamics simulation study to unravel the molecular origin of anisotropy in the growth kinetics of hexagonal ice by visualizing the formation of transient wa-ter structures in the growing ice inwa-terface. During ice growth, the formation of transient structures and their rearrangement to the final ice configuration are observed irrespective of growth direction. However, we find that their structure and duration differ significantly depending on growth direc-tion. In the direction perpendicular to the basal face of hexagonal ice along which growth occurs most slowly, a two-dimensional transient structure, which is formed by competing hexagonal and cubic arrangements within the same layer, persists for a significant period of time, contrasted with short-lived transient structures in other directions. This observation of such transient water struc-tures and their rearrangement during ice growth provides a clear explanation of different growth rates on each face of hexagonal ice on a molecular scale. © 2012 American Institute of Physics. [http://dx.doi.org/10.1063/1.4759113]
I. INTRODUCTION
Many physicochemical processes are mediated by molec-ular binding and adsorption in the interfacial region. While the fundamental understanding of these processes can be ob-tained by investigating molecular binding and rearrangement in the interfacial region, such investigations have been ham-pered due to difficulties in experiments detecting the dy-namics of individual molecules near interfaces. Growth of crystals including ice, metals and metal compounds, and or-ganic compounds are just a few examples,1,2and their
inhibi-tion by impurities such as small organic and inorganic anti-crystallization substances are another examples.3,4 Among
them, understanding nucleation and growth of ice crystals is of particular importance in numerous natural processes as well as in many applications including laboratory cryobiol-ogy, cryoenzymolcryobiol-ogy, and food science.4–7
One of the lessons regarding ice growth in supercooled water from early experiments is that growth rates are unequal on different faces of hexagonal ice, i.e., the basal, prismatic, and secondary prismatic faces.1,8The growth rate is higher in
directions parallel to the basal face and is lower in the direc-tion perpendicular to the basal face. This difference in growth behavior has been related to differences in interfacial struc-ture and explained in terms of the number and orientation of the hydrogen bonds formed by water molecules binding to the underlying ice layer.8 However, the proposed molecular
explanation has yet to be verified, as details of water dynam-ics in the interfacial region during ice growth have not been available.
a)Myungjoo Seo and Eunseon Jang contributed equally to this work. b)Electronic mail: [email protected].
In this study, we aim to establish a molecular-level un-derstanding of anisotropy in the growth kinetics of hexago-nal ice using molecular dynamics (MD) simulations of the TIP5P-E water model.9The recent development of computa-tional methods and models10–12 has enabled assessments of
growth kinetics at the molecular level,13–16resulting in
qual-itative agreement with early experiments. Furthermore, dis-tinct growth mechanisms on each face have been proposed based on interfacial structure and growth kinetics.13,14In
par-ticular, a much slower growth on the basal face than that on the other faces has been explained by the layer-by-layer mech-anism in which the complete formation of a new layer occurs by two-dimensional rearrangement of water molecules before formation of the following layer begins. Although these semi-nal studies provide important insights into the ice growth pro-cess on a molecular scale, we find that the proposed growth mechanisms need to be revised because the structure forma-tion and rearrangement of water molecules in the interfacial region during growth on the basal face become significantly different when simulations are performed in larger systems than those considered in previous studies.
In this study, we conduct MD simulations of ice growth in supercooled liquid water. The initial hexagonal ice is ori-ented such that the three different faces, i.e., the basal, pris-matic, and secondary prismatic faces, are in contact with su-percooled water to investigate ice growth on each face. We first present strong evidence for distinct growth mechanisms by investigating the system-size dependence of growth rate on different faces of initial hexagonal ice. Interestingly, growth rate depends on system size only for growth on the basal face. More importantly, we explicitly show the distinct transient structure of two-dimensional water clusters in the interfacial region during ice growth on different faces. We find that the
154503-2 Seoet al. J. Chem. Phys. 137, 154503 (2012)
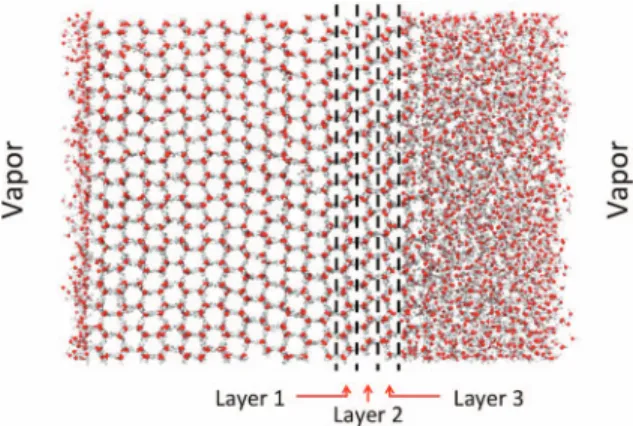
FIG. 1. A representative snapshot of the large simulation system during ice growth on the basal face of initial hexagonal ice, created using VMD.17 Lay-ers 1, 2, and 3 are marked to be visualized later for the structure formation and rearrangement of water molecules.
structure and duration of transient water clusters in the grow-ing ice interface are significantly different, leadgrow-ing to distinct growth behaviors and unequal growth rates on different faces of initial hexagonal ice. We conclude this study with a brief discussion of the formation of stacking-disordered ice.
II. METHODS AND MODELS
To compare distinct growth behaviors on three different faces of hexagonal ice, we perform simulations of three sets of systems in which ice grows perpendicular to the interface formed between liquid water and each face of hexagonal ice, i.e., the basal, prismatic, and secondary prismatic faces. A representative snapshot of simulation systems in which ice grows perpendicular to the basal face is shown in Figure1. This snapshot was taken at the moment when the growing ice contained about 16 double layers although the initial hexag-onal ice contained eight double layers. The three layers are marked as layers 1, 2, and 3 in Figure1, to be visualized later for the formation of transient water structures in the growing ice interface. Simulations of ice growth in the other directions are the same except the orientation of the initial hexagonal ice.
We interpret the system-size dependence of growth rates observed only for growth on the basal face as an indication of distinct growth mechanisms. To study the system-size de-pendence of growth rates on the three different faces, we per-form simulations of two sets of systems in each growth direc-tion, with different interfacial sizes but with a fixed size in the growth direction. For example, systems with interfacial sizes of (3.06× 2.66) nm2 and (6.15× 5.32) nm2 are considered
for growth on the basal face and are referred to as small and large systems hereafter. The initial number of water molecules in supercooled liquid is twice as many as that in the ice sub-strate, so the size of the ice at completion of growth is three times longer in the growth direction than that of the initial ice substrate. That is, 3072 and 6144 water molecules are in the ice and supercooled liquid of large systems, respectively, and four times less in each phase of small systems.
To reach conclusions independent of initial conditions, we perform five independent simulations, starting with
differ-ent initial configurations and velocities of water molecules for each orientation and interfacial size. As we perform five sim-ulations for three orientations and two interfacial sizes, total 30 sets of simulations are run.
We use the rigid, nonpolarizable TIP5P-E model9for
wa-ter, which is a modified version of the original TIP5P model,18
and has been shown to provide a reasonable description of the properties of ice19,20 with a freezing point of 271 K. An
ice configuration with a proton-disordered hexagonal struc-ture (768 molecules) is taken from the study by Hayward and Reimers,21 from which five different proton-disordered
con-figurations are generated as described in the previous work.22
Additional liquid water simulations (768 molecules) are per-formed to prepare five liquid water configurations at 260 K and 1 bar. Thirty different interfacial systems are prepared by duplicating and combining these configurations of ice and liq-uid water in different interfacial sizes and orientations. For large basal systems with 9216 ice/water molecules, for in-stance, four of the ice systems with 768 molecules are com-bined to form an ice layer with its basal face perpendicu-lar to the growth direction, four of water systems with 768 molecules are combined to form a liquid layer and placed in contact with the ice basal face, and the same liquid layer is placed again on top of it, doubling the size of the liquid layer in the growth direction. In this way the number of ice molecules is 3072 and that of liquid water molecules is 6144. The system size in the growth direction is∼8.6 nm in five dif-ferent configurations. Then the system size in this direction is adjusted to 15 nm and the system is placed in the center. As a result, the ice/vapor and liquid/vapor interfaces are formed on each outer side of the ice and the liquid layers, in addition to the ice/liquid interface between them.
All of the constant NVT molecular dynamics simulations are carried out with the GROMACS v4.5.3 program.23 The equations of motion are integrated numerically using a leap-frog algorithm with a time step of 1 fs. The v-rescale method24
is used to maintain temperature at 260 K with a coupling con-stant of 0.1 ps. A cutoff distance of 1 nm is used for Lennard-Jones interactions, and the long-range electrostatic interac-tions are calculated by the Particle-Mesh Ewald method25
with a real space cutoff distance of 1 nm. Each set of simula-tions is run for 100 ns and molecule configurasimula-tions are stored every 2 ps.
III. RESULTS AND DISCUSSION
A. System-size dependence of growth rate
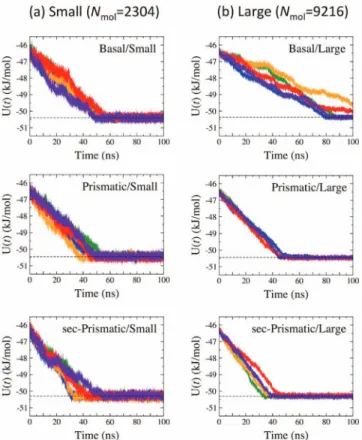
Distinct growth behaviors on the three different faces of hexagonal ice are manifested as differences in their growth rates presented in Figure2and Table I. In Figure2, the po-tential energy per mole of water molecules from each simula-tion is presented as a funcsimula-tion of time. Initially, two-thirds of the water molecules are in the metastable supercooled liquid, and potential energy decreases as they crystallize, reaching a plateau when the entire system crystallizes. For small sys-tems, slopes of the decaying potential energy during growth on the basal, prismatic, and secondary prismatic faces are slightly different: the decay rate is highest on the secondary
FIG. 2. Change in the potential energy during ice growth. Five data sets shown in each plot are from five independent simulations for each case. It reaches a plateau when crystallization is completed.
prismatic face, lower on the prismatic face, and the lowest on the basal face. However, the difference in the potential en-ergy decrease becomes more pronounced in the large-system simulations. In particular, during growth on the basal face, the potential energy in the large system decreases twice more slowly than that in the small system. Interestingly, the poten-tial energy decrease does not change between small and large systems during growth on the prismatic and secondary pris-matic faces.
The growth rate in TableIis determined from the change in potential energy during ice growth shown in Figure2. The slope of the decreasing potential energy in kJ/(mol ns) is cal-culated by fitting to a linear line and is converted to the growth rate in units of cm/s by multiplying the length (nm) of the grown ice in the growth direction and dividing by the potential energy difference (kJ/mol) between the initial and final con-figurations, followed by a dimensional analysis. In both small and large systems, the growth rate is highest on the secondary prismatic face, lower on the prismatic face, and the lowest on
TABLE I. Growth rates in units of cm/s for each face. Values in paren-thesis are the standard deviation of the rate calculated from five simulation trajectories.
System Rate on Rate on Rate on secondary
size basal face prismatic face prismatic face
Small 11.0(1.2) 13.5(2.2) 13.8(2.8)
Large 6.2(1.1) 13.2(1.0) 14.1(2.0)
the basal face, agreeing qualitatively with early experiments1 and with previous simulations of the six-site water model.13,14 It is noted that our results for growth rates are obtained at 260 K, corresponding to the supercooling of 11 K compared to the melting point of 271 K for the TIP5P-E water model, and are in reasonable agreement with the empirically esti-mated rate of 7.6 cm/s for growth parallel to the basal face at the supercooling of 11 K.1 The previous simulations with
the six-site water model predicted much higher rates of 64 cm/s at 265 K14 and 40 cm/s at 268 K13 for growth on the
secondary prismatic face. However, in consideration of the melting temperature of the six-site model recently proposed as 289 K,15 the previous simulations are also in reasonable
agreement with the empirical estimate at the similar degrees of supercooling: 27 cm/s at 275 K14and∼10 cm/s at 279 K.13 Interestingly, growth rate on the basal face depends sig-nificantly on the size of the simulation system. When the sys-tem is small, the rate on the basal face is slightly lower than that on the prismatic and secondary prismatic faces. However, growth rate on the large basal face, with an interfacial area four times larger than that of the small system, is substantially lower than the rate on the small basal face as well as those on the other faces. Growth rates on prismatic and secondary prismatic faces do not change significantly between small and large systems. The system-size dependence observed only for growth on the basal face suggests the possibility of a distinct growth mechanism on the basal face from those on the other faces.
In general, system-size dependence originates from the use of the periodic boundary condition in molecular dynam-ics simulations. In this study, the periodic boundary contion applied in the direccontions perpendicular to the growth di-rection may have caused a significant change in growth rate depending on interface size. The periodic boundary condi-tion in these direccondi-tions is introduced to mimic the infinitely large ice/water interface from simulations of a system with a finite-size interface. During layer formation in the course of ice growth, water molecules bind to the underlying layer and form interfacial clusters. We speculate that such clusters are formed and dissolved repeatedly and that only a few of them successfully initiate layer formation by chance. If the size of the system interface is insufficient compared with that of each interfacial cluster, layer formation can be accelerated using the periodic boundary condition: the instantaneous interfacial cluster might be so large, relative to the system interface, that one side of the cluster may interact with a periodic image of the other side of the same cluster and, as a result, the instanta-neous cluster becomes stabilized and initiates layer formation with a higher probability. The fact that system-size depen-dence is observed only for growth on the basal face implies that the interfacial cluster formed on the basal face might be significantly larger than those on the other faces. We discuss more about the system-size dependence in growth on the basal face in Sec.III Bwhen the transient interfacial cluster on the basal face is clearly defined.
System-size dependence of growth rate has been stud-ied separately on each face by different groups: earlier by Carignano et al.14for growth on the secondary prismatic face
154503-4 Seoet al. J. Chem. Phys. 137, 154503 (2012)
When these separate results obtained for the same six-site wa-ter model are combined, it can be concluded that the system-size dependence of growth rate is negligible for growth on the secondary prismatic face, whereas it is significant on the basal face, which is in qualitative agreement with our re-sults obtained with the TIP5P-E water model. However, it has not been appreciated that, when combined, they possibly im-ply distinct growth mechanisms on these faces. Our results confirm these combined conclusions using a different water model and clarify the implication of system-size dependence of growth rate.
B. Formation of transient water clusters and molecular rearrangement
The understanding of distinct growth behaviors on a molecular scale is provided by visualizing the formation of transient structures of water molecules in the interfacial re-gion during ice growth. For this purpose, we calculate two-dimensional densities of oxygen atoms in layers 1, 2, and 3 marked in Figure 1, and average them over 100 ps. Such two-dimensional average densities of oxygen atoms are ob-tained every 100 ps, and their evolution with time visual-izes the change in oxygen density, i.e., the stacking and rear-rangement of water molecules during crystallization of each layer. Only a few of two-dimensional density maps are pre-sented and discussed in Figures 3,5, and 6 due to the limit by the graphical presentation, but these carry information on the formation of transient water clusters sufficient to explain anisotropic growth rates.
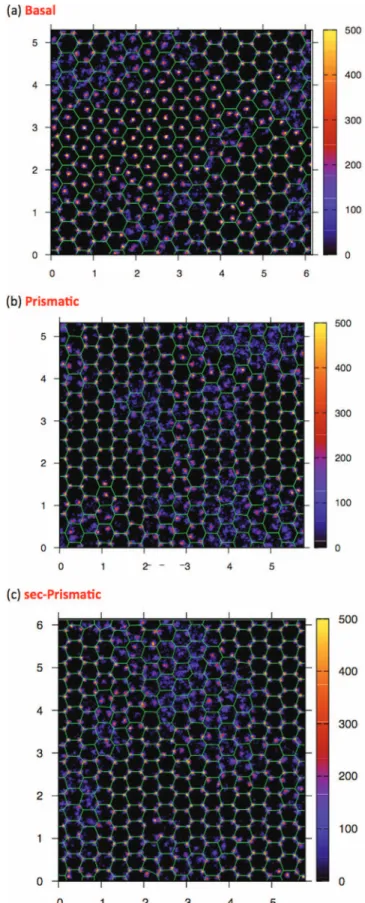
In Figure 3, three representative density maps of oxy-gen atoms are presented for growth on the basal, prismatic, and secondary prismatic faces, respectively. We classify water molecules into ice-like and liquid molecules for further dis-cussion of the structures formed by water molecules within a layer. An ice-like molecule is defined as a water molecule whose average density over the last 100 ps is highly localized at a fixed location and represented by a bright spot in density maps. It is noted that not all ice-like molecules are kept fixed until completion of layer formation and they can be transient and rearranged during crystallization. In contrast, the blurred area with lower density in density maps implies the presence of delocalized liquid molecules over the last 100 ps. Solid hexagons shown in Figure3are constructed by connecting the average locations of oxygen atoms in the same layer of the fi-nal ice configuration. These solid hexagons are used as a refer-ence in comparison with which the ice-like molecules are fur-ther classified into in-registry and out-of-registry molecules. In all density maps, it is commonly seen that groups of ice-like molecules form six-membered rings in registry with six vertices of the solid hexagons. These ice-like molecules are defined as in-registry molecules, whereas the remaining ice-like molecules are as out-of-registry molecules.
The structures of out-of-registry molecules and their lo-cations are significantly different depending on the growth direction as exemplified in Figure 3. During growth on prismatic and secondary prismatic faces, out-of-registry molecules form five-, six-, seven-, and eight-membered rings that are not matched with the solid hexagons. These transient
FIG. 3. Two-dimensional oxygen densities (nm−2) averaged over 100 ps, taken from simulations of large systems. Solid lines connect average lo-cations of oxygen atoms in the final ice configuration. Water molecules, represented by a bright spot indicating a high density, are classified as ice-like molecules, among which those in registry with solid hexagons are further classified as in-registry molecules, whereas the remaining ice-like molecules are classified as out-of-registry molecules. Water molecules rep-resented by the blurred area, indicating the delocalization, are classified as liquid molecules.
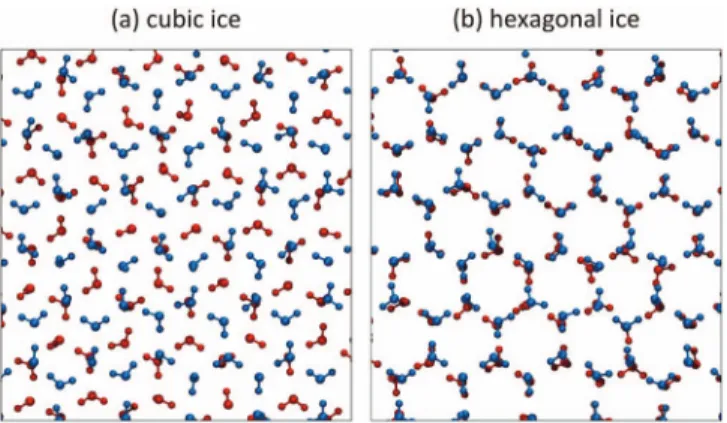
FIG. 4. Two layers in cubic and hexagonal ice, viewed in the (111) direction of cubic ice and in the direction perpendicular to the basal face of hexago-nal ice. Blue and red colors are used to represent molecules in two different layers, respectively.
structures are found scattered and oftentimes in the vicinity of in-registry structures. Out-of-registry molecules on the basal face also form five-, six-, seven-, and eight-membered rings. However, the six-membered rings of these molecules form a large, well-ordered cluster. In contrast to the in-registry struc-ture overlapping with solid hexagons, the well-ordered out-of-registry cluster composed of six-membered rings is dislo-cated from the solid hexagons as represented in Figure 3(a) by groups of six-membered rings containing bright spots in the middle of the solid hexagons. It is the formation of such a large, well-ordered transient water cluster that results in dif-ferent growth behavior on the basal face than from those on the other faces.
The formation of the well-ordered out-of-registry clus-ter in case of growth on the basal face originates from two possible arrangements of water molecules on the basal face: hexagonal and cubic arrangements. Arrangements of water molecules in two layers of cubic and hexagonal ice are illus-trated in Figure4. When a new hexagonal layer forms on the basal face, six-membered rings of water molecules are placed on top of those in the underlying layer. On the other hand, a cubic layer is characterized by six-membered rings in a new layer dislocated from those in the underlying layer as shown in Figure4(a). Although hexagonal ice is more stable than cu-bic ice it was shown that the free energy difference between them is estimated very small. The recent vapor pressure mea-surements report the free energy difference of 155± 30 J/mol at 180–190 K27and the model calculations using TIP4P water
model estimate 107 J/mol at 53 K and 128 J/mol at 273 K.28
Several data from literatures are well summarized in recent papers by Murray et al.29 and Moore et al.30Furthermore, it
has also been reported that initial metastable ice has random stacking of cubic and hexagonal layers with varying degrees of stacking probability.31 Therefore, the probability of form-ing hexagonal and cubic arrangements of water molecules may not be very different, and it is not completely unexpected to see the coexistence of partial structures of hexagonal and cubic arrangements within the same layer during layer forma-tion.
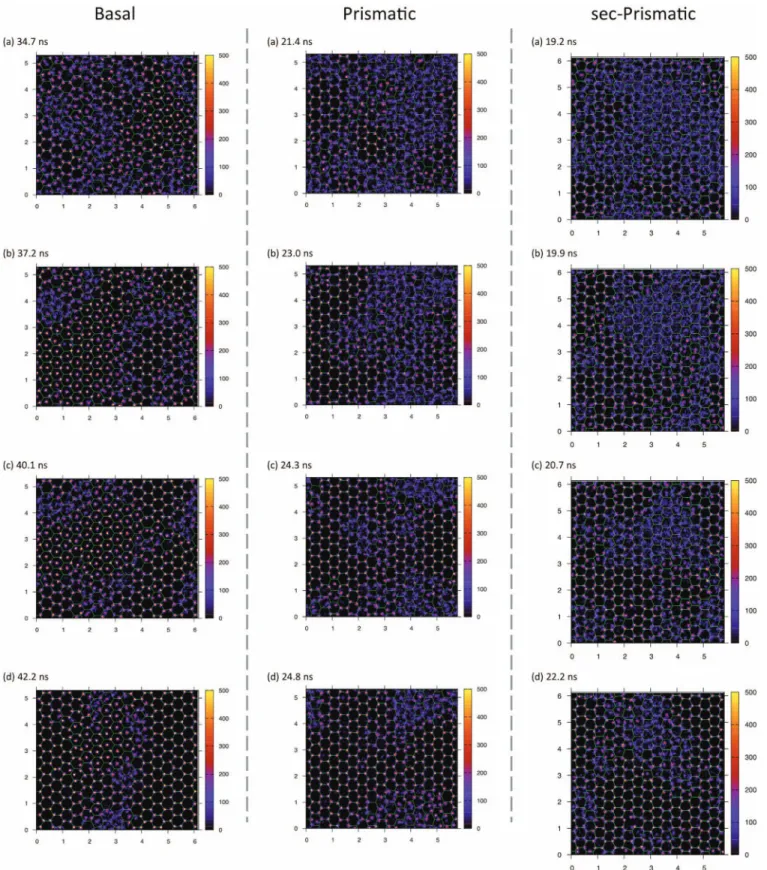
We find that durations of transient water clusters, highly correlated with their structures, are significantly different
de-pending on the growth direction, and it is responsible for anisotropic growth rates on different faces of hexagonal ice. A time series of oxygen densities is presented in Figure5. Dur-ing growth on the basal face, the formation of a large, well-ordered out-of-registry cluster is observed for a significant pe-riod of time. In the figure, the duration of such out-of-registry cluster reaches >5 ns, which is in contrast to the short-lived transient structures observed on the other faces. The forma-tion of a large, well-ordered, and long-lasting transient struc-ture of water molecules and the slow rearrangement into the final ice configuration in case of growth on the basal face de-lays completion of layer formation and thus the growth of ice crystal. In contrast, no long-lasting transient cluster of wa-ter molecules is observed on the prismatic or secondary pris-matic faces. Repeating frequent formation and dissolution, the short-lived out-of-registry arrangements that develop around in-registry clusters are rapidly rearranged into the structure of the final ice configuration.
Previously, the anisotropic growth behavior has been ex-plained in terms of the difference in the number and orienta-tion of the hydrogen bonds formed by water molecules bind-ing to the underlybind-ing ice layer.8,13,14 The stable
configura-tion in a new basal layer is formed when three neighboring molecules connected to the underlying layer are all hydrogen-bonded to the fourth molecule in the same layer. For the pris-matic and secondary prispris-matic layers, on the other hand, only two neighboring molecules hydrogen-bonded to the under-lying layer may form a stable configuration by forming an additional hydrogen bond to each other. Therefore, ice-like structures are more easily formed in case of growth on the prismatic and secondary prismatic faces, and it may explain faster growth in these directions. This qualitative explanation is not inconsistent with our conclusion that the slower growth on the basal face is due to the presence of a long-lasting, tran-sient cluster and, in fact, may explain the longer lifetime of a transient cluster in the basal layer. Although it may be more difficult to form an ice-like cluster on the basal face, it may stay longer once it forms due to more number of hydrogen bonds formed in the cluster.
The system-size dependence of growth rate observed only for growth on the basal face can be understood based on the formation of the large out-of-registry arrangement. The out-of-registry structure on the basal face shown in Figures3 and 5 is very large and it can even occupy about one third of the entire area (refer to the density map (b) of basal system in Figure5). Note that these figures are obtained from simula-tions of large systems and the interfacial size of small systems is one fourth of that of large systems, implying that the size of the transient water cluster can become larger than the interfa-cial size of small systems. Therefore, the transient water clus-ter rearranging into the final ice configuration in large system may itself be the final ice configuration in small systems with no need for further rearrangement. By visual inspection of two-dimensional density maps of small systems, we confirm that once a water cluster starts to grow it is rapidly extended to fill the entire layer without any competition with other tran-sient water cluster. Because the rearrangement of the long-lasting transient water structure, which is a time-consuming process, is absent in small systems, growth in small systems
154503-6 Seoet al. J. Chem. Phys. 137, 154503 (2012)
FIG. 5. A time-series of two-dimensional oxygen densities (nm−2) averaged over 100 ps, taken from simulations of large systems. See the caption of Figure3
and the text for the description.
is much faster than that in large systems. On the other hand, out-of-registry molecules on the prismatic or secondary pris-matic faces do not form a large cluster both in small and large systems and therefore the system-size dependence is negligi-ble in these growth directions.
It has been proposed that the growth on the basal face occurs by a layer-by-layer mechanism.13,14 If the size of a
partial layer developed on the basal face is large enough, a new layer may start to build up on the underlying partial layer even before the complete formation of the underlying layer.
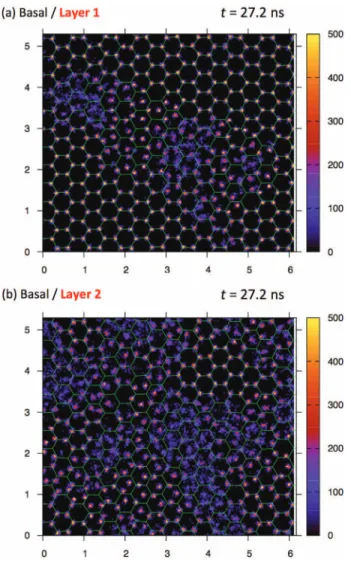
FIG. 6. Comparison of two-dimensional oxygen densities (nm−2) for two consecutive layers 1 and 2 during growth on the basal face of initial hexagonal ice, taken at 27.2 ns. Solid lines connect average locations of oxygen atoms in the final ice configuration.
We verify this by comparing the formation of two consecutive layers on the basal face. In Figure6, oxygen density maps of two consecutive layers on the basal face are shown together. It is found that the formation of layer 2 starts even before for-mation of layer 1 is completed. Forfor-mation of the in-registry arrangement is observed in layer 1, except in the middle area where out-of-registry and liquid molecules are found. Both the partial in-registry and out-of-registry arrangements are ob-served in layer 2, on top of the in-registry arrangement in the underlying layer 1. Such correlated layer formation has been suggested previously for growth on prismatic and secondary prismatic faces in previous studies,13,14based on rough
inter-facial structures in these directions. In our simulations, for-mation of a new layer on the basal face also starts before the underlying layer is completely formed. It will be more excit-ing to quantify the critical size of a partial layer onto which a new layer can develop. For such quantification, however, sim-ulations with larger interface may be required, as well as a de-velopment of an appropriate method to distinguish in-registry ice-like molecules from others. We defer such investigation to future work.
TABLE II. Patterns of layer arrangements in the newly grown ice. Data are obtained from simulations of large systems. The letters, h and c, refer to hexagonal and cubic arrangements. Characters in bold italics are the layer arrangements for layers 1, 2, and 3.
Stacking patterns Cubic:hexagonal
hhccc chcch cchcc 10:5 hhhch hhhcc cccc 7:7 cccch ccccc ccccc 14:1 chchh cchch c 7:4 hcccc cchcc cch 10:3 Total 2.4:1
C. Stacking-disordered structure of ice from TIP5P-E
Formation of stacking-disordered ice is observed in sim-ulations during growth on the basal face. Although the stable ice at ambient conditions has a hexagonal structure, evidence for stacking disorder in initial metastable ice has been pro-vided recently through x-ray analysis31 and computer
sim-ulations of the six-site model32,33 and the coarse-grained
mW water model.30 In this study, we use another rigid
wa-ter model, TIP5P-E,9and confirm the formation of
stacking-disordered ice at early stages of ice growth.
In TableII, the types of layer arrangements are summa-rized during growth on the basal face. When the crystalliza-tion is completed, 15 double layers in addicrystalliza-tion to the initial eight double layers are formed. However, due to the delayed growth on the basal face, not all layers are formed in some of these simulations within simulations durations of 100 ns. The letters, h and c, refer to the layers with hexagonal and cubic arrangements, respectively, and layers 1, 2, and 3 are typed in bold italics. The ratio of cubic and hexagonal arrangements is varied in each simulation: in one extreme case the ratio of cubic and hexagonal layers is 14:1 and in the other extreme case the ratio is 7:7. The overall ratio of cubic and hexago-nal layers is 2.4:1, which is close to an early prediction by the coarse-grained mW model. The reason for preferential forma-tion of cubic layers remains unclear and more work is needed to address this issue.
IV. CONCLUSIONS
In conclusion, we provided a molecular-level explana-tion of distinct growth behaviors on different faces of hexago-nal ice using molecular dynamics simulations of ice growth in the supercooled water. First, we provided indirect but strong evidence for distinct growth mechanisms by investi-gating system-size dependence of growth rate in each direc-tion. Then we explained the molecular origin of anisotropy in growth kinetics by visualizing the formation of transient water structures in a growing ice interface. Additionally, we discussed the formation of stacking-disordered ice in our simulations.
The observation of molecular dynamics of stacking and rearrangement during crystal growth is a powerful tool to dis-tinguish molecular mechanisms of crystal growth. For ex-ample, we found that the structure and duration of transient structures of water molecules in the growing ice interface
154503-8 Seoet al. J. Chem. Phys. 137, 154503 (2012)
determine the growth behavior. In particular, the formation of a long-lasting, large, and ordered transient structure dur-ing growth on the basal face explains the lowest growth rate as well as the system-size dependence observed only in this growth direction. Therefore, it is expected that the same anal-ysis by visualizing molecular dynamics in the interface can be applied to investigate other crystals and provide useful in-sights into the growth process of several crystals, as has been exemplified in the study of anisotropic growth of tetrahydro-furan clathrate hydrate.34
Although the observation of transient water structures by constructing two-dimensional density map of water molecules at a specific time clearly explains the different growth rates depending on the growth direction, the visual-ization of interfacial water dynamics during the entire growth process is limited by the graphical presentation. A quantita-tive analysis would provide a complete understanding of dis-tinct growth mechanisms, and it is our future direction to de-velop a quantitative measure to provide a complete picture of distinct growth mechanisms from time-dependent dynamics of interfacial water during layer formation.
ACKNOWLEDGMENTS
This research was supported by the National Research Foundation of Korea (NRF) under Grant Nos. NRF-2011-0024621 and NRF-2011-220-C00030, and also by the Ewha Global Top 5 Grant 2011 of Ewha Womans University. This research was performed using the computing resources of the KISTI supercomputing center (KSC-2012-C1-02).
1P. V. Hobbs, Ice Physics (Oxford University Press, Oxford, 1974). 2I. Sunagawa, Crystals: Growth, Morphology, and Perfection (Cambridge
University Press, New York, 2005).
3J. D. Reimer, Z. An, Z. Zhu, M. H. Lee, D. S. Goldfarb, J. A. Wesson, and
M. D. Ward,Science330, 337–341 (2010).
4Cryobiology, edited by H. T. Meryman (Academic, London, 1966). 5H. R. Pruppacher and J. D. Klett, Microphysics of Clouds and Precipitation
(D. Reidel, Hingham, MA, 1978).
6V. F. Petrenko and R. W. Whitworth, Physics of Ice (Oxford University
Press, New York, 1999).
7F. Franks, Water, a Comprehensive Treatise (Plenum, New York, 1982),
Chap. 3, pp. 215–338.
8K. A. Jackson, D. R. Uhlmann, and J. D. Hunt,J. Cryst. Growth1, 1–36
(1967).
9S. W. Rick,J. Chem. Phys.120, 6085–6093 (2004).
10H. Nada and J. P. van der Eerden,J. Chem. Phys.118, 7401 (2003). 11C. Vega, E. Sanz, and J. L. F. Abascal,J. Chem. Phys.122, 114507 (2005). 12C. Vega and J. L. F. Abascal,Phys. Chem. Chem. Phys.13, 19663–19688
(2011).
13H. Nada and Y. Furukawa,J. Cryst. Growth283, 242 (2005).
14M. A. Carignano, P. B. Shepson, and I. Szleifer,Mol. Phys.103, 2957
(2005).
15J. L. F. Abascal, R. G. Fernández, C. Vega, and M. A. Carignano,J. Chem.
Phys.125, 166101 (2006).
16V. C. Weiss, M. Rullich, C. Köhler, and T. Frauenheim,J. Chem. Phys.135,
034701 (2011).
17W. Humphrey, A. Dalke, and K. Schulten, “VMD: Visual molecular
dy-namics,”J. Mol. Graphics14, 33–38 (1996).
18M. W. Mahoney and W. L. Jorgensen, J. Chem. Phys. 112, 8910
(2000).
19R. G. Fernández, J. L. F. Abascal, and C. Vega,J. Chem. Phys.124, 144506
(2006).
20R. G. Pereyra and M. Carignano,J. Phys. Chem. C113, 12699–12705
(2009).
21J. A. Hayward and J. R. Reimers,J. Chem. Phys.106, 1518 (1997). 22J. S. Kim and A. Yethiraj,J. Chem. Phys.129, 124504 (2008).
23B. Hess, C. Kutzner, D. van der Spoel, and E. Lindahl, “Gromacs 4:
Algo-rithms for highly efficient, load-balanced, and scalable molecular simula-tion,”J. Chem. Theory Comput.4, 435–447 (2008).
24G. Bussi, D. Donadio, and M. Parrinello,J. Chem. Phys.126, 014101
(2007).
25U. Essmann, L. Perera, M. L. Berkowitz, T. Darden, H. Lee, and L. G.
Pedersen,J. Chem. Phys.103, 8577 (1995).
26D. Rozmanov and P. G. Kusalik,Phys. Chem. Chem. Phys.13, 15501–
15511 (2011).
27J. E. Shilling, M. A. Tolbert, O. B. Toon, E. J. Jensen, B. J. Murray, and A.
K. Bertram,Geophys. Res. Lett.33, L17801, doi:10.1029/2006GL026671
(2006).
28H. Tanaka,J. Chem. Phys.108, 4887–4893 (1998).
29B. J. Murray, S. L. Broadley, T. W. Wilson, S. J. Bull, R. H. Wills, H. K.
Christenson, and E. J. Murray,Phys. Chem. Chem. Phys.12, 10380–10387
(2010).
30E. B. Moore and V. Molinero,Phys. Chem. Chem. Phys.13, 20008–20016
(2011).
31T. L. Malkin, B. J. Murray, A. V. Brukhno, J. Anwar, and C. G. Salzmann,
Proc. Natl. Acad. Sci. U.S.A.109, 1041–1045 (2012).
32M. A. Carignano,J. Phys. Chem. C111, 501–504 (2007).
33P. Pirzadeh and P. G. Kusalik,J. Am. Chem. Soc.133, 704–707 (2011). 34H. Nada,J. Phys. Chem. B113, 4790–4798 (2009).