Oviedo University Press 45 ISSN: 2254-4380
10(1), 45-57, 2021
Do Korean chaebols practice noblesse oblige?
Evidence from their CSR activities
Denis Yongmin Joe1 • Jiyoung Lee2 • Frederick Dongchuhl Oh3,*
1College of Global Business, Korea University, Sejong-Ro, Sejong-Si, Korea 2Risk Assessment Team, KYOBO Securities Co., Ltd., Uisadang-Daero, Yongdungpo-Gu, Seoul, Korea
3KAIST College of Business, Korea Advanced Institute of Science and Technology, Hoegi-Ro, Dongdaemoon-Gu, Seoul, Korea
Received: 7 January 2020 Revised: 14 May 2020 Accepted: 16 June 2020 Abstract
This study analyzes the corporate social responsibility (CSR) activities of the Korean chaebols to establish whether these firms engage in social duties and practice noblesse oblige. To measure the extent of the CSR activities, we use the index of the Korean Economic Justice Institute (KEJI) from 2005 to 2017. We find that the level of the CSR activity among chaebol firms with weak governance is low. Moreover, we show that chaebol firms with credit rating concerns reduce their CSR activities. Overall, our results indicate that Korean chaebols tend to neglect the CSR activities.
Keywords: corporate social responsibility; chaebol; credit ratings JEL Classification Codes: G32, G34
1. Introduction
“For those to whom much is given, much is required.”1
—John F. Kennedy (1917-1963) U.S. president-elect John F. Kennedy addressed the Joint Convention of the General Court of the Commonwealth of Massachusetts at The State House, Boston, on January 9, 1961. The above quotation has been remembered from this address and widely used over the years. It indicates that we are held responsible for what we have, which means that when a person has talent, wealth, knowledge, and benefits, he or she is expected to share these advantages with others.
* Corresponding author. E-mail: dcoh415@kaist.ac.kr.
Citation: Joe, D. Y., Lee, J., and Oh, F. D. (2021)Do Korean chaebols practice noblesse oblige? Evidence from their CSR activities, Economics and Business Letters, 10(1), 45-57.
DOI: 10.17811/ebl.10.1.2021.45-57
1 This is posted on the web site of the John F. Kennedy Presidential Library & Museum. The full script of the
46
10(1), 45-57, 2021
Korean business groups (i.e., chaebols) are examples of advantaged groups. After the Korean War, the Korean economy was underdeveloped; consequently, the Korean government required economic growth. Thus, the Park Chung-hee administration launched a rapid industrialization program with “the five-year economic development plan” in the 1960s. The development policy was export-oriented and conglomerate-oriented in order to obtain competitive advantage, an approach that contributed to the formation of chaebols. Such chaebols led economic growth by receiving financial incentives from the government, including low-interest bank loans and tax benefits. Thus, chaebols have played an important role in developing the Korean economy and have had priority for the receipt of benefits because economic development was regarded as the most important national task. Because of the remarkable growth caused by the success of the nationwide support plan for chaebols, Korea was ranked 11th on the list of the world’s economies in 2015. Further, because chaebol formation was fostered by national support, these firms have been encouraged to share their benefits with society. However, chaebols are often criticized for focusing only on increasing their profits rather than performing their social responsibilities (Nam, 2013). In this regard, we examine whether chaebols indeed perform their social duties and thereby practice noblesse oblige in terms of their corporate social responsibility (CSR) activities.2
Claessens et al. (2000) report that the dominant forces of large firms in East Asia, especially family controlled firms, show a significant gap between control rights (i.e., real power for management) and cash flow rights (i.e., claim rights on dividends and earnings). Korean chaebols also have such a gap. The owner and his family have a small percentage of the cash flow rights but the power of their management (i.e., the control rights) is immense (Kim and Kim, 2008). With such a large portion of control rights, they have strong economic incentives to seek private gain because of weak governance (Joh, 2003). Thus, in our study, we focus on the disparity between control rights and cash flow rights to measure this unique characteristic of chaebols. Specifically, we examine whether chaebols pay attention to CSR activities when their main characteristic (i.e., the “disparity” between control rights and cash flow rights) becomes stronger. The results in our study indicate that chaebols with weak governance (i.e., those that show significant disparity between control rights and cash flow rights) are less motivated to participate in CSR activities.
Credit ratings affect firm managers’ decisions. Kisgen (2006) shows that the manager whose firm has “credit rating concerns” (i.e., a high probability of moving to another credit rating) is more sensitive to the firm’s capital structure. Specifically, the manager reduces debt when the firm has a “plus or minus” credit rating. Bereskin et al. (2015) report that Korean firms with credit rating concerns improved their corporate governance after the 1997 Asian financial crisis and that this relation with credit ratings is more dominant in chaebols. Indeed, when credit ratings are evaluated, CSR activities are considered a positive factor. For example, according to Goss and Roberts (2011), credit rating agencies view investments in CSR as risk management. In other words, if investments in CSR lead to lower risk and better performance, then banks will provide more favorable loan terms to socially responsible firms. Further, Boutin-Dufresne and Savaria (2004) show that lower levels of firm idiosyncratic volatility are associated with higher CSR scores. In this study, we examine the relation between credit rating concerns and CSR activities. If chaebols consider CSR activities as important, they may increase their investment in such activities when they have credit rating concerns. Our results
2 In general, CSR means stakeholder-friendly activities beyond the benefits and compliance that firms should
follow (Nam and Jun, 2011). Specifically, it refers to long-term value by enhancing stakeholder engagement and limiting the probability of short-term opportunistic behavior (Cheng et al., 2014). According to Vilanova et al. (2009), CSR activities increase transparency because firms respect the law, disclose information truthfully, and protect stakeholders’ rights; thus, firms can improve their fundamentals when they perform CSR activities.
47
10(1), 45-57, 2021
indicate that those chaebols that have credit rating concerns are less active with regard to CSR activities.
Our paper contributes to the literature on CSR and chaebols in several areas. First, this study is the first to provide evidence on the relationship between the unique characteristic of chaebols (i.e., “disparity”) and their CSR activities. Whereas most prior studies regarding CSR and chaebols have been conducted with respect to the difference between chaebol firms and non-chaebol firms, we focus on the effect of disparity on CSR within non-chaebol firms. Second, our evidence has an important implication to investors and other stakeholders that the managerial incentive behind CSR can differ depending on a firm’s credit rating or corporate governance. Finally, evidence from our study is helpful to policymakers in better understanding the function and relationship between chaebol firms and their CSR activities.
The remainder of this paper is organized as follows: Section 2 presents a literature review and hypothesis development. Section 3 discusses our empirical approach and the associated data, and Section 4 follows with a discussion of our results. Finally, Section 5 presents the concluding remarks.
2. Related literature and hypothesis development
There are a number of studies on Korean business groups (i.e., chaebols). One of the prominent characteristics of chaebols is the disparity in the gap between control rights and cash flow rights of chaebol owners, who are typically the founders’ families. Under this governance structure, there is a strong possibility of them pursuing their own agendas or seeking private benefits using their controlling power (Byun et al., 2013). By considering their unique characteristic (i.e., “disparity”), we explore whether chaebols attach importance to their social duties. We predict that disparity relates to a high level of CSR activities because firms perform their CSR activities in order to enhance their reputations. Indeed, chaebols have been criticized for this high control-ownership disparity that gives an incentive to appropriate their firm resources at the expense of other shareholders (Joh, 2003). This is consistent with the argument that controlling shareholders benefit more from appropriating firm resources as the separation between control and ownership rights increases (Shleifer and Vishny, 1997). For this reason, chaebols with higher control-ownership disparity are under more pressure from society and government to engage in CSR activities. Thus, we expect that chaebols are more interested in CSR when their unique characteristic is stronger. Consequently, we posit our first hypothesis as follows:
Hypothesis 1: Chaebol firms with higher disparity engage in more CSR activities.
Attig et al. (2013) maintain that CSR activities affect credit ratings positively. Further, Kisgen (2006) reports that firms with “credit rating concerns” (i.e., firms with notch grades) reduce their debts. Bereskin et al. (2015) find that Korean firms with credit rating concerns have enhanced their corporate governance after the 1997 Asian financial crisis. Their research further notes that this result is evident in chaebol firms. Based on these studies, we argue that because CSR is a positive element for credit evaluation, firms with credit rating concerns promote more CSR activities in order to enhance their fundamentals. Thus, when chaebols have credit rating concerns, they may have a positive attitude toward CSR activities. Further, managers with credit rating concerns pay more attention to their CSR activities because these activities increase not only firms’ credit ratings but also their reputations and performances. Thus, we posit the following hypothesis:
Hypothesis 2: Chaebol firms are more likely to participate in CSR activities when they have credit rating concerns.
48
10(1), 45-57, 2021
3. Data and empirical methods
3.1. Data
This study uses a number of sources including the following: the Korea Economic Justice In-stitute (KEJI) for the CSR data; the Korea Fair Trade Commission (KFTC) for chaebol-related data; the FnGuide database for credit rating data; and the TS2000 database provided by the Korea Listed Companies Association for financial and accounting data.
To measure the extent of CSR activities, we use the KEJI Index from 2005 to 2017. The scores of this index are calculated by using various criteria including social and environmental as well as financial and legal perspectives. Specifically, the categories that comprise the KEJI Index are soundness, fairness, contributions to community service, satisfactory consumer protection, satisfactory environmental protection, and employee satisfaction. More detailed components of the categories are provided in the Appendix. We use these categories to calculate the total scores of the KEJI Index by equally weighting the score of each category and converting the total score to 100 for comparability.
The KFTC has provided information on chaebol-related data sets every year since 1986. The KFTC defines a chaebol in two steps: (1) stock ownership by controlling shareholders with the proportion of relevant persons greater than 30%; and (2) the total assets of the affiliated firms in the group (Almeida et al., 2015; Joe and Oh, 2018).3 The information includes a list of chaebol-affiliated firms, the controlling owner-family ownership, and the related people or organizations. Since we focus on the relation between the unique characteristic of chaebols and their CSR activities, we employ the measure for the separation of ownership structure (i.e., “disparity”), which is the difference between control rights and cash flow rights. Disparity is designated by Disparity in this study and calculated by subtracting the ownership proportion, which contains owner and owner-family shares, from the control proportion, which contains the amount of all owner-friendly shares. This data is only available for chaebol-affiliated firms. Our other major data set is the credit rating files, which are compiled from the FnGuide data-base. Specifically, we employ the measure of credit rating concerns used by Kisgen (2006) to examine those CSR activities that are more concerned with credit ratings. The explanatory var-iable of interest in this study is CC, which is defined as an indicator varvar-iable that is equal to one if the firm has a “notch” credit rating (i.e., the “plus” high-grade or “minus” low-grade of a letter rating, as opposed to the mid-grade of the letter rating) and zero otherwise.
3.2. Methodology
The impact of our key variables—disparity and credit rating concerns—on the KEJI Index is examined by using the following ordinary least squares (OLS) regressions:
(𝐀)𝐾𝐸𝐽𝐼𝑖,𝑡 = 𝛼0+ 𝛼1𝐷𝑖𝑠𝑝𝑎𝑟𝑖𝑡𝑦𝑖,𝑡−1 + 𝜀𝑖,𝑡 ; (𝐁) 𝐾𝐸𝐽𝐼𝑖,𝑡 = 𝛼0+ 𝛼1𝐷𝑖𝑠𝑝𝑎𝑟𝑖𝑡𝑦𝑖,𝑡−1+ 𝛼2𝐴𝑔𝑒𝑖,𝑡−1+ 𝛼3𝑆𝑖𝑧𝑒𝑖,𝑡−1+ 𝛼4𝑃𝑟𝑜𝑓𝑖𝑡𝑖,𝑡−1+ 𝛼5𝑅&𝐷𝑖,𝑡−1 +𝛼6𝐵𝑒𝑡𝑎𝑖,𝑡−1+ 𝛼7𝐴𝑑𝑣𝑒𝑟𝑡𝑖𝑠𝑒𝑚𝑒𝑛𝑡𝑖,𝑡−1+ 𝛼8𝐶𝑎𝑠ℎ𝑖,𝑡−1+ 𝛼9𝐷𝑖𝑣𝑖𝑑𝑒𝑛𝑑𝑖,𝑡−1 +𝛼10𝐼𝑛𝑣𝑒𝑠𝑡𝑚𝑒𝑛𝑡𝑖,𝑡−1 + 𝜀𝑖,𝑡 ; (𝐂) 𝐾𝐸𝐽𝐼𝑖,𝑡 = 𝛽0 + 𝛽1𝐶𝐶𝑖,𝑡−1 + 𝜐𝑖,𝑡 ; (𝐃) 𝐾𝐸𝐽𝐼𝑖,𝑡 = 𝛽0 + 𝛽1𝐶𝐶𝑖,𝑡−1 + 𝛽2𝐴𝑔𝑒𝑖,𝑡−1+ 𝛽3𝑆𝑖𝑧𝑒𝑖,𝑡−1+ 𝛽4𝑃𝑟𝑜𝑓𝑖𝑡𝑖,𝑡−1+ 𝛽5𝑅&𝐷𝑖,𝑡−1 +𝛽6𝐵𝑒𝑡𝑎𝑖,𝑡−1+ 𝛽7𝐴𝑑𝑣𝑒𝑟𝑡𝑖𝑠𝑒𝑚𝑒𝑛𝑡𝑖,𝑡−1+ 𝛽8𝐶𝑎𝑠ℎ𝑖,𝑡−1+ 𝛽9𝐷𝑖𝑣𝑖𝑑𝑒𝑛𝑑𝑖,𝑡−1+ 𝛽10𝐼𝑛𝑣𝑒𝑠𝑡𝑚𝑒𝑛𝑡𝑖,𝑡−1 + 𝑣𝑖,𝑡 .
3 The KFTC announced the 30 largest chaebol groups each year from 1986 to 2001 but then started using a new
criterion by including any group with total assets greater than a specific amount. This amount was two trillion won from 2002 to 2007 and five trillion won from 2008 onwards.
49
10(1), 45-57, 2021
Regressions (A) and (B) test whether the disparity is significantly positively associated with the KEJI index using chaebol firms. KEJI is the KEJI Index (i.e., the CSR score provided by firm i in year t). Disparity is the first key variable of firm i in year t-1, which is the gap between control rights and cash flow rights. Control rights consist of all ownership including that of a direct owner-family and other indirect but related ownership. Cash flow rights consist of just owner and owner-family ownership. We predict a plus sign for 𝛼1 (i.e., 𝛼1> 0), which would indicate that chaebol firms perform their social duties well.
Regressions (C) and (D) test whether credit rating concerns have a positive effect on CSR activities. CC indicates whether or not there is a credit rating concern for firm i in year t-1. When a credit rating has a “notch,” such as plus or minus, CC is equal to one and zero otherwise. The expected sign is positive (i.e., 𝛽1> 0), which would imply that credit rating concerns have
a positive impact on CSR activities. Chaebols with credit rating concerns focus on CSR activi-ties because such activiactivi-ties are considered a positive factor for credit agencies. In other words, chaebols perform their social duties because they are required by society to engage in CSR activities, which equates to the practice of noblesse oblige by large conglomerates.
We build several control variables that follow other CSR literature: Age is the age of firms by counting the number of years since they were founded (Cochran and Wood, 1984); Size is the scale measured by total sales with a natural logarithm (Hillman and Keim, 2001; Tsoutsoura, 2004); Profit is the ratio of net income and sales (i.e., net income/sales) that shows the financial performance of firms (McWilliams and Siegel, 2000; Oh et al., 2011; Tsoutsoura, 2004; Wad-dock and Graves, 1997); Beta is a market risk measure that refers to systematic risk (McGuire et al., 1988); and R&D and Advertisement are the expenses for R&D and advertising, respec-tively (McWilliams and Siegel, 2000; Padgett and Galan, 2010; Zhang et al., 2010). The latter two variables are normalized with total sales. Moreover, in order to control financial constraint when firms experience credit rating concerns, we use the following control variables: Cash is the ratio of cash holdings scaled by total assets; Dividend is an indicator variable with a value of one in the years in which a firm pays a common dividend; and Investment is CAPEX scaled by total assets.
4. Results
4.1. Sample statistics
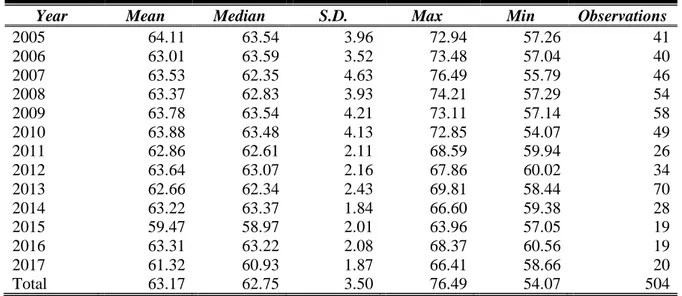
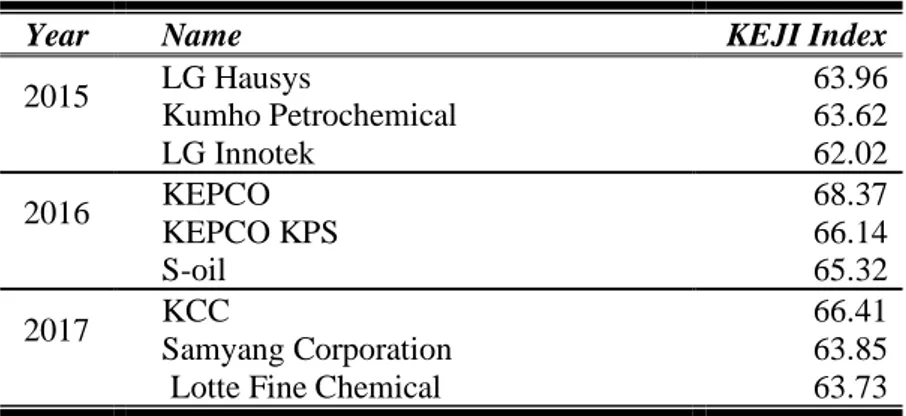
Panel A of Table 1 shows the descriptive statistics of the KEJI Index. It reports the means, standard deviations, and observations by year for our samples. The total average KEJI Index is 63.17 with a standard deviation of 3.50. There are 504 firm-year observations over the 2005-2017 period. Panel B of Table 1 reports the list of the top three chaebol firms that engage in CSR activities based on the highest scores of the KEJI Index by year. It also includes the firms’ scores on the KEJI Index. For example, the score of POSCO, which is most frequently reported on this list, is 72.94 in 2005. Interestingly, top three scores have been in a downtrend since 2010. However, the mean and median of KEJI Index scores do not show a huge change. This suggests that the deviations of scores among chaebol firms have decreased since 2010, which is consistent with the result that the standard deviation of KEJI Index by year significantly dropped after 2010.
Table 2 shows the summary statistics of the firms in our sample. The mean (median) of Dis-parity is 19.61 (17.85) with a standard deviation of 17.71 and the minimum value and maximum value of Disparity are zero and 99.17, respectively. This implies that the disparities between control rights and ownership rights of chaebol firms vary considerably among them.
50
10(1), 45-57, 2021
Table 1. The KEJI Index.
Panel A: The KEJI Index by Year
Year Mean Median S.D. Max Min Observations
2005 64.11 63.54 3.96 72.94 57.26 41 2006 63.01 63.59 3.52 73.48 57.04 40 2007 63.53 62.35 4.63 76.49 55.79 46 2008 63.37 62.83 3.93 74.21 57.29 54 2009 63.78 63.54 4.21 73.11 57.14 58 2010 63.88 63.48 4.13 72.85 54.07 49 2011 62.86 62.61 2.11 68.59 59.94 26 2012 63.64 63.07 2.16 67.86 60.02 34 2013 62.66 62.34 2.43 69.81 58.44 70 2014 63.22 63.37 1.84 66.60 59.38 28 2015 59.47 58.97 2.01 63.96 57.05 19 2016 63.31 63.22 2.08 68.37 60.56 19 2017 61.32 60.93 1.87 66.41 58.66 20 Total 63.17 62.75 3.50 76.49 54.07 504
Panel B: The Top Three Chaebols Engaged in CSR Activities
Year Name KEJI Index
2005 POSCO 72.94 LG Life Sciences 71.81 SK Holdings 71.59 2006 KT&G 73.48
Lotte Chilsung Beverage 69.24
POSCO 68.92 2007 KT&G 76.49 POSCO 73.75 LG Life Sciences 70.50 2008 POSCO 74.21 KT&G 73.64 KT Corporation 71.60 2009 POSCO 73.11 Namhae Chemical 71.05 KT Corporation 70.81 2010 SK Chemicals 72.85 POSCO 72.58 CJ Cheiljedang Corporation 72.27 2011 POSCO 68.59
Hyundai Engineering & Construction 66.11
Hyundai Mobis 65.54 2012 LG Chem 67.86 CJ Cheiljedang Corporation 67.42 Samsung Electro-Mechanics 67.41 2013 KT&G 69.81 LG Chem 68.10 POSCO 66.48 2014 SK Hynix 66.60 LG Chemical 65.61 KCC 65.55
51
10(1), 45-57, 2021
Table 1. The KEJI Index (cont.).
Panel B: The Top Three Chaebols Engaged in CSR Activities
Year Name KEJI Index
2015 LG Hausys 63.96 Kumho Petrochemical 63.62 LG Innotek 62.02 2016 KEPCO 68.37 KEPCO KPS 66.14 S-oil 65.32 2017 KCC 66.41 Samyang Corporation 63.85 Lotte Fine Chemical 63.73
Note: This table shows the descriptive statistics of the KEJI Index that is used in our sample. The
KEJI Index is an indicator for evaluating CSR activities and is provided by the Korea Economic Justice Institute. Panel A summarizes the distribution of the KEJI Index by year. Panel B reports the list of the top three chaebols based on the highest scores of the KEJI Index by year.
Table 2. Summary Statistics.
Mean Median S.D. Min Max Observations
KEJI 63.17 62.75 3.50 54.07 76.49 504 Disparity 19.61 17.85 17.71 0.00 99.17 504 CC 0.58 1.00 0.49 0.00 1.00 414 Age 33.98 35.00 15.85 1.00 74.00 504 Size 21.53 21.58 1.59 16.57 26.16 504 Leverage 0.08 0.06 0.23 -0.26 4.90 504 Profit 0.24 0.18 0.19 0.00 0.90 504 Beta 0.95 0.94 0.44 -0.04 2.29 504 R&D 0.03 0.01 0.26 0.00 5.39 504 Advertisement 0.01 0.00 0.02 0.00 0.13 504 Cash 0.06 0.05 0.05 0.00 0.30 504 Dividend 0.93 1.00 0.25 0.00 1.00 504 Investment 0.06 0.03 0.08 0.00 0.74 504
Note: This table shows the summary statistics of the firms in our sample. KEJI is the KEJI Index provided by the Korea
Economic Justice Institute and is the score for CSR activities. Disparity is the gap between control rights and ownership rights. We compute disparity by subtracting ownership rights (i.e., the percentage of ownership proportion) from the control proportion that contains the amount of owner-friendly shares. CC is credit rating concerns and is defined as an indicator variable that is equal to one if the firm has a “notch” credit rating. Age is the age of firms. Size, Profit, Beta,
R&D, Advertisement, Cash, and Investment are calculated as total sales with a natural logarithm, net income to total
sales, long-term debts to assets, market systematic risk, R&D cost to total sales, advertising cost to total sales, cash holdings scaled by total assets, and CAPEX scaled by total assets, respectively. Dividend is an indicator variable equal to one in the years in which a firm pays a common dividend, and zero otherwise.
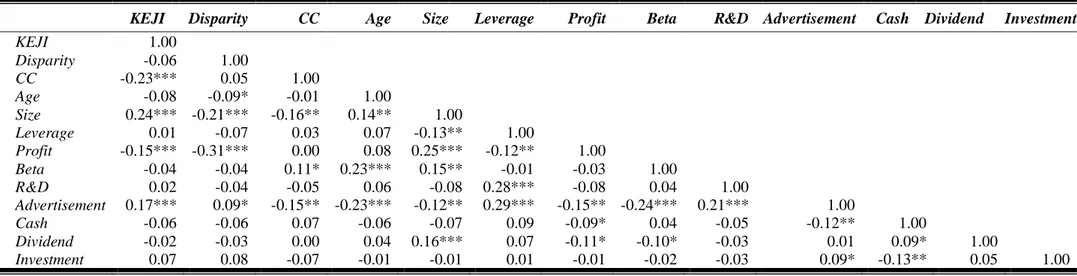
In Table 3, we report the pairwise correlations between the variables to mitigate concerns that multicollinearity could affect our multivariate regression results. We show low correlation co-efficients among the variables, which suggests that we can safely rule out any multicollinearity problem.4 Moreover, the results indicate that the correlation coefficients between KEJI and Dis-parity and between KEJI and CC are negative, which is contrary to expectation. This implies the possibility that chaebol firms are not interested in CSR activities.
4 Moreover, we measure the degree of multicollinearity by employing the variance inflation factor (VIF) (O’Brien,
2007). A commonly given rule of thumb is that VIFs of 10 or higher are unacceptable. However, the mean VIF is 1.76 when we use all our variables in Table 2. As a result, we verify that multicollinearity is not a significant issue affecting our main results.
52 10(1), 45-57, 2021
Table 3. Correlation Matrix.
KEJI Disparity CC Age Size Leverage Profit Beta R&D Advertisement Cash Dividend Investment
KEJI 1.00 Disparity -0.06 1.00 CC -0.23*** 0.05 1.00 Age -0.08 -0.09* -0.01 1.00 Size 0.24*** -0.21*** -0.16** 0.14** 1.00 Leverage 0.01 -0.07 0.03 0.07 -0.13** 1.00 Profit -0.15*** -0.31*** 0.00 0.08 0.25*** -0.12** 1.00 Beta -0.04 -0.04 0.11* 0.23*** 0.15** -0.01 -0.03 1.00 R&D 0.02 -0.04 -0.05 0.06 -0.08 0.28*** -0.08 0.04 1.00 Advertisement 0.17*** 0.09* -0.15** -0.23*** -0.12** 0.29*** -0.15** -0.24*** 0.21*** 1.00 Cash -0.06 -0.06 0.07 -0.06 -0.07 0.09 -0.09* 0.04 -0.05 -0.12** 1.00 Dividend -0.02 -0.03 0.00 0.04 0.16*** 0.07 -0.11* -0.10* -0.03 0.01 0.09* 1.00 Investment 0.07 0.08 -0.07 -0.01 -0.01 0.01 -0.01 -0.02 -0.03 0.09* -0.13** 0.05 1.00
Note: This table presents pairwise correlation coefficients between the regression variables. All variables are defined in Table 2. The sample comprises 504
firm-year observations over the 2005-2017 period except CC, which consists of 414 firm-year observations.The significance at the 10%, 5%, and 1% levels is indicated by *, **, and ***, respectively.
53
10(1), 45-57, 2021
Table 4. Disparity and CSR.
(1) (2) (3) (4) KEJI Disparity -0.025*** -0.023** -0.025** -0.025* (-2.65) (-2.53) (-2.01) (-1.88) Age -0.012 0.034 (-1.20) (0.07) Size 0.709*** 0.559** (6.77) (1.97) Profit -0.296 -0.356 (-0.83) (-1.07) Leverage -2.938*** -0.83 (-3.02) (-0.42) Beta -0.676* -0.025 (-1.88) (-0.05) R&D -0.139 0.194 (-0.35) (0.93) Advertisement 25.795*** -1.738 (3.17) (-0.13) Cash -2.024 -1.602 (-0.65) (-0.46) Dividend -1.464** -0.593 (-2.41) (-0.56) Investment 2.329 0.895 (1.25) (0.43) Adjusted R-Squared 0.063 0.171 0.56 0.552 Observations 504 504 504 504
Year Fixed Effects No No Yes Yes
Firm Fixed Effects No No Yes Yes
Note: This table shows estimates of OLS regressions with the KEJI Index as the dependent
variable. The independent variables are as follows: Disparity is calculated by subtracting the ownership proportion, which contains owner and owner-family shares, from the control proportion, which contains the fraction of owner-friendly shares. Age is the age of firms.
Size, Profit, Beta, R&D, Advertisement, Cash, and Investment are calculated as total sales
with a natural logarithm, net income to total sales, market systematic risk, R&D cost to total sales, advertising cost to total sales, cash holdings scaled by total assets, and CAPEX scaled by total assets, respectively. Dividend is an indicator variable equal to one in the years in which a firm pays a common dividend, and zero otherwise. t-statistics are in pa-rentheses. The standard errors are adjusted for clustering at the firm level. The significance at the 10%, 5%, and 1% levels is indicated by *, **, and ***, respectively.
4.2. Effects of Disparity on CSR
In Table 4, by performing regressions, we find the negative effect of Disparity on KEJI. The coefficients for Disparity are negative and statistically significant for all four regressions. Over-all, the results of Table 4 show that chaebol firms participate less in CSR activities when their characteristic (i.e., “disparity”) is stronger. This is consistent with the view that chaebols focus on pursuing their own agendas rather than performing CSR activities or satisfying social de-mand.
54
10(1), 45-57, 2021
4.3. Effects of Credit Rating Concerns on CSR
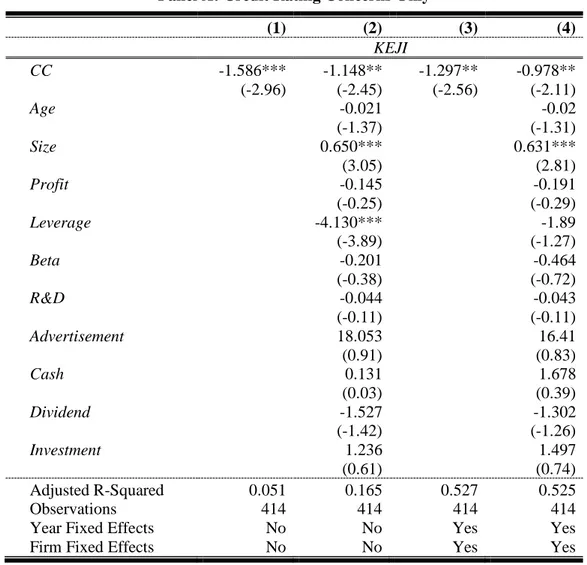
Panel A of Table 5 reports the negative effect of CC (i.e., credit rating concerns) on the KEJI Index. We find that the coefficients for CC are significantly negative for all regressions and statistically significant at the 5% level. Based on Regression (4), chaebol firms near rating changes are associated with an approximately 0.978 point decrease in KEJI Index after control-ling for additional explanatory variables. These results indicate that chaebols with credit rating concerns have a more negative impact on CSR.5
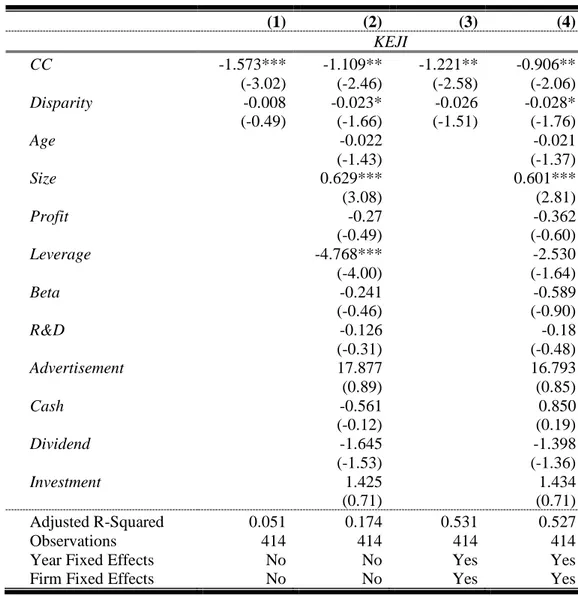
In Panel B, we simply repeat our prior regression of Panel A by adding Disparity as an inde-pendent variable. This enables us to control for the effect of disparity when interpreting the results for CC and vice versa. The results of Regressions (2) and (4) show that the coefficients for CC and Disparity are still negative and significant at least at the 10% level, which indicates that the negative effect of credit rating concerns on CSR activities is significant even after con-trolling for the effect of disparity on CSR activities and vice versa. Overall, this is consistent with the view that chaebols do not regard CSR as an important value.
Table 5. Credit Rating Concerns and CSR.
Panel A: Credit Rating Concerns Only
(1) (2) (3) (4) KEJI CC -1.586*** -1.148** -1.297** -0.978** (-2.96) (-2.45) (-2.56) (-2.11) Age -0.021 -0.02 (-1.37) (-1.31) Size 0.650*** 0.631*** (3.05) (2.81) Profit -0.145 -0.191 (-0.25) (-0.29) Leverage -4.130*** -1.89 (-3.89) (-1.27) Beta -0.201 -0.464 (-0.38) (-0.72) R&D -0.044 -0.043 (-0.11) (-0.11) Advertisement 18.053 16.41 (0.91) (0.83) Cash 0.131 1.678 (0.03) (0.39) Dividend -1.527 -1.302 (-1.42) (-1.26) Investment 1.236 1.497 (0.61) (0.74) Adjusted R-Squared 0.051 0.165 0.527 0.525 Observations 414 414 414 414
Year Fixed Effects No No Yes Yes
Firm Fixed Effects No No Yes Yes
5 To mitigate the reverse causality and omitted variable concerns, we run a two-stage least-squares approach with
55
10(1), 45-57, 2021
Table 5. Credit Rating Concerns and CSR (cont.).
Panel B: Credit Rating Concerns and Disparity
(1) (2) (3) (4) KEJI CC -1.573*** -1.109** -1.221** -0.906** (-3.02) (-2.46) (-2.58) (-2.06) Disparity -0.008 -0.023* -0.026 -0.028* (-0.49) (-1.66) (-1.51) (-1.76) Age -0.022 -0.021 (-1.43) (-1.37) Size 0.629*** 0.601*** (3.08) (2.81) Profit -0.27 -0.362 (-0.49) (-0.60) Leverage -4.768*** -2.530 (-4.00) (-1.64) Beta -0.241 -0.589 (-0.46) (-0.90) R&D -0.126 -0.18 (-0.31) (-0.48) Advertisement 17.877 16.793 (0.89) (0.85) Cash -0.561 0.850 (-0.12) (0.19) Dividend -1.645 -1.398 (-1.53) (-1.36) Investment 1.425 1.434 (0.71) (0.71) Adjusted R-Squared 0.051 0.174 0.531 0.527 Observations 414 414 414 414
Year Fixed Effects No No Yes Yes
Firm Fixed Effects No No Yes Yes
Note: This table shows estimates of OLS regressions with the KEJI Index as the dependent variable. CC
indicates credit rating concerns and has “notched” credit ratings that have a plus or minus sign. Other variables are defined in Table 4. The results are reported in Panel A. In Panel B, Disparity is added as an independent variable. t-statistics are in parentheses. The standard errors are adjusted for clustering at the firm level. The significance at the 10%, 5%, and 1% levels is indicated by *, **, and ***, respectively.
5. Conclusion
This study provides evidence on the behavior of chaebols in terms of CSR. We document a statistically significant negative association between governance quality and CSR activities. Moreover, we find that chaebols with credit rating concerns are not actively involved with CSR activities although their credit evaluation is affected by their CSR activities. In short, CSR is still not an important issue for Korean chaebols.
With this study, there is an important practical implication for chaebols to encourage them to support CSR activities. When policymakers introduce guidelines to promote participation in CSR activities, they are trying to persuade chaebols to pay attention to their social duties. In this respect, the policymakers need to focus on utilizing attractive incentives such as offering taxation support, financial aid, or mitigation of regulation. Policymakers should also maintain this policy for a long period in order to ensure that it is applied well.
56
10(1), 45-57, 2021
Acknowledgments
We are very grateful to the editor (Francisco J. Delgado) and a reviewer for their guidance and constructive comments. We also thank Hyung Seok Kim and Jinyong Kim for their helpful comments. Any remaining errors are ours.
References
Almeida, H., Kim, C. S., and Kim, H. B. (2015) Internal capital markets in business groups: evidence from the Asian financial crisis, Journal of Finance, 70(6), 2539-2586.
Amihud, Y. (2002) Illiquidity and stock returns: cross-section and time-series effects, Journal of Financial Markets, 5(1), 31-56.
Attig, N., El Ghoul, S., Guedhami, O., and Suh, J. (2013) Corporate social responsibility and credit ratings, Journal of Business Ethics, 117(4), 679-694.
Bereskin, F., Kim, B., and Oh, F. D. (2015) Do credit rating concerns lead to better corporate governance? Evidence from Korea, Pacific-Basin Finance Journal, 35(PB), 592-608.
Boutin-Dufresne, F., and Savaria, P. (2004) Corporate social responsibility and financial risk, Journal of Investing, 13(1), 57-66.
Byun, H. S., Lee, J. H., and Park, K.S. (2013) Impact of controlling shareholders on corporate social responsibility under external financial constraints, Korean Finance Association Sym-posium, 546-580
Cheng, B., Ioannou, I., and Serafeim, G. (2014) Corporate social responsibility and access to finance, Strategic Management Journal, 35(1), 1-23.
Claessens, S., Djankov, S., and Lang, L. H. (2000) The separation of ownership and control in East Asian corporations, Journal of Financial Economics, 58(1), 81-112.
Cochran, P. L., and Wood, R. A. (1984) Corporate social responsibility and financial perfor-mance, Academy of Management Journal, 27(1), 42-56.
Goss, A., and Roberts, G. S. (2011) The impact of corporate social responsibility on the cost of bank loans, Journal of Banking and Finance, 35(7), 1794-1810.
Hillman, A. J. and Keim, G. D. (2001) Shareholder value, stakeholder management, and social issues: what's the bottom line?, Strategic Management Journal, 22(2), 125-139.
Joe, D. Y., and Oh, F. D. (2018) Spillover effects within business groups: the case of Korean chaebols, Management Science, 64(3), 1396-1412.
Joh, S. W. (2003) Corporate governance and firm profitability: evidence from Korea before the economic crisis, Journal of Financial Economics, 68(2), 287-322.
Kim, E. H., and Kim, W. (2008) Changes in Korean corporate governance: a response to crisis, Journal of Applied Corporate Finance, 20(1), 47-58.
Kisgen, D. J., (2006) Credit ratings and capital structure, Journal of Finance, 61(3), 1035-1072. McGuire, J. B., Sundgren, A., and Schneeweis, T. (1988) Corporate social responsibility and
firm financial performance, Academy of Management Journal, 31(4), 854-872.
McWilliams, A., and Siegel, D. (2000) Corporate social responsibility and financial perfor-mance: correlation or misspecification?, Strategic Management Journal, 21(5), 604-609 Nam, Y. S. (2013) The changing landscape of corporate social responsibility in Korea, Revista
de EDUCAÇÃO do Cogeime, 20(38), 145-158.
Nam, Y. S., and Jun, H. (2011) The shaping of corporate social responsibility in Korea’s eco-nomic development, Global Journal of Business Management and Accounting, 1(1), 10-20. O’Brien, R. M. (2007) A caution regarding rules of thumb for variance inflation factors, Quality
57
10(1), 45-57, 2021
Oh, W. Y., Chang, Y. K., and Martynov, A. (2011) The effect of ownership structure on cor-porate social responsibility: empirical evidence from Korea, Journal of Business Ethics, 104(2), 283-297.
Padgett, R. C., and Galan, J. I. (2010) The effect of R&D intensity on corporate social respon-sibility, Journal of Business Ethics, 93(3), 407-418.
Shleifer, A., and Vishny, R. W. (1997) A survey of corporate governance, Journal of Finance, 52(2), 737-783.
Tsoutsoura, M. (2004) Corporate social responsibility and financial performance, working pa-per, University of California.
Vilanova, M., Lozano, J. M., and Arenas, D. (2009) Exploring the nature of the relationship between CSR and competitiveness, Journal of Business Ethics, 87(1), 57-69.
Waddock, S. A., and Graves, S. B. (1997) The corporate social performance-financial perfor-mance link, Strategic Management Journal, 18(4), 303-319.
Zhang, R., Zhu, J., Yue, H., and Zhu, C. (2010) Corporate philanthropic giving, advertising intensity, and industry competition level, Journal of Business Ethics, 94(1), 39-52.
Appendix - Categories of the KEJI Index
Category Evaluation Items
Soundness
- Soundness of ownership structure - Soundness of expenditure
- Soundness of investment capital
Fairness
- Fairness of trade
- Transparency of management - Cooperative relations
Contributions to community service - Protection for minority groups - Social contribution (donations)
Satisfactory consumer protection
- Protection of consumer rights - Quality certification
- Suitable expenses for advertising Satisfactory environmental
protection
- Efforts to improve the environment - Environmental friendliness
- Record on violation and pollution
Employee satisfaction
- Safety of workplace
- Investment in human capital - Salary and welfare
- Relation between labor and capital - Gender equality in labor market