저작자표시-비영리-변경금지 2.0 대한민국 이용자는 아래의 조건을 따르는 경우에 한하여 자유롭게
l 이 저작물을 복제, 배포, 전송, 전시, 공연 및 방송할 수 있습니다. 다음과 같은 조건을 따라야 합니다:
l 귀하는, 이 저작물의 재이용이나 배포의 경우, 이 저작물에 적용된 이용허락조건 을 명확하게 나타내어야 합니다.
l 저작권자로부터 별도의 허가를 받으면 이러한 조건들은 적용되지 않습니다.
저작권법에 따른 이용자의 권리는 위의 내용에 의하여 영향을 받지 않습니다. 이것은 이용허락규약(Legal Code)을 이해하기 쉽게 요약한 것입니다.
Disclaimer
저작자표시. 귀하는 원저작자를 표시하여야 합니다.
비영리. 귀하는 이 저작물을 영리 목적으로 이용할 수 없습니다.
변경금지. 귀하는 이 저작물을 개작, 변형 또는 가공할 수 없습니다.
工學碩士學位論文
Fabrication of phosphorene using black phosphorus and its electro-responsive
behaviors
흑린으로부터의 포스포린 제조와 전기 반응성 거동 분석
2020
年02
月서울大學校 大學院
化學生物工學部
李 예 리
Fabrication of phosphorene using black phosphorus and its electro-responsive behaviors
흑린으로부터의 포스포린 제조와 전기 반응성 거동 분석
指導敎授 張 正 植
이 論文을 工學碩士 學位論文으로 提出함 2019 年 12 月
서울大學校 大學院 化學生物工學部
李 예 리
李예리의 工學碩士 學位論文을 認准함 2019 年 12 月
委 員 長 (印)
副委員長 (印)
委 員 (印)
Abstract
Fabrication of phosphorene using black phosphorus and its electro-responsive
behaviors
Yeri Lee School of Chemical and Biological Engineering The Graduate School Seoul National University
Black phosphorus (BP) and phosphorene are successfully fabricated and applied as the electro-responsive smart fluid. The correlation between the degree of phase transition of BP and electro-responsive (ER) activity is investigated by utilizing BP to ER fluid. In addition, the relationship between thickness and ER performance is identified by introducing phosphorene to ER fluid. Red phosphorus is selected as a precursor of BP for mass production, and the prepared BP is delaminated to phosphorene by liquid-phase exfoliation.
Herein, this research describes a simple method to fabricate BP by inducing phase transition via mechanochemical ball-mill process depending on milling duration. Also, this demonstrates the production of phosphorene
with controllable thickness as a function of exfoliation time through liquid- phase exfoliation in solvent. The BP milled for 24 h exhibits the relatively higher ER effect under a certain electric field strength due to the higher degree of phase transition and electrical conductivity. Phosphorene exfoliated for 2 h shows the higher ER activity than that exfoliated for 6 h owing to morphological changes during exfoliation. Consequently, the degree of phase transition as well as exfoliation affect the morphology and characteristics of BP, thus enhancing ER performance of BP- and phosphorene-based ER fluids.
Keywords: Smart fluid, black phosphorus, phosphorene, phase transition, mechanochemical ball mill, exfoliation, electrical conductivity, electrorheological fluid
Student Number: 2018-26555
List of Abbreviations
A: Cross-sectional area
AFM: Atomic force microscopy BP: Black phosphorus
Cd: Drag coefficient
DMF: Dimethylformamide E: Electric field
ER fluid: Electrorheological fluid Fd: Dynamic drag force
HR-TEM: High-resolution transmission electron microscope IPA: Propan-2-ol
JCPDS: Joint committee on Powder Diffraction Standard NMP: 1-Methyl-2-pyrrolidone
RP: Red phosphorus
TMDs: Transition metal dichalcogenides TEM: Transmission electron microscope XRD: X-ray diffraction
η: Viscosity
σ: Electrical conductivity
τ: Shear stress τy: Yield stress 𝛾𝛾̇: Shear rate τt: Relaxation time ρ: Density
1D: One-dimensional 2D: Two-dimensional:
List of Figures
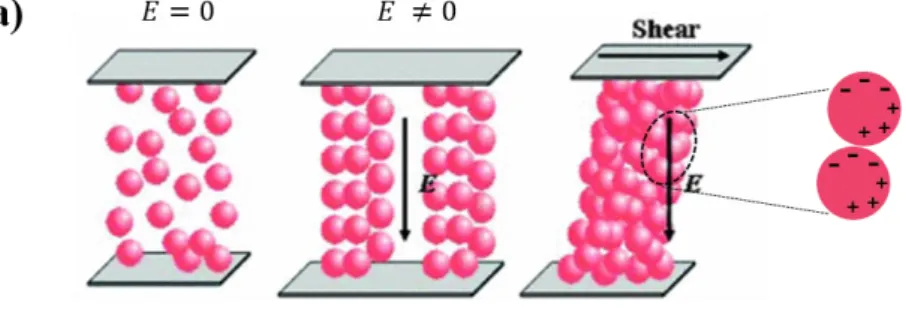
Figure 1. Schematic diagrams of ER behavior and extrinsically polarizable ER fluid. a) Side view of ER fluid under and electric field (E) and shear rate (𝛾𝛾̇). b) Optical microscopy images of ER fluid with and without an electric field.
Figure 2. The structure of BP and phosphorene. a) A digital picture of BP crystal, b) orthorhombic structure of BP (a=3.31 Å, b=4.38 Å, c=10.50 Å, α=β=γ=90°) consisting of AB stacked layers bonded by weak forces, and c) the puckered structure of phosphorene.
Figure 3. The illustration of liquid-phase exfoliation process of BP. Ultra- sound is utilized to exfoliate bulk BP, resulting to produce the phosphorene.
Figure 4. A schematic illustration of synthesis of bulk BP by ball milling RP and phosphorene through liquid-phase exfoliation using ultra- sonication.
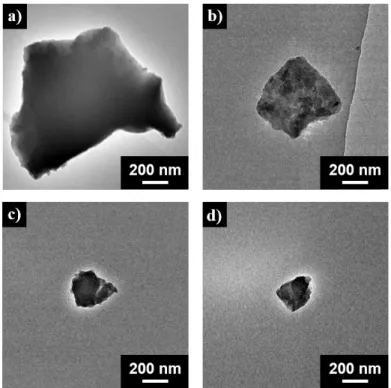
Figure 5. TEM images of RP, BP and phosphorene as a function of exfoliation a) RP, b) BP milled for 24 h, and c-d) phosphorene exfoliated for 2 h and 6 h, respectively.
Figure 6. a) The HR-TEM image of as-prepared BP by ball mill showing lattice fringes. The d-spacing of BP is 0.21 nm attributed to (002) plane of BP according to ICDD-PDF: No. 76-1963. B) SAED pattern of as-prepared BP in accordance with the HR-TEM image.
Figure 7. AFM images and height profiles of a) RP, b) BP milled for 24 h, and phosphorene exfoliated for c) 2 h and d) 6 h, respectively. RP, BP and phosphorene were deposited on a silicon wafer for AFM measurement.
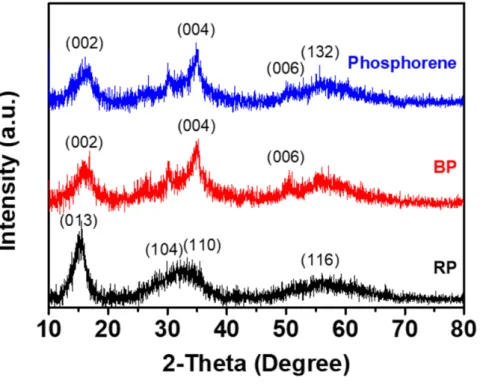
Figure 8. X-ray diffraction patterns of the RP, BP and phosphorene. RP exhibited two significant peaks at 15.5° and 34.8° in accordance with (013) and (31-8) (JCPDS No. 44-0906). As-synthesized BP and phosphorene show three characteristic peaks at 16.2°, 34.8°
and 50.0° in agreement with (002), (004) and (006), corresponding to orthorhombic structure of BP.
Figure 9. A schematic of the vibration mode of BP atoms in the different phonon mode.
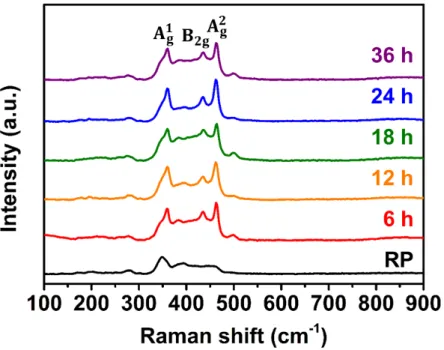
Figure 10. Raman spectra of RP and BP milled as a function of milling time from 6 h to 36 h. The out-of-plane mode is 𝐴𝐴𝑔𝑔1 and in-plane modes are 𝐵𝐵2𝑔𝑔 and 𝐴𝐴𝑔𝑔2, respectively
Figure 11. Raman spectra of 24 h-milled BP and phosphorene in terms of exfoliation time.
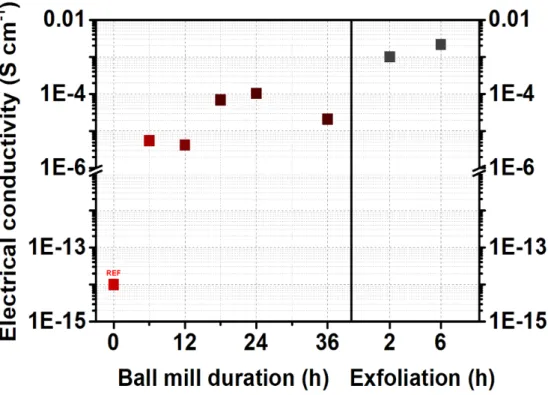
Figure 12. The electrical conductivity of BP and phosphorene in terms of milling and exfoliation time.
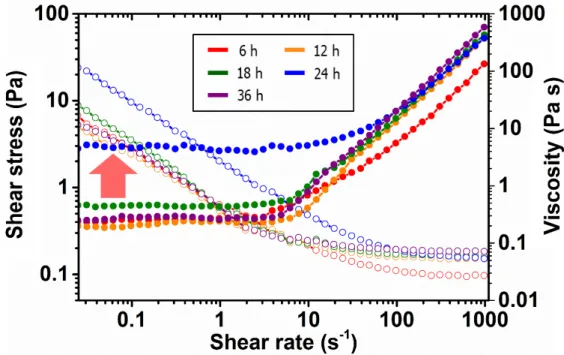
Figure 13. Shear stress and viscosity as a function of milling time for 1 wt%
BP in silicone oil under 0.5 kV mm–1.
Figure 14. Shear stress and viscosity for 1 wt% BP in silicone oil under a) 0.01 and b) 0.5 kV mm–1.
Figure 15. Shear stress and shear viscosity of 24 h-milled BP, phosphorene exfoliated for 2 h and 6 h-based ER fluids (1 wt% in silicone oil under 0.5 kV/mm of electric field).
List of Tables
Table 1. The lateral size of BP depending on the milling and exfoliation time (unit: nm)
Contents
Abstract……… ... i
List of Abbreviations. ... iii
List of Figures ... v
List of Tables . ... viii
Contents… . ... ix
Chapter 1. Introduction ... 1
1.1 Electrorheological fluids ... 1
1.2 Black phosphorus and phosphorene ... 4
1.3 Objective of this study ... 9
Chapter 2. Experimental ... 10
2.1 Materials ... 10
2.2 Preparation of bulk BP ... 10
2.3 Preparation of phosphorene ... 11
2.4 Characterization ... 11
Chapter 3. Results and discussion ...
133.1 Synthesis of BP and phosphorene ... 13
3.2 Characterization of BP and phosphorene ... 16
3.2.1 Morphology of BP and phosphorene
...
163.2.2 Crystalline structure of BP and phosphorene ... 23
3.3 Electrical conductivity of BP and phosphorene. ... 30
3.4 Stimul-responsive properties. ... 33
3.4.1 Flow curves of the ER fluid ... .33
3.4.2 The effect of morphology on ER performance ... 39
Chapter 4. Conclusion ... 42
References ... 43
국문초록 ... 49
Chapter 1. Introduction
1.1 Electrorheological fluids
Electrorheological (ER) fluids, which are colloidal suspensions of polarizable particles dispersed in an insulating medium such as silicone and mineral oil, have a great deal of attention to their unique characteristics, including fast responses, simple fluid mechanics, reversible behavior, and low operating power [1–8]. Without an electric field, the ER fluids exhibit Newtonian behavior or shear thinning [17]. However, the ER fluids generally show well-defined non-linear flow curve under applied external electric field strength due to the electrostatic interactions of ER fluids [17]. The dispersed ER fluids are polarized and attracted each other to transform randomly orientated the fluids into chain-like structure within an electric field (Figure 1) [6,17,18]. The formation of chain-like structures induces an increase of shear viscosity, shear stress and modulus [21]. This non-Newtonian fluid behavior is generally described as Bingham fluid. Hence, the ER fluids are regarded as stimuli-responsive smart fluids whose properties can be transformed by external stimulus [9]. For these reasons, ER smart fluids are widely applied in human muscle stimulators, shock absorbers, dampers and
transducers [4,10,11]. A variety of polarizable particles have been utilized as ER fluids including inorganic, organic, metallic, polymeric and hybrid materials [4, 12–16]. It has been investigated that ER performance of the ER fluids depends on the dielectric permittivity, electrical conductivity, structure, density and morphology such as size and aspect ratio [5,22–24].
Compared to sphere-shaped materials and one-dimensional (1D) structures, there have been relatively few reports focusing on the ER performance of two-dimensional (2D) material; Jang et al., reported that sheet- like morphology improved ER performance compared to spherical shape due to the higher shear stress applied per unit sheet area [26]. Yin et al. reported that the chain-like structures which appear when an electric field was applied were shown to be much stronger when they are composed of sheet-like form compared to spherical type of the particles [9].
Figure 1. Schematic diagrams of the ER behavior and extrinsically polarizable ER fluid. a) Side view of ER fluid under an electric field (E) and shear rate (𝛾𝛾̇). b) Optical microscopy images of ER fluid with and without an electric field.
1.2 Black phosphorus and phosphorene
Over the last few years, 2D nanomaterials such as graphene [24,25], molybdenum disulfide (MoS2) [26,27] and transition metal dichalcogenides (TMDs) [28–30] have attracted great attention and exhibited tremendous impact in various field due to their unique properties. Owing to their interesting properties, 2D nanomaterials have been investigated with the number of layers and have shown noteworthy differences in the mechanical, physical and chemical properties [31]. Among 2D nanomaterials, black phosphorus (BP), allotrope of phosphorus, has been paid much attention as a prospective candidate for complementing 2D nanomaterials shortcomings.
BP generally has an orthorhombic structure and is comprised of AB stacked layers of sp3-hybridized phosphorus with weak van der Waals interaction which leads to a puckered honeycomb structure including armchair and zigzag directions (Figure 2) [32,33]. Therefore, BP has different lattice constants depending on the direction; armchair direction (4.38 Å) and zigzag direction (3.31 Å) [34]. Additionally, BP possesses high carrier mobility (>
1000 cm2 V–1 s–1), thickness-dependent band gap (0.3–2 eV) [35–37]. These properties of BP can be utilized for the sensing, energy storage, and high frequency electronics [38–48]. However, the process of synthesizing BP is not simple and requires high pressure and temperature. For example, BP was first
synthesized from white phosphorus under high pressure conditions (1.2 GPa, 200 ℃) in 1914 [43,44]. And, it is prepared by heating red phosphorus with Au-catalyst and tin (IV) iodide at low pressure (600 ℃) [45]. Thus, it is essential to find simple synthesis method of BP for application.
Phosphorene, mono- or few-layer form of black phosphorus, can be fabricated by exfoliation. It exhibits the remarkable properties compared to BP such as higher carrier mobility [46]. Irrespective of its properties, its lack of environmental stability limits application. This suggests that since the exfoliation method affects the properties of phosphorene, it is necessary to synthesize for environmentally stable phosphorene.
The general process for producing single- or few-layer of 2D nanomaterials is micromechanical exfoliation which denotes a top-down approach, referred to as a scotch-tape method. Micromechanical exfoliation is commonly utilized to exfoliate 2D materials such as graphene, MoS2 and h- BN [47–51]. Although this method isolates bulk crystal to mono- or few-layer sheets with the highest crystal quality, it is not a scalable process [32,46,52].
Liquid-phase exfoliation, versatile process for producing sizable nanosheets, is utilized to resolve this problem [31,53]. Coleman et al. has reported that liquid-phase exfoliation involved the sonication of layered materials in proper solvent and has been employed to WS2, MoSe2, MoTe2, TaSe2, NbSe2, NiTe2
and graphene [54,55].
It has been reported that the BP has been exfoliated by liquid-phase exfoliation, but it requires the stabilization of BP since it is unstable (Figure 3) [56–58]. For producing stable phosphorene, appropriate solvent must be used in liquid-phase exfoliation.
Figure 2. The structure of BP and phosphorene. a) A digital picture of BP crystal, b) orthorhombic structure of BP (a=3.31 Å, b=4.38 Å, c=10.50 Å, α=β=γ=90°) consisting of AB stacked layers bonded by weak forces, and
c) the puckered structure of phosphorene.
Figure 3. The illustration of liquid-phase exfoliation process of BP. Ultra-sound is utilized to exfoliate bulk BP, resulting to produce the phosphorene.
1.3 Objective of this study
Herein, this study reports a fabrication of BP through mechanochemical ball mill process from RP, and synthesis of phosphorene via liquid-phase exfoliation for application to ER fluid. Using these techniques, BP and phosphorene were simply produced by controlling milling and exfoliation time at atmospheric pressure and room temperature. The phase transition effect induced by ball mill on ER performance of BP was investigated by XRD patterns, Raman spectroscopy and measurement of electrical conductivity. The exfoliation effect generated by sonication on ER performance of phosphorene was characterized using AFM, Raman spectroscopy and four-point probe resistivity measurements. The results exhibit that ER performance is determined by the degree of phase transition and exfoliation, morphology and electrical conductivity. To best of knowledge, this is the first demonstration of utilizing BP and phosphorene to show ER performance.
Chapter 2. Experimental
2.1 Materials
RP (extra-pure reagents) was obtained from Yakuri Pure Chemicals Co.
LTD., Japan. 1-Methyl-2-pyrrolidone (99.5%, NMP) and ethanol (99.5%) were purchased from Samchun Chemical. Co., Korea. Silicone oil (Aldrich, poly(methylphenylsiloxane), viscosity = 100 cSt) was utilized as a dispersing medium for ER fluid applications.
2.2 Preparation of bulk BP
RP (3 g) powder was employed as a precursor of bulk BP and was placed in a wet planetary ball-mill jar (zirconia grinding bowl) with three sizes of balls (diameters: 1, 2, and 5 mm). RP and zirconia balls were put into the grinding bowl with a ball to powder ratio of 46.25: 1. Afterwards, the bowl was fixed in the planetary ball mill and agitated at 550 rpm under ambient pressure and temperature with a change of ball-mill duration from 6 to 36 h.
After ball mill, the product was collected by centrifugation, washed repeatedly with ethanol, and dried in a vacuum oven for 24 h.
2.3 Preparation of phosphorene
Phosphorene was prepared from ball–milled bulk BP according to sonochemistry method, called liquid phase exfoliation in organic solvent owing to simple, scalable and low–cost approaches. Typically, each ball- milled BP (0.4 g) depending on milling time was added to 200 mL of NMP and treated with sonication for 2 h to 6 h. Subsequently, the supernatant liquid was separated and the solvent of the acquired product was changed into ethanol for facile collection of powders. Afterwards, final product, phosphorene, was isolated with centrifugation and obtained after drying in a vacuum oven at room temperature.
2.4 Characterization
As-prepared bulk BP and phosphorene characterization: Transmission electron microscope (TEM) images were obtained with a JEM-2100 (JEOL, Japan). All samples were diluted in ethanol and deposited on a copper grid.
Morphological images and thickness of all samples were acquired using an atomic force microscope (AFM) (InnovaSPM, Vecco, USA); silicon tips were used in tapping mode at a resonance frequency of 320 kHz. X-ray diffraction (XRD) patterns was measured by Smartlab (Rigaku, Japan). A Horiba
Scientific T64000 Raman spectrometer installed at the National Center for Interuniversity Research Facilities (NCIRF) at Seoul National University was utilized for analyzing as-prepared bulk BP and phosphorene structures (λ=532 nm). X-ray photoelectron spectra (XPS) were acquired by using Sigma probe (ThermoVG). The electrical conductivity was measured with the four-probe system using a Loresta-GP/MCP-T610 (Mitsubishi).
Investigation of electrorheological properties: As-prepared bulk BP and phosphorene were dispersed in silicone oil (poly(methylphenylsiloxane), viscosity = 100 cSt) for ER measurement. Concentration of bulk BP and phosphorene-based ER fluid was 1 wt%. Any additives were not added to the fluids. The ER properties of bulk BP and phosphorene-based ER fluid was investigated utilizing rheometer (AR 2000 Advanced Rheometer, TA Instrument) with a concentric cylinder conical geometry (cup radius: 15 mm), and a high-voltage generator (Trek 677B). The gap distance kept 1.00 mm.
The direct current (DC) voltage was applied to as-prepared ER fluid after loading a sample in the rheometer. All measurement were conducted at room temperature.
Chapter 3. Results and discussion
3.1 Synthesis of BP and phosphorene
Figure 4 illustrates the fabrication procedure for bulk BP and phosphorene nanosheets. For the first step, RP powder was employed as a precursor of BP. BP was prepared by inducing phase transition from RP through mechanochemical ball mill process, and was produced utilizing a high-energy mechanical ball milling technique at ambient temperature and pressure [59]. It has been reported that the ball mill process induces the phase transition due to high-energy impact and high temperature, resulting in structural deformation [60–63]. Thus, the process causes rearrangement of phosphorus atoms, leading to phase transition from amorphous RP to β- metallic BP. Following ball mill, RP powder with red color was changed to black, indicating the phase transition from RP to BP was successfully occurred.
For producing phosphorene from as-synthesized BP, ultra-sonication was used to induce the exfoliation of BP by utilizing ultrasound energy in forming acoustic cavitation in liquids such as water or organic solvents, called liquid- phase exfoliation [64,65].
In the liquid-phase exfoliation process through sonication, NMP was
added to as-synthesized BP as solvent. Hersam et al. analyzed phosphorene in acetone, chloroform, hexane, propan-2-ol (IPA), dimethylformamide (DMF) and NMP [64]. NMP has a relatively high boiling point and surface tension (~40 mJ/m2), indicating that NMP is the effective solvent for exfoliation of BP [66,67]. Afterwards, as-prepared BP and phosphorene were dispersed in silicone oil (1 wt%) for application of stimuli-responsive nanomaterials for electrorheological (ER) fluid.
Figure 4. A schematic illustration of synthesis of bulk BP by ball milling RP and phosphorene through liquid
phase exfoliation using ultra-sonication.
3.2 Characterization of BP and phosphorene
3.2.1 Morphology of BP and phosphorene
The successful fabrication of as-prepared BP and phosphorene was observed by transmission electron microscopy (TEM) in Figure 5. Figure 5a shows TEM image of RP whose lateral size was about 1.2 μm. Figure 5b-d displays TEM images of BP synthesized via ball mill for 24 h and phosphorene exfoliated for 2 h, 6 h, respectively. In contrast to RP, 24 h-milled BP was fabricated with diameter of ca. 650 nm, suggesting that ball mill process diminished the lateral size of RP. It is known that the lateral sizes of 2D materials such as graphene, MoS2 obtained via ball mill decrease due to their fracture by the large impact forces perpendicular to the layer direction [68].
The average lateral sizes of phosphorene exfoliated for 2 h, 6 h were ca. 350 nm and ca. 150 nm, which indicates the ultrasonic exfoliation process affects BP to reduce its size along the plane direction for BP sheets. The lateral sizes of as-synthesized BP as a function of milling and exfoliation times were displayed (Table 1). The difference of lateral sizes with milling time was not remarkable, unlike graphene whose size was effectively controlled by ball- mill process [69]. It was considered the difference of Moh’s scale hardness.
While the value of graphite is in the range of 0.5–1, that of RP is greater than
3.5, too strong to be cracked into smaller pieces even with longer milling.
Hence, the lateral sizes of BP sheets are not significantly transformed in terms of the duration of ball mill. Figure 6a shows the lattice fringes of as-prepared BP fabricated by ball mill using high-resolution TEM (HR-TEM). The d- spacing of as-prepared BP is 0.21 nm, which is determined by (002) plane of BP according to ICDD-PDF: No. 76-1963 [70]. In addition, orthorhombic crystallinity of BP was confirmed by the selected area electron diffraction (SAED) pattern as shown in the Figure 6b. SAED pattern indicates the corresponding HR-TEM image.
The thickness of RP, as- synthesized 24 h-milled BP and phosphorene was determined by atomic force microscopy (AFM) (Figure 7). Figure 7a-b exhibit that the ball mill decreased the lateral size and thickness of RP. Figure 7b-d show that the thickness of as-synthesized BP reduced depending on the exfoliation time. While the thickness of 24 h-milled BP was above 60 nm, the thickness of phosphorene reduced to ca. 26 nm, after ultra-sonication for 2 h.
The further exfoliation diminished the thickness of phosphorene to 3.3–5.9 nm.
Moreover, it was found that the lateral sizes of BP sheets reduced to ca. 240 nm and 155 nm after exfoliation for 2 h and 6 h, respectively. AFM images also represents the morphology of RP, as-synthesized 24 h-milled BP and phosphorene. It was observed that the longer exfoliation decreased the aspect ratio of phosphorene from 1.32 to 1.03 when BP was exfoliated for 2 h and 6
h, respectively. Furthermore, morphology of phosphorene was concurrently changed from sheet to spherical during exfoliation. The change of thickness and morphology of BP and phosphorene corresponds to TEM images (Figure 5). This indicates the ball mill and ultra-sonication affects reduction of thickness and morphology of phosphorene.
0 h (RP) 6 h-milling 12 h-milling 18 h-milling 24 h-milling 36 h-milling
0 h> 1000600–1250350–1340500–850500–720480–700
2 h-exfoliation - 600–850320–1090500–790240–350300–420 6 h-exfoliation - 400–980280–1030510–660155–250170–200
Table 1. The lateral size of BP depending on the milling and exfoliation time (unit: nm)
Figure 5. TEM images of RP, BP and phosphorene as a function of exfoliation time. a) RP, b) BP milled for 24 h, and c-d) phosphorene exfoliated for 2 h and 6 h, respectively.
Figure 6. a) The HR-TEM image of as-prepared BP by ball mill showing lattice fringes. The d-spacing of BP is 0.21 nm attributed to (002) plane of BP according to ICDD-PDF: No. 76-1963. B) SAED pattern of as-prepared BP in accordance with the HR-TEM image.
Figure 7. AFM images and height profiles of a) RP, b) BP milled for 24 h, and phosphorene exfoliated for c) 2 h and d) 6 h, respectively. RP, BP and phosphorene solution were deposited on a silicon wafer for AFM
measurement.
3.2.2 Crystalline structure of BP and phosphorene
X-ray diffraction (XRD) is conducted to determine the phase transition of BP and phosphorene from RP. Figure 8 shows the XRD spectra or as- synthesized BP with the high intensity peaks at 16.2°, 34.8° and 50.0°, attributed to (020), (040) and (006) for phosphorene in accordance with JCPDS card no.73-1358 [71,72]. Compared to phosphorene, three major peaks of RP were observed at 15.5°, 33.3° and 56.1° [65,73,74]. This indicates that the ball mill process induced phase transition from RP to BP. However, there were region of RP peaks in as-synthesized BP owing to partial phase transition during milling process.
In addition, Raman spectroscopy is utilized to identify the crystalline orientation of BP [65,75]. Figure 10 exhibits the measured Raman spectra of RP and BP as function of time. In the spectra, three characteristic peaks of RP at 350, 389, and 460 cm–1 were attributed to 𝐵𝐵1 fundamental mode, 𝐴𝐴1 symmetric stretching mode and 𝐸𝐸1 degenerate mode [76]. The spectra of all the BP sheets depending on milling time show reduced intensities of the fundamental and stretching vibrations of RP and simultaneous generation of three significant peaks of BP in all conditions after milling. Three prominent peaks were observed at 359.6, 435.5 and 462.5 cm–1 in all as-synthesized BP sheets. These dominant peaks correspond to out-of-plane mode (𝐴𝐴𝑔𝑔1) and two
in-plane modes (𝐵𝐵2𝑔𝑔,𝐴𝐴𝑔𝑔2) of BP, respectively [65,76,77] as shown in Figure 9.
The 𝐴𝐴𝑔𝑔2 and 𝐵𝐵2𝑔𝑔 phonon modes correspond to armchair and zigzag directions, respectively [4]. The appearance of significant three peaks signifies that the orthorhombic structure of BP was successfully fabricated [65,78,79]
This is an obvious proof of the converting from RP to BP via mechanochemical ball mill process. However, an incomplete phase transition exists in all as-synthesized BP and phosphorene, which can be demonstrated by the presence of the shoulder in all 𝐴𝐴𝑔𝑔1 mode. Three prominent phonon modes were also obtained in Raman spectra of phosphorene along with as- synthesized BP (Figure 11). These results suggest that the orthorhombic crystalline structure of BP was maintained during exfoliated process via ultra- sonication.
While these three characteristic peaks of BP milled for various milling time were detected at the same positions, all the spectra display the difference of intensities (Figure 10). To compare the degree of phase transition depending on milling time, the spectra of all as-synthesized BP sheets were normalized against the intensity of 𝐴𝐴𝑔𝑔1 peaks which overlapped the fundamental mode of RP. This indicates that the 𝐵𝐵2𝑔𝑔 and 𝐴𝐴𝑔𝑔2 peaks are separated from RP. In addition, the intensity difference of the 𝐴𝐴𝑔𝑔2 peak before and after milling is particularly larger than the 𝐵𝐵2𝑔𝑔. This means that the 𝐴𝐴𝑔𝑔2
peak can be the indicator of degree of phase transition. The 24 h-milled BP
represents the highest intensity of 𝐴𝐴𝑔𝑔2 and its intensity decreased after 36 h- milling. Similarly, the shoulder peak (350 cm–1) of 𝐴𝐴𝑔𝑔1 largely decreased when RP was milled for 24 h than other as-synthesized BP sheets. According to these results, it can be concluded that 24 h-milled BP showed the highest degree of phase transition.
In addition, the exfoliation effect to the degree of phase transition was observed in Figure 11. As 24 h-milled BP was proved to be the optimum as discussed earlier, the following exfoliation step proceeded with as-prepared 24 h-milled BP. To identify the exfoliation effect to the phase transition by ultra-sonication, the 24 h-milled BP and phosphorene were compared based on the normalized intensity of 𝐴𝐴𝑔𝑔1 peak. It was represented that the shoulder peaks originated from fundamental and symmetric stretching mode in RP decreased after exfoliation. Furthermore, the exfoliation process induced an increment of the intensity of 𝐴𝐴𝑔𝑔2 peaks with decreasing number of layers. The intensity of 𝐴𝐴𝑔𝑔2 peak for phosphorene exfoliated for 6 h was higher than that exfoliated for 2 h. It is confirmed that the longer sonication led to the reduction of thickness in agreement with the AFM height profiles. Consequently, the results proved that the exfoliation using ultra-sonication affects the degree of phase transition from RP to BP.
Figure 8. X-ray diffraction patterns of the RP, BP and phosphorene. RP exhibited two significant peaks at 15.5° and 34.8° in accordance with (013) and (31-8) (JCPDS No. 44-0906) [73,74]. As-synthesized BP and phosphorene show three characteristic peaks at 16.2°, 34.8° and 50.0° in agreement with (002), (004) and (006), corresponding to orthorhombic structure of BP [65].
Figure 9. A schematic of the vibration mode of BP atoms in the different phonon mode [77].
Figure 10. Raman spectra of RP and BP milled as a function of milling time from 6 h to 36 h. The out-of-plane mode is 𝐴𝐴𝑔𝑔1 and in-plane modes are 𝐵𝐵2𝑔𝑔
and 𝐴𝐴𝑔𝑔2, respectively.
Figure 11. Raman spectra of 24 h-milled BP and phosphorene in terms of exfoliation time.
3.3 Electrical conductivity of BP and phosphorene
In general, it is known that RP possess poor electrical conductivity (~10-
14 S cm-1) [80]. However, BP, semiconductor for 2D materials, has the higher electrical conductivity compared with RP, suggesting that the electrical conductivity is the indicator of phase transition [81,82]. The effect of duration of ball mill on the electrical conductivity was identified by using four-point probe resistivity measurements. Figure 12 describes the electrical conductivity of BP and phosphorene as a function of milling and exfoliation time. The electrical conductivity of BP milled for 6 h was observed with 5.50×10⁻⁶ S cm–1 and that of milled for 12 h was 3.86×10⁻⁶ S cm–1. The electrical conductivity of two cases was larger than 10–6 S cm–1. The longer milling of RP shows the dramatic increment of electrical conductivity for BPs, higher than tenfold when milled for 18 h or more. The electrical conductivity was 6.90×10⁻⁵ S cm–1 and 1.04×10⁻⁴ S cm–1 when RP was milled for 18 h and 24 h, respectively. On the other hand, further milling reduced its conductivity by 2.10×10⁻⁵ S cm–1 due to the damage of its structure [83,84]. The 24 h- milled BP exhibits the highest electrical conductivity which is in a good agreement with the smallest shoulder peak near 𝐴𝐴𝑔𝑔1 and the highest intensity of 𝐴𝐴𝑔𝑔2 according to Raman spectrum. This indicates that the arrangement of P atoms of RP has changed most to the orthorhombic structure of BP.
Likewise, the electrical conductivity of BP is influenced by exfoliation through ultra-sonication, and the improvement of its electrical conductivity was identified for phosphorene. The electrical conductivity phosphorene exfoliated for 2 h was 1.00×10⁻³ Scm¬1, tenfold compared to 24 h-milled BP.
The maximum conductivity of phosphorene (2.16×10⁻³ S cm–1) was obtained after exfoliation for 6 h since the ultrasonic cavitation led to the increment of intensity of 𝐴𝐴𝑔𝑔2 peak, according to Raman spectrum. This suggests that exfoliation process induced the further arrangement of RP atoms to BP. Hence, exfoliation process via ultra-sonication clearly represents the proof of the further phase transition and following enhancement of the electrical conductivity of BP.
Figure 12. The electrical conductivity of BP and phosphorene in terms of milling and exfoliation time. The left side and right side show the electrical conductivity of BP and phosphorene as a function of milling and exfoliation time, respectively. The 24 h-milled BP was used to fabricate phosphorene owing to the highest degree of phase transition from RP to BP.
3.4 Electro-responsive properties
3.4.1 Flow curves of the fluid
To obtain insight into the electro-responsive behaviors of BP- and phosphorene-based ER fluids as a function of milling time, electrorheological properties were measured under shear stress and electric field strength. The weight fraction of ER fluids dispersed in silicone oil is generally higher than 3 wt% [85–87]. In comparison, only 1 wt% of BP and phosphorene was dispersed in silicone oil, indicating the ball-milled BP and phosphorene exfoliated via liquid-phase exfoliation are more effective ER fluids than conventional fluids.
Figure 13 exhibits the shear stress and shear viscosity flow curves in terms of the shear rate for BP-based ER fluids depending on the milling time at a weight fraction of 1 wt% under 0.5 kV mm–1 of electric field strength.
Notably, as-prepared 24 h-milled-based ER fluid displayed the significantly improved shear stress. The yield stress of as-prepared 6 h-milled and 12-h milled BP was 0.42 and 0.36 Pa, respectively. There was an increment of the yield stress when BP was milled for 18 h or longer. The yield stress of as- prepared 18 h milled fluid was 0.62 Pa. After 24 h milling, the yield stress of
the fluid showed 2.82 Pa. However, the yield stress of as-prepared 36 h milled- fluid decreased to 0.46 Pa. This tendency of yield stress is in accordance with that of the electrical conductivity. According to the electrical conductivity as a function of milling time, the electrical conductivity represented that the highest electrical conductivity after 24 h milling and the longer milling than 24 h led to a decrease of conductivity. Additionally, the electrical conductivity may affect the relaxation time which is the one of the factor of ER performance.
The shorter relaxation time of ER fluids results to the improved ER performance because relaxation frequency of the fluid is proportional to the rate of polarization [11]. Furthermore, it has been reported that the higher conductivity can induce the faster polarization response, resulting to enhancement of shear stress [12].
The relaxation time, denoted as the interfacial polarization response of ER fluids, affects the dielectric properties and ER activity [19–21]. The relaxation time (𝜏𝜏𝑡𝑡) is given by [12,88]:
𝜏𝜏𝑡𝑡 = 2𝜋𝜋𝑓𝑓1
𝑚𝑚𝑚𝑚𝑚𝑚 (1)
where 𝑓𝑓𝑚𝑚𝑚𝑚𝑚𝑚 is the maximum peak of the dielectric loss factor. The relaxation time of 24 h milled-BP sheets was #, which is faster than others. Thus, 24 h- milled BP-based ER fluid exhibits the faster polarization and possesses
stronger sheet polarizability. These results indicates that 24 h-milled BP was the optimum condition in shear stress and shear viscosity flow curves.
Figure 14a exhibits the flow curves as a function of the shear rate for the 24 h-milled BP fluid under 0.01 kV mm-1. The weight fraction of previous studies of the ER fluids utilized the dispersants with their concentration higher than 5 wt% in medium. And, they showed the ER behavior above 1 kV mm-1. In comparison to them, the 24h-milled BP fluid displays ER behavior at a low concentration of dispersant (1 wt%) and small electric field (0.01 kV mm-1 ) compared to the conventional ER fluids. This indicates that BP-based ER fluids possesses the lower power consumption.
Figure 14 b represents the electro-responsive properties under various electric field strength. Without an electric field, the shear stress of the ER fluid shows a typical Newtonian fluid behavior where the shear stress linearly increases in proportional to the shear rate [89]. Under electric field, 24 h- milled BP-based ER fluid exhibits shear stress curve. In the low shear rate region, the ER fluid shows typical Bingham plastic behavior owing to the formation of chain-like structures induced electrostatic interactions between nanosheets [90,91] Bingham plastic behavior is described by the following equation;
𝜏𝜏 =𝜏𝜏0+𝜂𝜂0𝛾𝛾̇ for 𝜏𝜏 ≥ 𝜏𝜏0 (2)
𝛾𝛾̇ = 0 for 𝜏𝜏 <𝜏𝜏0 (3)
where τ denotes shear stress, 𝜏𝜏0 is the yield stress, 𝛾𝛾̇ is the shear rate, and 𝜂𝜂0 is viscosity [92]. In this behavior, the plateau region is observed. The occurrence of the plateau region is attributed to the balance between electrostatic interactions caused by interfacial polarization of sheets and hydrodynamic forces from shear flow [7,92]. However, the balance between two forces begins to destroy at the critical shear rate. In the high shear rate, the deformation rate increases faster than the reformation rate with increasing the shear rate; the hydrodynamic forces are dominant than electrostatic forces.
This is due to the insufficient time to recover as the shear rate increases [7].
Consequently, this phenomenon leads to collapse the chain-like structure and it shows the Newtonian fluid behavior.
The correlation between shear stress and applied electric field strength was also investigated under fixed shear rate. The shear stress increases in proportion to the electric filed strength. When applied electric field strength increases, the more rigid, highly linked chain-like structures form due to the stronger electrostatic interactions between BP sheets.
Figure 13. Shear stress and viscosity as a function of milling time for 1 wt%
BP in silicone oil under 0.5 kV mm–1.
Figure 14. Shear stress and viscosity for 1 wt% BP in silicone oil under a) 0.01 kV mm–1 and b) various electric strength fields (0–0.5 kV mm–1).
3.4.2 The effect of morphology on ER activity
To examine the effect of morphology on ER performance, as-prepared 24 h milled BP was utilized due to the highest intensity of 𝐴𝐴𝑔𝑔2 peak and the lowest shoulder peak of 𝐴𝐴𝑔𝑔1. The yield stress of phosphorene exfoliated for 2 h-based ER fluid is observed at 5.8 Pa, higher than the yield stress of phosphorene exfoliated for 6 h-based ER fluid (0.8 Pa). This is owing to the effect of morphology of the phosphorene nanosheets. In terms of the phosphorene-based ER fluid behavior, a sheet-like morphology enhances the ER activity compared to a spherical shape due to the higher stress applied unit sheet area [23]. The morphology effect of the ER fluids affects the flow resistance and the mechanical stability [4]. The flow resistance between phosphorene nanosheets and insulating medium increases with increasing the aspect ratio of the fluids, indicating that the flow resistance of sheet is higher than spherical form. The relation between flow resistance and aspect ratio can be determined according to the dynamic drag force (𝐹𝐹𝑑𝑑):
𝐹𝐹𝑑𝑑 = 12𝜌𝜌𝐶𝐶𝑑𝑑𝐴𝐴𝑣𝑣2 (4)
where ρ denotes the density of the fluid and A is the cross-sectional area and v is the relative velocity, and Cd is the drag coefficient, which depends on the morphology. Hence, the sheet-type with higher drag coefficient induces the stronger steric hindrance to the shear force, leading to a larger stress [4].
Furthermore, it is known that the ER fluids with a high respect ratio can link together more easily under electric field, generating the more rigid chain-like structure due to the increased shear stress [95]. Accordingly, the morphology change by exfoliation process depending on time contributes to the ER performance.
Figure 15. Shear stress and shear viscosity of 24 h-milled BP, phosphorene exfoliated for 2 h and 6 h-based ER fluids (1 wt% in silicone oil under 0.5 kV/mm of electric field).
Chapter 4. Conclusion
This study provides the facile method to fabricate the BP through mechanochemical ball mill process and phosphorene via liquid-phase exfoliation with ultra-sound. The ball mill procedure was utilized for phase transition from RP to BP as a function of milling duration at ambient condition, and ultra-sonication was employed to exfoliate as-synthesized BP in solvent by controlling exfoliation time. These method revealed the simple, massive and environmentally stable productions. In addition, as-synthesized BP and phosphorene applied the ER performance as the ER fluid on the improved shear stress and viscosity. 24 h-milled BP exhibited the outstanding shear stress (2.82 Pa) than other samples since 24 h-milled BP possessed the highest the degree of phase transition and electrical conductivity (1.04×10⁻⁴ S cm–1).
Phosphorene exhibited the higher shear stress than BP (5.8 Pa). Exfoliation procedure increased the degree of phase transition from RP to BP and the electrical conductivity to 10-3 S cm–1. Furthermore, exfoliation process induced the morphology changes, which led to 0an increase in electrical conductivity. This suggests that BP and phosphorene can offer the advanced methodology for the state-of-the-art ER activity and enhance its ER performance by controlling the degree of phase transition, morphology, and electrical conductivity.
References
[1] T. C. Halsey, Science 1992, 258, 761-766.
[2] C.-M. Yoon, K. Lee, J. Noh, S. Lee, J. Jang, J. Mater. Chem. C 2016, 4, 1713-1719.
[3] Y. Li, Y. Guan, Y. Liu, J. Yin, X. Zhao, Nanotechnology 2016, 27, 195702.
[4] J. Noh, C. M. Yoon, J. Jang, J Colloid Interface Sci 2016, 470, 237-244.
[5] C. M. Yoon, Y. Jang, J. Noh, J. Kim, K. Lee, J. Jang, ACS Appl Mater Interfaces 2017, 9, 36358-36367.
[6] J. Y. Hong, M. Choi, C. Kim, J. Jang, J Colloid Interface Sci 2010, 347, 177-182.
[7] S. Lee, C.-M. Yoon, J.-Y. Hong, J. Jang, J. Mater. Chem. C 2014, 2.
[8] S. Kim, C. Kim, J.-Y. Hong, S. H. Hwang, J. Jang, RSC Advances 2014, 4.
[9] Y. P. Seo, Y. Seo, Langmuir 2012, 28, 3077-3084.
[10] J. L. Seungae Lee, Sun Hye Hwang, Juyoung Yun, and Jyongsik Jang, ACS Nano 2015, 9, 4939-4949.
[11] P. Chen, Q. Cheng, L.-M. Wang, Y. D. Liu, H. J. Choi, J. Ind. Eng. Chem.
2019, 69, 106-115.
[12] J. Yin, Y. Shui, R. Chang, X. Zhao, Carbon 2012, 50, 5247-5255.
[13] W. L. Zhang, H. J. Choi, Langmuir 2012, 28, 7055-7062.
[14] W. L. Zhang, Y. D. Liu, H. J. Choi, J. Mater. Chem. 2011, 21.
[15] E. C. McIntyre, H. Yang, P. F. Green, ACS Appl Mater Interfaces 2012, 4, 2148-2153.
[16] H. J. C. a. M. S. Jhon, Soft Matter 2009, 5, 1562-1567.
[17] T. Plachy, M. Mrlik, Z. Kozakova, P. Suly, M. Sedlacik, V. Pavlinek, I.
Kuritka, ACS Appl Mater Interfaces 2015, 7, 3725-3731.
[18] Y. Dong, Y. Liu, J. Yin, X. Zhao, J. Mater. Chem. C 2014, 2, 10386-10394.
[19] J. B. Y. a. X. P. Zhao, Chem. Mater. 2004, 16, 321-328.
[20] A. Lengálová, V. r. Pavlı�nek, P. Sáha, J. Stejskal, T. Kitano, O. Quadrat, Physica A Stat. Mech. Appl. 2003, 321, 411-424.
[21] M. Stěnička, V. Pavlínek, P. Sáha, N. V. Blinova, J. Stejskal, O. Quadrat,
Colloid Polym. Sci. 2008, 286, 1403-1409.
[22] S. Lee, J. Y. Hong, J. Jang, J Colloid Interface Sci 2013, 398, 33-38.
[23] K. Y. Shin, S. Lee, S. Hong, J. Jang, ACS Appl Mater Interfaces 2014, 6, 5531-5537.
[24] D. J. K. S. Novoselov, F. Schedin, T. J. Booth, V. V. Khotkevich, S. V.
Morozov, and A. K. Geim, Proc. Natl. Acad. Sci. U.S.A. 2005, 102, 10451-10453.
[25] A. A. G. a. M. C. Hersam, Nano Lett. 2009, 9, 4031-4036.
[26] A. P. Nayak, S. Bhattacharyya, J. Zhu, J. Liu, X. Wu, T. Pandey, C. Jin, A.
K. Singh, D. Akinwande, J. F. Lin, Nat Commun 2014, 5, 3731.
[27] K. F. Mak, C. Lee, J. Hone, J. Shan, T. F. Heinz, Phys Rev Lett 2010, 105, 136805.
[28] V. K. S. Deep Jariwala, Lincoln J. Lauhon, Tobin J. Marks, and Mark C.
Hersam, ACS Nano 2014, 8, 1102-1120.
[29] J. Kang, J. W. Seo, D. Alducin, A. Ponce, M. J. Yacaman, M. C. Hersam, Nat Commun 2014, 5, 5478.
[30] V. K. S. In Soo Kim, Deep Jariwala, Joshua D. Wood, Spencer Park, Kan- Sheng Chen, Fengyuan Shi, Francisco Ruiz-Zepeda, , Arturo Ponce, V.
P. D. Miguel Jose-Yacaman, Tobin J. Marks, Mark C. Hersam, and Lincoln J. Lauhon, ACS Nano 2014, 8, 10551-10558.
[31] D. Hanlon, C. Backes, E. Doherty, C. S. Cucinotta, N. C. Berner, C. Boland, K. Lee, A. Harvey, P. Lynch, Z. Gholamvand, S. Zhang, K. Wang, G.
Moynihan, A. Pokle, Q. M. Ramasse, N. McEvoy, W. J. Blau, J. Wang, G.
Abellan, F. Hauke, A. Hirsch, S. Sanvito, D. D. O'Regan, G. S. Duesberg, V. Nicolosi, J. N. Coleman, Nat Commun 2015, 6, 8563.
[32] E. A. Lewis, J. R. Brent, B. Derby, S. J. Haigh, D. J. Lewis, Chem Commun (Camb) 2017, 53, 1445-1458.
[33] P. D. Matthews, W. Hirunpinyopas, E. A. Lewis, J. R. Brent, P. D.
McNaughter, N. Zeng, A. G. Thomas, P. O'Brien, B. Derby, M. A. Bissett, S. J. Haigh, R. A. W. Dryfe, D. J. Lewis, Chem Commun (Camb) 2018, 54, 3831-3834.
[34] S. Lin, Y. Chui, Y. Li, S. P. Lau, FlatChem 2017, 2, 15-37.
[35] L. Li, Y. Yu, G. J. Ye, Q. Ge, X. Ou, H. Wu, D. Feng, X. H. Chen, Y. Zhang, Nat Nanotechnol 2014, 9, 372-377.
[36] S. H. Aldave, M. N. Yogeesh, W. Zhu, J. Kim, S. S. Sonde, A. P. Nayak, D. Akinwande, 2D Materials 2016, 3.
[37] S. Cui, H. Pu, S. A. Wells, Z. Wen, S. Mao, J. Chang, M. C. Hersam, J.
Chen, Nat Commun 2015, 6, 8632.
[38] N. M. Latiff, W. Z. Teo, Z. Sofer, A. C. Fisher, M. Pumera, Chemistry 2015, 21, 13991-13995.
[39] M. Buscema, D. J. Groenendijk, S. I. Blanter, G. A. Steele, H. S. van der Zant, A. Castellanos-Gomez, Nano Lett 2014, 14, 3347-3352.
[40] V. Kumar, J. R. Brent, M. Shorie, H. Kaur, G. Chadha, A. G. Thomas, E.
A. Lewis, A. P. Rooney, L. Nguyen, X. L. Zhong, M. G. Burke, S. J. Haigh, A. Walton, P. D. McNaughter, A. A. Tedstone, N. Savjani, C. A. Muryn, P. O'Brien, A. K. Ganguli, D. J. Lewis, P. Sabherwal, ACS Appl Mater Interfaces 2016, 8, 22860-22868.
[41] W. Li, Y. Yang, G. Zhang, Y. W. Zhang, Nano Lett 2015, 15, 1691-1697.
[42] J. Sun, H. W. Lee, M. Pasta, H. Yuan, G. Zheng, Y. Sun, Y. Li, Y. Cui, Nat Nanotechnol 2015, 10, 980-985.
[43] P. W. Bridgman, J. Am. Chem. Soc. 1914, 36, I344-I363.
[44] G. Tiouitchi, M. A. Ali, A. Benyoussef, M. Hamedoun, A. Lachgar, M.
Benaissa, A. Kara, A. Ennaoui, A. Mahmoud, F. Boschini, H. Oughaddou, A. El Kenz, O. Mounkachi, Mater. Lett. 2019, 236, 56-59.
[45] P. S. Stefan Lange, and Tom Nilges, Inorg. Chem. 2007, 46, 4028-4035.
[46] J. D. W. Joohoon Kang, Spencer A. Wells, Jae-Hyeok Lee, Xiaolong Liu, Kan-Sheng Chen, and, M. C. Hersam, ACS Nano 2015, 9, 3596-3604.
[47] K. S. Novoselov, A. K. Geim, S. V. Morozov, D. Jiang, M. I. Katsnelson, I.
V. Grigorieva, S. V. Dubonos, A. A. Firsov, Nature 2005, 438, 197-200.
[48] H. Zhang, ACS Nano 2015, 9, 9451-9469.
[49] H. L. Zongyou Yin, Hong Li, Lin Jiang, Yumeng Shi, Yinghui Sun, Gang Lu, Qing Zhang, Xiaodong Chen, and Hua Zhang, ACS Nano 2012, 6,
74-80.
[50] Y. Zhao, X. Luo, H. Li, J. Zhang, P. T. Araujo, C. K. Gan, J. Wu, H. Zhang, S. Y. Quek, M. S. Dresselhaus, Q. Xiong, Nano Lett 2013, 13, 1007- 1015.
[51] R. V. Gorbachev, I. Riaz, R. R. Nair, R. Jalil, L. Britnell, B. D. Belle, E. W.
Hill, K. S. Novoselov, K. Watanabe, T. Taniguchi, A. K. Geim, P. Blake, Small 2011, 7, 465-468.
[52] J. R. Brent, N. Savjani, E. A. Lewis, S. J. Haigh, D. J. Lewis, P. O'Brien, Chem Commun (Camb) 2014, 50, 13338-13341.
[53] M. C. Valeria Nicolosi, Mercouri G. Kanatzidis, Michael S. Strano,, J. N.
Coleman, Science 2011, 340, 1226419.
[54] J. N. Coleman, M. Lotya, A. O'Neill, S. D. Bergin, P. J. King, U. Khan, K.
Young, A. Gaucher, S. De, R. J. Smith, I. V. Shvets, S. K. Arora, G. Stanton, H. Y. Kim, K. Lee, G. T. Kim, G. S. Duesberg, T. Hallam, J. J. Boland, J. J.
Wang, J. F. Donegan, J. C. Grunlan, G. Moriarty, A. Shmeliov, R. J.
Nicholls, J. M. Perkins, E. M. Grieveson, K. Theuwissen, D. W. McComb, P. D. Nellist, V. Nicolosi, Science 2011, 331, 568-571.
[55] Y. Hernandez, V. Nicolosi, M. Lotya, F. M. Blighe, Z. Sun, S. De, I. T.
McGovern, B. Holland, M. Byrne, Y. K. Gun'Ko, J. J. Boland, P. Niraj, G.
Duesberg, S. Krishnamurthy, R. Goodhue, J. Hutchison, V. Scardaci, A.
C. Ferrari, J. N. Coleman, Nat Nanotechnol 2008, 3, 563-568.
[56] J. Y. Xu, L. F. Gao, C. X. Hu, Z. Y. Zhu, M. Zhao, Q. Wang, H. L. Zhang, Chem Commun (Camb) 2016, 52, 8107-8110.
[57] P. Yasaei, B. Kumar, T. Foroozan, C. Wang, M. Asadi, D. Tuschel, J. E.
Indacochea, R. F. Klie, A. Salehi-Khojin, Adv Mater 2015, 27, 1887-1892.
[58] Y. Huang, J. Qiao, K. He, S. Bliznakov, E. Sutter, X. Chen, D. Luo, F. Meng, D. Su, J. Decker, W. Ji, R. S. Ruoff, P. Sutter, Chemistry of Materials 2016, 28, 8330-8339.
[59] D. T. Phan, I. Park, A. R. Park, C. M. Park, K. J. Jeon, Sci Rep 2017, 7, 10561.
[60] M. Bodaghi, A. R. Mirhabibi, H. Zolfonun, M. Tahriri, M. Karimi, Phase
Transitions 2008, 81, 571-580.
[61] S. R. Chauruka, A. Hassanpour, R. Brydson, K. J. Roberts, M. Ghadiri, H.
Stitt, Chemical Engineering Science 2015, 134, 774-783.
[62] M. S. E.-E. a. K. Aoki, J. Less-Common Met. 1991, 169, 235-244.
[63] D. Becker, R. Haberkorn, G. Kickelbick, Inorganics 2018, 6.
[64] K. S. SUSLICK, Science 1990, 247, 1439-1445.
[65] Y. Xu, Z. Shi, X. Shi, K. Zhang, H. Zhang, Nanoscale 2019, 11, 14491- 14527.
[66] M. L. Graeme Cunningham, Clotilde S. Cucinotta, Stefano Sanvito, Shane D. Bergin, Robert Menzel, Milo S. P. Shaffer, and Jonathan N.
Coleman, ACS Nano 2012, 6, 3468-3480.
[67] S. D. Bergin, V. Nicolosi, P. V. Streich, S. Giordani, Z. Sun, A. H. Windle, P. Ryan, N. P. P. Niraj, Z.-T. T. Wang, L. Carpenter, W. J. Blau, J. J. Boland, J. P. Hamilton, J. N. Coleman, Advanced Materials 2008, 20, 1876-1881.
[68] X. Cai, Y. Luo, B. Liu, H. M. Cheng, Chem Soc Rev 2018, 47, 6224-6266.
[69] C. Xu, S. De, A. M. Balu, M. Ojeda, R. Luque, Chem Commun (Camb) 2015, 51, 6698-6713.
[70] A. Castellanos-Gomez, L. Vicarelli, E. Prada, J. O. Island, K. L.
Narasimha-Acharya, S. I. Blanter, D. J. Groenendijk, M. Buscema, G. A.
Steele, J. V. Alvarez, H. W. Zandbergen, J. J. Palacios, H. S. J. van der Zant, 2D Materials 2014, 1.
[71] H. Wang, S. Jiang, W. Shao, X. Zhang, S. Chen, X. Sun, Q. Zhang, Y.
Luo, Y. Xie, J Am Chem Soc 2018, 140, 3474-3480.
[72] H. Wang, X. Yang, W. Shao, S. Chen, J. Xie, X. Zhang, J. Wang, Y. Xie, J Am Chem Soc 2015, 137, 11376-11382.
[73] Y. Wang, L. Tian, Z. Yao, F. Li, S. Li, S. Ye, Electrochimica Acta 2015, 163, 71-76.
[74] W. Li, Z. Yang, Y. Jiang, Z. Yu, L. Gu, Y. Yu, Carbon 2014, 78, 455-462.
[75] S. Wu, K. S. Hui, K. N. Hui, Adv Sci (Weinh) 2018, 5, 1700491.
[76] E. N. Rissi, E. Soignard, K. A. McKiernan, C. J. Benmore, J. L. Yarger, Solid State Communications 2012, 152, 390-394.
[77] H. B. Ribeiro, M. A. Pimenta, C. J. S. de Matos, Journal of Raman Spectroscopy 2018, 49, 76-90.
[78] S. Lin, Y. Li, W. Lu, Y. S. Chui, L. Rogée, Q. Bao, S. P. Lau, 2D Materials 2017, 4.
[79] A. S. Pawbake, M. B. Erande, S. R. Jadkar, D. J. Late, RSC Advances 2016, 6, 76551-76555.
[80] Y. Wang, X. Yang, C. Zhao, Y. Li, H. Mi, P. Zhang, Chem Commun (Camb) 2019, 55, 4659-4662.
[81] A. Subasinghe, R. Das, D. Bhattacharyya, International Journal of Smart and Nano Materials 2016, 7, 202-220.
[82] Y. Y. Illarionov, M. Waltl, G. Rzepa, T. Knobloch, J. S. Kim, D. Akinwande, T. Grasser, npj 2D Materials and Applications 2017, 1.
[83] R. E. Rojas-Hernandez, F. Rubio-Marcos, E. Enríquez, M. A. De La Rubia, J. F. Fernandez, RSC Advances 2015, 5, 42559-42567.
[84] Z. Y. Liu, S. J. Xu, B. L. Xiao, P. Xue, W. G. Wang, Z. Y. Ma, Composites Part A: Applied Science and Manufacturing 2012, 43, 2161-2168.
[85] W. W. Yabing Qi, J. Phys. D: Appl. Phys. 2002, 35, 2231-2235.
[86] K. He, Q. Wen, C. Wang, B. Wang, S. Yu, C. Hao, K. Chen, Soft Matter 2017, 13, 7677-7688.
[87] S. Kumar, P. Thareja, Colloids and Surfaces A: Physicochemical and Engineering Aspects 2016, 511, 339-350.
[88] J. Wang, G. Chen, J. Yin, C. Luo, X. Zhao, Smart Materials and Structures 2017, 26.
[89] Y. M. h. K. P. S. Parmar, Børge Schjelderupsen, J. O. Fossum, Langmuir 2008, 24, 1814-1822.
[90] D. Kittipoomwong, D. J. Klingenberg, Y. M. Shkel, J. F. Morris, J. C. Ulicny, Journal of Rheology 2008, 52, 225-241.
[91] C. McIntyre, H. Yang, P. F. Green, ACS Appl Mater Interfaces 2013, 5, 8925-8931.
[92] M. S. Cho, H. J. Choi, M. S. Jhon, Polymer 2005, 46, 11484-11488.
국문초록
지능형 소재는 빛, pH, 전기, 자기장, 온도, 기계적 응력과 같은 외부 자극에 의해 반응하여 구조와 특성을 변화시키는 물질로써 다양한 분야에서 많은 관심을 받아왔다. 지능형 소재 중, 전기장에 의해 반응하는 지능형 소재는 빠른 응답속도, 간단한 유체 역학, 가역적 거동 그리고 낮은 작동 전력으로 인해 응용 가능성이 높은 소재이다. 그러므로, 이를 실제로 응용하기 위해서는 가격이 저렴 하면서 적은 양으로도 전기 유변학적 거동을 보이는 물질이 필수 적이다. 따라서, 이 논문에서는 상대적으로 유전율이 높은 흑린 (BP)과 흑린을 박리하여 형성된 포스포린 (phosphorene) 나노 시트를 제조하여 이를 전기 유변학적 유체에 적용하였다.
상온·상압 조건에서 적린 (RP)에 볼밀 공정을 이용하여 흑린을 제조하였고, 초음파를 이용한 액체 상 박리를 통해 흑린의 2차원 물질인 포스포린을 제조하였다. 제조된 흑린과 포스포린 나노 시트 는 전기 유변학적 유체에 적용되었으며, 볼밀 시간과 박리 시간 조 절을 통해 상전이 정도, 형태학적 및 전기전도도 변화를 유도하여 전기유변학적 성능을 향상시켰다. 특히 적린을 24 시간 밀링을 진 행하였을 때, 적린에서 흑린으로 상전이가 가장 많이 유도되어 가 장 높은 전단 응력을 보였다. 또한, 24 시간 밀링하여 제조한 흑린
에 2 시간 박리를 진행하였을 때 제조된 포스포린은 높은 종횡비 와 전도도를 보여 전기장에서 가장 좋은 전기 유변학적 성능을 보 였다. 이 논문은 최초로 상대적으로 유전율이 높은 흑린과 포스포 린의 간단하면서 저렴한 제조 과정을 제시하고, 이 물질들의 전기 유변학적 유체의 실질적인 응용 가능성을 시사한다.
주요어 : 지능형 유체, 흑린, 상전이, 볼밀, 박리, 전기전도도, 전기유변 유체


![Figure 9. A schematic of the vibration mode of BP atoms in the different phonon mode [77]](https://thumb-ap.123doks.com/thumbv2/123dokinfo/11709997.0/40.773.114.645.133.409/figure-schematic-vibration-mode-atoms-different-phonon-mode.webp)