정상압력 유동 하에서 전기유변유체의 동적 응답
남윤주† · 박명관*
Dynamic Responses of Electrorheological Fluid in Steady Pressure Flow
Yun-Joo Nam and Myeong-Kwan Park
Key Words : Dynamic Response(동적 응답), Electrorheological Fluid(전기유변유체), Flow Visualization(유동 가시화), Pressure Flow(압력 유동)
Abstract
Dynamic responses of electrorheological (ER) fluids in steady pressure flow to stepwise electric field excitations are investigated experimentally. The transient periods under various applied electric fields and flow velocities were determined from the pressure behavior of the ER fluid in the flow channel with two parallel-plate electrodes. The pressure response times were exponentially decreased with the increase of the flow velocity, but increased with the increase of the applied electric field strength. In order to investigate the cluster structure formation of the ER particles, it was verified using the flow visualization technique that the transient response of ER fluids in the flow mode is assigned to the densification process in the competition of the electric field-induced particle attractive interaction forces and the hydrodynamic forces, unlike that in the shear mode determined by the aggregation process.
1. Introduction
Due to the controllability of the apparent viscosity, the ER fluids have been tried to apply in the development of a wide range of industrial applications such as clutches, flow valves, and shock absorbers.(1) Knowledge of the behaviors and characteristics of ER fluids during the phase transition are significantly important for the effective control and design of devices based on ER fluid technology. Therefore, it has attracted lots of researches in recent years.
Previous studies have shown that the rheological responses of ER fluids relate closely to their structure responses. Therefore, the response time has been investigated from the responses of either the shear stress or the microstructure of the fluids. The stress response time has been usually studied using the rheometer.(2-4) In these studies, the response time was found to be related to shear rate, particle volume fraction, and applied
electric field strength. The evolution of the chain structure toward reaching a certain level of yield strain under an external electric field was considered to cause the shear stress to reach its stable value. However, with these methods, it is rather difficult to directly verify the complex structure evolution of the fluids in the sheared state and to investigate the relationship between the stress and microstructure responses. For further systematic investigations, the dynamic process of forming cluster structures and the resultant shear stresses have been examined theoretically.(5-7) The flow visualizations using various optical techniques have been also conducted to study the electric field-induced structure formation of ER particles.(8-10) In these studies, the effects of various electric fields and shear rates on the cluster structure behavior of the ER fluids in two electrodes were investigated, and it was verified that the response time of ER fluids is determined in the interrelation between the electric field-induced particle attractive interactions and the hydrodynamic forces.
Although the response times of ER fluids to applied electric fields have been found to be in the millisecond range by many researchers, most of the experimental and theoretical results have shown that the response time is
† 회원, 부산대학교 대학원 지능기계공학과 E-mail : [email protected]
TEL : (051)510-3054 FAX : (051)514-0685 * 부산대학교 기계공학부 및 기계기술연구소
not determined only by the properties of ER fluid itself, but also affected by the operating conditions. Above all, the composition of ER fluid is the important factor affecting its dynamic response. The material and concentration of particles determines the polarization mechanism and the distance between the particles, respectively. The particle size and the viscosity of the insulating solvent affect the viscous drag force applied to the particles. The working mode of the ER fluid (shear mode, flow mode, and squeeze mode), the form of the applied electric field (dc field, unipolar or bipolar ac field, and stepwise field) as well as test temperature are also important operating conditions. The dynamic responses of the ER fluids are simultaneously influenced by these factors. However, most of the previous studies have adopted shear mode in experiments and constant electric fields in simulations. Therefore, under various operating conditions, it is necessary to clarify how the ER effects are related to the chain or column structure of ER particles and what are the main factors determining the dynamic response of the ER fluids. Especially, the flow mode (Poiseuille flow) of ER fluids is no less important than the shear mode (Couette flow), due to its applicability to various industrial devices such as flow valves, clamps, and dampers. The pressure response of ER fluids in the flow mode is of significant importance for effective design and control of such devices.
Consequently, the main purpose of this work is to investigate the dynamic response of ER fluids in steady pressure flow to stepwise electric field excitations.
2. Experimental Setup
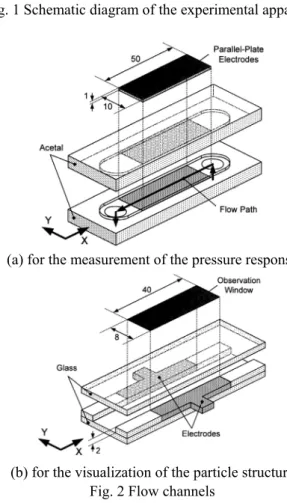
Fig. 1 depicts the schematic diagram of the experimental apparatus. According to the experimental purpose for which is the investigation on the pressure response of the ER fluid or the visualization of the cluster structure formation of ER particles, two different flow channels were used selectively. Fig. 2(a) shows a schematic configuration of the flow channel used for the investigation of the rheological properties under steady pressure flow. The test section is a rectangular channel with two parallel-plate electrodes at its top and bottom.
The flow channel except of the two electrodes is made of acetal resin. The electrodes made of brass are connected to the high voltage power supplier. Fig. 2(b) shows a schematic configuration of the flow channel used for the visualization of the structural behavior of ER particles under steady pressure flow. The flow channel is made of transparent glass except two parallel-plate electrodes in order to visualize inside the flow channel. The two electrodes are installed at both sides of the test section.
Also, two types of the ER fluids were prepared considering the two experimental purposes. The ER fluid
Fig. 1 Schematic diagram of the experimental apparatus
(a) for the measurement of the pressure response
(b) for the visualization of the particle structure Fig. 2 Flow channels
used in the investigation of the pressure response is TX- ER8 (Nippon Shokubai Co., Japan) composed of sulfonated polymer particles dispersed in a mixture of fluorine oil and silicon oil. The ER sample has a viscosity of 115mPa·s and a density of 1.6g/cm3 at room temperature (25℃). The ER fluid used in the flow visualization was composed of negative ion exchange resin particles and silicon oil, which was developed in the laboratory itself. (9) The particles density is 1.08g/cm3, and the average diameter of particles is about 450 µm.
The commercially available silicone oil has a viscosity of 96mPa·s and a density of 0.96g/cm3 at room temperature (25℃). This ER fluid has a particle weight concentration of 19.85% and a volume fraction of 15%. The ER fluid
Fig. 3 Temporal pressure curve
was supplied from the cylinder to the flow channel and then returned to the tank by using the linear motion system consisting of a servomotor, a ball screw-nut assembly, and a cylinder. By controlling the velocity of the piston in the cylinder, the flow rate could be varied in the required range and sustained at a certain value. If the piston moves from left to right at a constant velocity, then the ER fluid flows from right to left through the gap between the electrodes at the corresponding flow velocity, as can be seen in Fig. 1.
The test process can be separated into three sections: no electric field applied, stepwise electric filed applied, and electric field removed. During the three sections, the flow rate was kept at certain value. In the investigation of the pressure response, the pressures at the inlet and outlet of the two parallel-plate electrodes were measured using two pressure transducers. The displacement of the piston, the pressures, and the external electric voltage applied to the ER fluid were simultaneously recorded using a PC- based data acquisition system at the sampling speed of 1kHz. The dynamic responses of the ER fluid were obtained from the time-varying pressure behaviors as a function of the flow velocity and the applied electric field strength. In the flow visualization, the cluster structure formation of the ER particles between the electrodes was recorded using a digital video camera at the sampling speed of 40Hz, and the results were analyzed using a personal computer. All experiments were done at room temperature (25℃)
3. Experimental Results
As can be seen in Fig. 3, the temporal behavior of the pressure drop was composed of a rising, a flattened, and a decaying part, respectively corresponding to the solidification, solidified, and recovery process of the ER fluid. Previous researchers have used the following relation to investigate the rising stress response of an ER
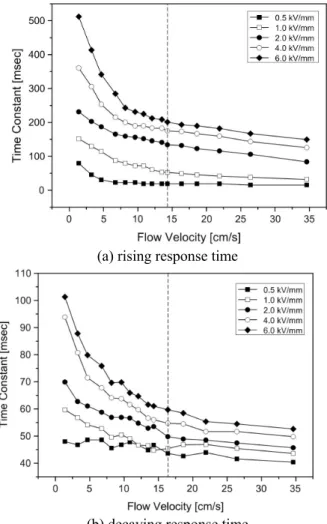
(a) rising response time
(b) decaying response time Fig. 4 Rising and decaying time constants fluid in steady shear to the electric field.(3, 7)
( ) j{1 exp[ ( j) / ]}j
j
t t t
σ =
∑
σ − − − τ (1)where tj is the time that the j-mode response begins.
t is the time elapsed from the beginning of the test, σ j is the saturated stress of the j mode, and τ is the j time constant of the j mode. Since the pressure drop is related closely to the shear stress, the rising behavior of the pressure drop can also be expressed by
( ) {1 exp[ ( ) / ]}
r sat i r
P t P t t t
∆ = ∆ − − − (2)
where ∆Psat is the pressure drop saturated under steady electric field condition, ti is the time at which the pressure drop begins to increase, and tr is the characteristic time constant of the rising response. As can be seen in Fig. 3, only one mode was needed to express the rising process of the pressure response in the tested ranges of electric field and flow velocity, which agrees well with the previous simulation and experimental results shown that the shear stress under steady shear rate can be described by only one mode.(2, 4, 6, 9) Therefore, the time constant tr was defined as the time required for
the pressure drop of the ER fluid to reach 63.2% of its saturated value after the field-on. Similarly, the time constant td was defined as the time required for the pressure drop to decline to 36.8% of its saturated value after the field-off.
Fig. 4 shows the rising and decaying time constants of the ER fluid obtained by fitting the experiment data using Eq. (2). The flow velocity and the electric field strength were changed within the ranges of 1.5-35cm/s and 0.5-6.0kV/mm, respectively. As can be seen in Fig. 4, the characteristic time constants for the rise and decay of the pressure drop were found to be decreased with the increase of the flow velocity, but to be increased with the increase of the applied electric field strength.
Furthermore, the decreasing rates of the rise and decay response times were decreased with the increase of the flow velocity or the decrease of the electric field strength.
In addition, it was found from all test results that the decaying time is much shorter than the rising time.
Numerous experimental and theoretical researches have been carried out on the transient process of ER fluids in sheared state. In these researches, the relationship between the field-induced interaction force and the hydrodynamic force were taken on account of the transient process, and the relations of the transient times with respect to shear rate, electric field strength, and particulate volume fraction were presented. The inverse relationship between the transient time and shear rate was similar to that between the pressure response time and flow velocity, although the experiments in this investigation were carried out in the flow mode. The difference in transient time between the pressure rising and decaying was also consistent with the results of other previous researches conducted in the shear mode.(2, 3, 4) However, the effect of the electric field strength on the dynamic pressure response was rather different from the previous results that the transient time of ER fluids in shear is unchanged or slightly decreased with the increase of electric field strength.
Therefore, in order to investigate the dependence of the pressure response of ER fluids on the flow velocity and electric field strength and to clarify the difference of the cluster structure formation mechanisms between in the shear and flow modes, the transient behavior of the particle structure between the two parallel-plate electrodes should be examined. For the purpose, the flow visualization technique is introduced in the present investigation.
4. Visualization Results
The pressure response of the ER fluid can be explained by investigating the sequential transition
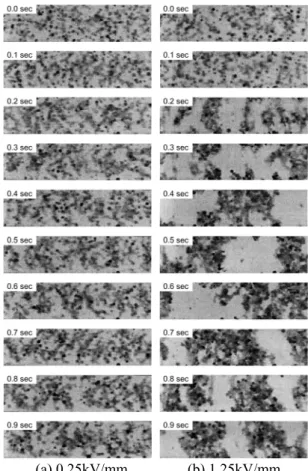
(a) 0.25kV/mm (b) 1.25kV/mm Fig. 5 Cluster formation of the ER particles at low flow
velocity
process of the particle structure subjected to the field- induced interaction forces and the hydrodynamic forces.
For effective analysis of the flow visualization results, three primary indices are introduced;
(i) aggregation period: the time required for random particles to initially form thin columns
(ii) steady-state cluster size: the average size of the clusters in steady state
(iii) densification period: the time required for thin columns to eventually form thicker and more stable columns
Fig. 5 shows that a series of images of the whole process of chain/column transition under two different field strengths (0.25 and 1.25kV/mm) and relatively low flow velocity (15cm/s). Compared to the higher electric field, the microstructure behavior in the lower field was characterized by longer aggregation period, smaller cluster size, and shorter densification period. While the clusters in the higher electric field were nearly stationary in the test section, the clusters in the lower field moved at the flow velocity. Especially, it is noted that the higher the electric field strength was, the faster the formation of the particle chains or columns were.
In the lower electric field, the form of the cluster was a thin chain shape. Because of the fluid flow from right to left, the chains flowed to downstream with forming the
Fig. 6 the average size of the steady-state clusters at low flow velocity
bow shape in the gap between the two electrodes. Some chains were deformed, broken, and reformed by the fluid flow. The ER effects of fluids are considered to be caused in this process. On the other hand, the much thicker particle chains were observed under the higher electric field condition. Upon applying the electric filed, the particles initially flowing to downstream formed particle chains or columns stopped across the two the electrodes. The fluid still flowed through the porous holes in the clusters. Some chains flowed with slipping on the electrodes and were continuously captured to more stable columns stopped. The particle concentration in the flow channel was more and more increased, and finally, the channel was almost filled with the particle clusters. In this case, the ER effects are considered to result from the flow resistance occurred when the viscous fluid flows through the porous media. While the shear response in the shear mode is ascribed mainly to yielding process of the particle structure, the pressure response in the flow mode seems to be caused by some different aggregation kinetic mechanism.
Fig. 6 depicts the cluster structure fully developed under different electric field strengths and steady low- flow velocity (15cm/s). The higher the electric field was, the larger the average size of the cluster was. Since some additional time was inevitably required to form larger cluster under the same flow velocity, the densification period was longer. Therefore, it is expected that the response times are increased with the increase of the electric field strength.
Fig. 7 shows a series of images of the whole process of chain/column transition under two different field strengths (0.25 and 1.25kV/mm) and higher flow velocity (150cm/s). Obviously, under the lower electric field, smaller cluster size and shorter densification period were observed. While the aggregation and densification
(a) 0.25kV/mm (b) 1.25kV/mm Fig. 7 Cluster formation of the ER particles at high flow
velocity
were individually observed in the higher electric field, the separation between the two processes in the lower field was rather difficult. Furthermore, the clusters in the lower field moved at the velocity faster than that in the higher field, but slightly slower than that in zero-field condition, from which it can be predicted that increasing the electric field strength provides an effect similar to decreasing the flow velocity.
Additionally, the effects of flow velocity on the microstructure behavior of ER fluids were investigated through the comparison of Figs 5 and 7. When the flow velocity was increased under the same electric field, the average size of the cluster and the densification period were decreased. The aggregation rate was also decreased with the increase of the flow velocity, which can be clearly verified in the higher electric field condition. The mechanical destruction of the cluster enhanced at relatively high flow velocity seems to deteriorate the aggregation of particles.
Summarily, the visualization results on the transient behavior of the microstructure can be drawn as follows;
when the applied electric field strength is decreased or the flow velocity is increased, the microstructure behaviors are demonstrated by slower aggregation rate, smaller average size of the cluster, and shorter densification period. Obviously, it is noted that although
a decreased aggregation rate leads to the decay of the structure transition of particles, fast pressure responses in both rising and decaying phases are obtained under relatively fast flow velocity and low electric field conditions. Since the densification period is related closely to the average size of the cluster, smaller size of the cluster can yield further decrease of densification period. Consequently, it is concluded that the densification process of the cluster has more effects on the structure response in flow mode, compared to the aggregation process of the particle. This results from some significant differences in the microstructure behaviors between in the shear and flow modes.
5. Conclusion
Dynamic responses of electrorheological (ER) fluids in steady pressure flow to stepwise electric field excitations were investigated experimentally. The pressure behaviors of the ER fluid under various applied electric fields and flow velocities were measured using the flow channel with the two parallel-plate electrodes.
The transient formation of the chain or column structure of the ER particles was also investigated based on the flow visualization technique. The conclusions drawn from our research are summarized as follows.
1. The pressure response of ER fluids and the structure response of ER particles in steady pressure flow are determined mainly by the densification process in the competition of the field-induced particle interaction forces and the hydrodynamic forces, unlike that in steady shear determined by the aggregation process.
2. When the flow velocity is increased under the same electric field, the densification process is promoted and the average size of the clusters in steady state is decreased. Therefore, the dynamic response time of ER fluids in steady pressure flow is exponentially decreased due to the densification period shortened with the increase of the flow velocity.
3. When the electric field strength is increased under the same flow field, the hydrodynamic effect on the transient behavior of the particle structure is relatively decreased and the average size of the clusters in steady state is increased. Therefore, the dynamic response time of ER fluids in steady pressure flow is increased due to the densification period increased with the electric field strength.
4. While the rising response time is determined in the competition of the field-induced particle interaction forces and the hydrodynamic forces, the decaying response time is determined only by the hydrodynamic force. Therefore, the decaying response time is much shorter than the rising response time.
References
(1) S. B. Choi, J. H. Bang, and S. H. Moon, 1998
“Control Characterisitcs of Automotive ABS Featuring Electro-Rheological Valves,” Trans. Kor. Soc. Mech.
Eng. (A), Vol. 22, pp. 1874-1883. (in Korean)
(2) J. M. Ginder and S. L. Ceccio, 1995, “The Effect of Electrical Transients on the Shear Stresses in Electrorheological Fluids,” J. Rheol., Vol. 39, pp.211- 234.
(3) K. Tanaka, A. Sahashi, and R. Akiyama, 1995,
“Scaling Behavior of Response Times of Electrorheological Suspensions with Cation Exchange Resin Particles,” Phys. Rev. (E), Vol. 52, pp. 3325- 3328.
(4) Y. Tian, C. Li, M. Zhang, Y. Meng, S. Wen, 2005,
“Transient Response of An Electrorheological Fluid under Square-Wave Electric Field Excitation,” J.
Colloid. Interf. Sci., Vol. 288, pp. 290-297.
(5) D. J. Klingenberg and C. F. Zukoski, 1990, “Studies on the Steady-Shear Behavior of Electrorheological Suspensions,” Langmuir, Vol. 6, pp. 15-24.
(6) J. Takimoto, K. Minagawa, and K. Koyama, 1996,
“Numerical Study of the Response Time of ER Suspensions,” Int. J. Mod. Phys. (B), Vol. 10, pp.
3037-3044.
(7) Z. Wang, Z. Lin, and H. Fang, 1998, “Dynamic Response Times of Electrorheological Fluids in Steady Shear,” J. Appl. Phys., Vol. 82, pp. 1125-1131.
(8) J. M. Ginder, 1993, “Diffuse Optical Probes of Particles Motion and Structure Formation in An Electrorheological Fluid,” Phys. Rev. (E), Vol. 47, pp.3418-3429.
(9) E. J. Rhee, M. K. Park, R. Yamane, and S. Oshima, 2003, “A Study on the Relation between Flow Characteristics and Cluster Formation of Electrorheological Fluid Using Visualization,” Exp.
Fluids, Vol. 34, pp. 316-323.
(10) T. Tsukiji and K. I. Hori, 1999, “Pressure Response of ER Fluids between Two Parallel-Plate Electrodes,”
Int. J. Mod. Phys. (B), Vol. 13, pp. 1917-1924.