저작자표시-변경금지 2.0 대한민국 이용자는 아래의 조건을 따르는 경우에 한하여 자유롭게
l 이 저작물을 복제, 배포, 전송, 전시, 공연 및 방송할 수 있습니다. l 이 저작물을 영리 목적으로 이용할 수 있습니다.
다음과 같은 조건을 따라야 합니다:
l 귀하는, 이 저작물의 재이용이나 배포의 경우, 이 저작물에 적용된 이용허락조건 을 명확하게 나타내어야 합니다.
l 저작권자로부터 별도의 허가를 받으면 이러한 조건들은 적용되지 않습니다.
저작권법에 따른 이용자의 권리는 위의 내용에 의하여 영향을 받지 않습니다. 이것은 이용허락규약(Legal Code)을 이해하기 쉽게 요약한 것입니다.
Disclaimer
저작자표시. 귀하는 원저작자를 표시하여야 합니다.
변경금지. 귀하는 이 저작물을 개작, 변형 또는 가공할 수 없습니다.
M.S. THESIS
Vanishing-Point Detection based on New Perceptual
Strength of the Line
(새로운 지각적 직선의 강도를 적용한 소실점 검출)
BY
HANGTAE KIM FEBRUARY 2014
DEPARTMENT OF ELECTRICAL ENGINEERING AND COMPUTER SCIENCE
COLLEGE OF ENGINEERING
SEOUL NATIONAL UNIVERSITY
Abstract
Vanishing-Point Detection based on New Perceptual
Strength of the Line
HANGTAE KIM DEPARTMENT OF ELECTRICAL ENGINEERING AND COMPUTER SCIENCE COLLEGE OF ENGINEERING THE GRADUATE SCHOOL SEOUL NATIONAL UNIVERSITY
Parallel lines in the real space(3D space) are converging at the point during the projection on to the 2D space by the lens of camera, by the linear perspective.
We call this point as a Vanishing-Point and this point indicates that the furthest point from the view point.
Vanishing-point appears in man-made structure because it is generated by the lines, and this position can be in or outside of
Therefore, General vanishing-point detection algorithm has to detect the point by using the only information of the image and regardless of the position of true vanishing-point
But almost of the recent research for detecting vanishing-point are targeting specific scenes such as road scene, corridor scene for Auto navigating system and 3D building structure restoration
those algorithms having a limitation as like ‘vanishing point has to be located in the image’, ‘camera parameter is needed’.
In this paper, our research team is targeting the image which is having a vanishing-point and do not use additional information, detection regardless of the position of true vanishing-point.
We are focused on line based vanishing-point detection and better measure for strength of the line. so that we suggested Pattern Matching and New Strength Measure as better measure for strength of the line.
Pattern Matching is decision method whether the edge pixel is contributing to make a line or not, New Strength Measure is perceptual compensation of the strength method based on man-made structure scene which is having a periodic line.
To justify the efficiency of the proposed method, We choose 100 images which is having a vanishing-point more than one. and We detect the vanishing-point by using several existing
algorithms and proposed algorithm.
Key words : Vanishing-Point, Linear perspective, Pattern matching, Strength of the line, man-made structure
Student number : 2012-20764
Contents
Abstract i
Contents iv
List of Figures vi
List of Table viii
Chapter 1 Introduction 1
Chapter 2 Existing Method 5
Chapter 3 Proposed Method 8
3.1 Line, Neighbor Information of the Line ··· 8
3.2 Pattern Matching ··· 11
3.3 Multi-size Pattern Matching ··· 14
3.4 Strength Measure ··· 16
Chapter 4 Experiment Results 22
Chapter 5 Conclusion 27
References 29
Abstract in Korean 31
List of Figure
Figure 1 vanishing-point ··· 4
Figure 2-1 Function of the line in polar space ··· 6
Figure 2-2 Region growing ··· 7
Figure 3-1 Type of the line ··· 9
Figure 3-2 Neighbor information of the line ··· 10
Figure 3-3 Pattern ··· 12
Figure 3-4 Pattern matching ··· 13
Figure 3-5 Patch and pattern ··· 15
Figure 3-6 Result of pattern matching ··· 15
Figure 3-7 Image sample which is including periodic lines ··· 18
Figure 3-8 Strength ordering ··· 18
Figure 3-9 Adaptation of the strength measure ··· 21
Figure 4-1 Total result ··· 24
Figure 4-2 Mean and variance of total norm distance per diagonal distance of the image ··· 25 Figure 4-3 Detection probability ··· 26
List of Table
Table 3 Strong and weak point in accordance with size of the pattern ··· 14
Chapter 1
Introduction
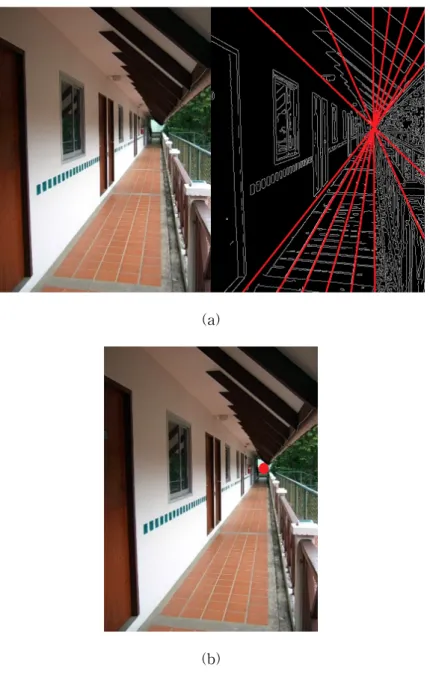
As like Figure 1, Parallel lines in the 3D-space are converging at the point during the projection on to 2D-space by the lens of the camera. and we call that point as a ‘Vanishing-point’.
Vanishing-point has several information and those informations are used in a lot of area. By the purpose of the researching area, there is existing several approaches as like following.
First approach is vanishing-point detection method with several limitations.
those method can detect faster, by the limitation. so that this approach is used in the area which is real-time detecting is needed. example of the limitations can be the vanishing-point has to exist inside of the image[1] or the detection for specific scene.
Detection for specific scene which is one of those limitation is used in Auto-Navigating area, and if the subject is robot specific scene becomes ‘corridor scene’[2], and if the subject is
vehicle specific scene becomes ‘road’.
Another approach is vanishing-point detection method with additional information such as Camera Parameter. the example of this method can be Multiple vanishing-point detection. Multiple vanishing-point is using in the area of 3D building structure restoration, actual vanishing point can exist 3 for (x,y,z)axis and each point indicates farthest point for one direction.
by using those characteristics we can find the axis of each line, and by using this information structure of the building can be guessed. Rother used mutual orthogonal direction to detect multiple vanishing-point, for the mutual orthogonal direction he used the information of camera parameter[3].
last approach is the method without any limitation[4]. one of the most biggest area of this approach is 2D-3D Conversion, and in this area vanishing-point is used as a farthest point from the view point to generate relative depth map of the image. by the characteristic of this area, vanishing-point has to be detected from monocular image without additional information and limitation of the scene. because there are lots of scenes exist such as corridor, road, indoor, outdoor, etc.
In this paper, We are targeting vanishing-point detection from monocular image without additional information, and regardless of
position of the vanishing-point, We concentrated on line based vanishing-point detection which is detecting the convergence point of the line as a vanishing-point.
In this method, better strength measure is needed because strength of the line give a critical effect on detection.
Though, we are proposing 2 main algorithm ‘Pattern Matching’,
‘Strength Measure’.
The result of this paper is organized as follows. In chapter 2, Existing vanishing-point method is introduced. In chapter 3, Proposed methods are introduced such as pattern matching, strength measure in detail, with the several examples. Chapter 4 is experimental environment and results. Finally, briefed conclusion is suggested in chapter 5.
(a)
(b)
Figure 1. Vanishing-point. (a) Image with vanishing-point, (b) lines in the image, (c) Vanishing-point.
Chapter 2
Existing Method
Hough-transform[5] is commonly used for line detection in 2D space, Hough-transform is basically using the result of binary edge detection to detect line.
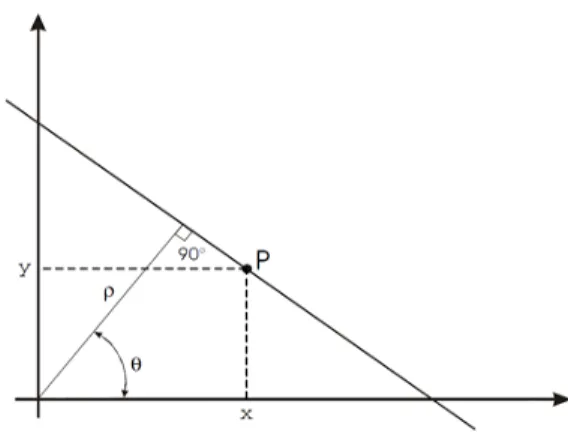
As like Figure 2-1, Hough-transform is transforming line in the (x,y)space to a point in ()space(polar space), by using this transform, function of line in (x,y)space (function 1) which is having a infinity variable is transformed to line function in polar space (function 2). therefore, we can express all possible lines in finite accumulator space. (when image size is H for height, W for width, the range of is [], range of is []).
In this transform, the value of coordinate () in accumulator space is equal to number of pixels which is staying on the line, and vanishing-point can be converging point of the line which is voted top N lines in the accumulated hough space.
Figure 2-1. Function of the line in polar space.
Function 1.
cos sin Function 2.
By using this method, Virginio suggested normalized voted value of accumulated hough space as a strength of the line [6], by using a least square method of whole detected line, he find the vanishing-point which is a optimized point of summation of the distance between line and point.
also, Han used PPHT (Progressive Probabilistic Hough Transform)[7] instead of SHT(Standard Hough Transform) which is a voted value of accumulator space is insisting longest continuous length of the line, and he used this value as a strength of the line[8]. after that, he find the crossing points and use the region growing method to cluster the crossing point as
like as Figure 2-2. and each cluster has a value which is a summation of including crossing points. lastly, find the region which is having a biggest value, and find a centroid as a valid vanishing-point.
(a) (b)
(c) (d)
Figure 2-2. Region growing. (a) Choose the biggest weight of the crossing point as a seed, (b) Growing the region starting from the seed until no more crossing point is exist near by, (c) Find another seed, (d) Growing another region starting from the seed from(c) until no more crossing point is exist near by.
Chapter 3
Proposed Method
3.1) Line, Neighbor Information of the Line
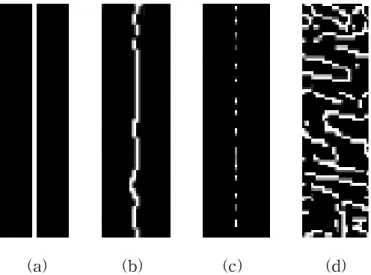
Figure 3-1 (a) is strong line. and it can be adapted to Figure 3-1 (b)too, therefore, even if this line does not fully straight line, it is strong line. Figure 3-1 (c) is dotted line but it came from real strong line with degradation as a high probability. Figure 3-1 (d) is not strong line.
But the method of hough-transform is finding the number of edge pixels which is located on straight line as a voted value in accumulator. though, this method cannot deal with Figure 3-1 (b) which is cannot having a exact shape of straight line and it can be critical problem. especially it does not work when the image has a complex texture same as Figure 3-1 (d). actually we cannot distribute Figure 3-1 (c), (d) when we use just standard hough transform. but Figure 3-1 (c) is strong line, Figure 3-1
(d) cannot be a line.
By those reasons, as like Figure 3-2 we needed to use neighbor information of the line to get correct strength of the line.
to get neighbor information of the line, we use a SHT(Standard Hough Transform) as a primary line detection and by using this, we can get neighbor information.
(a) (b) (c) (d)
Figure 3-1. Type of the line. (a) Long and continuous line, (b) Line with noise, (c) Dotted line, (d) Complex texture.
(a) (b) (c) (d)
Figure 3-2. Neighbor information of the line. (a) Detected line from the dotted line, (b) Neighbor information of detected line(a), (c) Detected line form the Complex texture, (d) Neighbor information of detected line(c).
3.2) Pattern Matching
All the edge pixels which is positioned near by the line can contribute to make a line, so that we needed to determine whether the each pixel is contributing or not.
In this paper, we are proposing ‘Pattern Matching’ as a method of determination, and the pattern is generated from which is the orientation of the line.
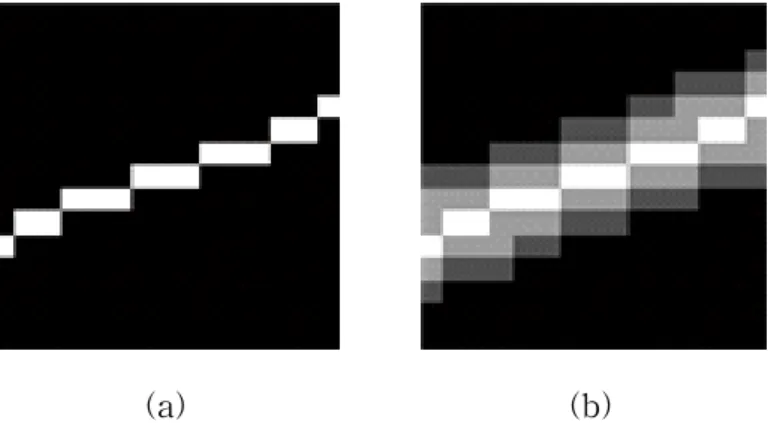
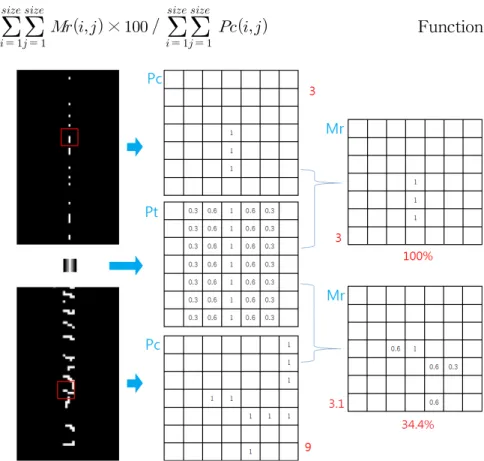
as like as the example of Figure 3-3, weight of pattern which is stayed on the line is 1, 1 norm distance pixels from the line is 0.6, 2 norm distance pixels from the line is 0.3, other pixels is 0.
When we call the Edge detection result as a Edge-map, Pattern for the pattern matching is generated from the orientation, and Patch is came from the Edge-map which is the target pixel is located on the center and same size of the pattern.
When we call pattern as Pt, patch as Pc, result of the pattern matching is Mr, we can calculate the Matching-score by using Function 3 and maintain the edge pixel if the score is bigger than threshold. or delete the edge pixel if the score is smaller than threshold. so, Pattern matching can be a kind of Denoising method.
Figure 3-4 is a example of the pattern matching when the size of pattern is 7. this example is showing how to do pattern matching, how to calculate Matching-score. as a result, if the threshold is 70%, 100% is maintained and 34.4% is deleted.
(a) (b)
Figure 3-3. Pattern. (a) Orientation of the line, (b) Pattern.
×
Function 3.Figure 3-4. Pattern-Matching (Pattern size : 7).
3.3) Multi-size Pattern Matching
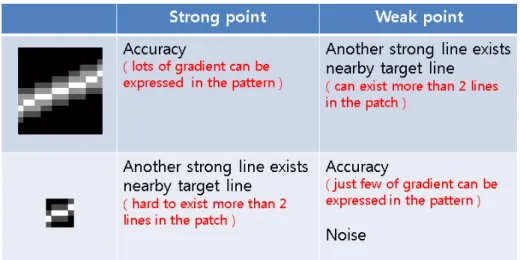
As like as Table 3, Strong and Weak point are exist in accordance with size of the pattern. Figure 3-5 (a) is an example of pattern which is having more than 2 lines.
to overcome this problem, we do the pattern matching with small size pattern, when the result of big size pattern matching is smaller than threshold.
Therefore, pattern matching is done with multi-size pattern. and the total result of pattern matching is showing as like Figure 3-6.
Table 3. Strong and weak point in accordance with size of the pattern.
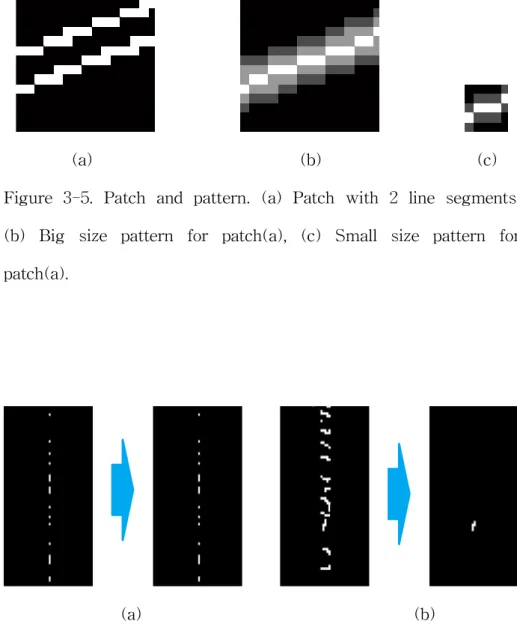
(a) (b) (c) Figure 3-5. Patch and pattern. (a) Patch with 2 line segments, (b) Big size pattern for patch(a), (c) Small size pattern for patch(a).
(a) (b)
Figure 3-6. Result of pattern matching. (a) Strong dotted line, (b) Complex texture.
3.4) Strength Measure
Vanishing-point is the convergence point of the line. and we can find lines in man-made structure. therefore, we can tell that vanishing-point appears in man-made structure scene.
When we see the man-made structure scene, we can find a lot of periodic lines such as car-lane, continued windows as like Figure 3-7.
Also, a lot of line is appearing in man-made structure. for example window and door, they have 4 lines. and 2 lines of them is passing representative vanishing-point. and others not passing.
in this time, vanishing-point is the farthest point to one direction, so that windows and doors appear periodically on the line as a high probability. and 2 lines which is passing vanishing-point is becoming line segment of periodic line.
By following those characteristic, we assumes strength order in man-made structure as like Figure 3-8.
Also, we found that even if same window appears periodically, length of each line segment is getting shorter by the linear perspective.
To overcome this changing of the length which is caused by
linear perspective, we suggest RoGL(Two lines are generating one gap. RoGL indicates a ratio of gap and mean of two line segment : Ratio of Gap and Line ).
and we can find that this value of periodic line is smaller than 1 in almost of the image. from those characteristics we suggest the Score function as like as Function 4 which is the score function for measuring the strength of the gap.
Figure 3-7. Image sample which is including periodic lines
Figure 3-8. Strength ordering
exp
Function 4.
※
= Mean of two line segments, = Length of the gap.
To adapt this strength measure, result of the pattern matching is projected on to the line, and detect line segments and gaps.
And, the result of score function is showing sharply decreasing curve when RoGL is over than 1.
Figure 3-9 is an example of adaptation, and we can see the gap which is came from the periodic line segment is compensated.
Lastly, after the procedure of pattern matching and strength measure, summation of projected pixels becomes strength of the line. and we can find that this method is following the strength order Figure 3-8.
(a)
(b)
(c)
(d)
(e)
Figure 3-9. Adaptation of the strength measure. (a) Image, (b) Edge map of image(a), (c) One of the result of pattern matching, (d) Projected line of (c), (e) Result of the strength measure.
After the whole proposed procedure, we use a region growing to find valid area, and detect the centroid point as a vanishing-point which is the method proposed by Han[8]
But, to handle extremely increased crossing-point caused by using neighbor information, condition of the region-expansion of region growing is changed from the existence of the crossing point to existence of the crossing point which is having more than mean of total crossing point.
Chapter 4
Experiment Results
In this paper, threshold for matching score is 70%, size of big pattern is 15x15, small pattern is 5x5.
To validate the efficiency of the proposed detection method, 100 images are chosen regardless of the scene, image size from the movie, drama, web-searching.
Our method is compared with 2 method. Han’s line based vanishing-point detection method which is proposed in 2006years, Peyman’s Gabor-filter based vanishing-point detection method which is proposed in 2012year[9], and to validate the efficiency of each proposed method, We detect vanishing-point by using pattern matching only, and detection by using pattern matching, strength measure together. in here, strength of the line which is detecting vanishing-point from pattern matching only is a number of the maintained edge pixel after the procedure of pattern matching.
To estimate each algorithm, we found ground truth
vanishing-point manually, and use the norm distance between detected point and ground truth over diagonal distance of the image because the image is chosen regardless of image size.
As a result of the experiment, we plot Figure 4-1, Figure 4-2, Figure 4-3.
Figure 4-1 shows total result, y-axis is norm distance per diagonal distance so that low y-axis indicates better result.
Figure 4-2 shows mean and variance of the norm distance per diagonal distance of each method. Figure 4-3 shows detection probability, y-axis is probability and x-axis is decision threshold, threshold is norm distance per diagonal distance also.
We can see detection result of proposed pattern matching is better than other method, and by adding the proposed strength measure, result shows better than pattern matching. by the result of those experiment we can confirms that each proposed method is meaningful.
Figure 4-1. Total result (y-axis : norm distance per diagonal distance of the image, x-axis : 100 images).
(a)
(b)
Figure 4-2. Mean and variance of total norm distance per diagonal distance of the image. (a) Mean of total images, (b) Variance of total images.
Figure 4-3. Detection probability (y-axis : probability, x-axis : decision threshold, threshold is norm distance per diagonal distance).
Chapter 5
Conclusion
In this paper, we proposed general vanishing-point detection algorithm which can detect regardless of the scene, image size, vanishing-point position.
Proposed method is distributed two big method, one is pattern matching which is the decision method whether the edge pixel is contributing to make a line or not. and other method is strength measure which is based on the concept of how the human feel the strength of the line in image.
After the get all the line, we follow Han’s method with little change to adapt this algorithm.
And by the result of experiment which is comparing with several existing algorithms, we confirmed that performance of proposed method is outperformed at various scene of the image.
The proposed method is general vanishing-point detection method with higher quality than others. therefore, this method can be used all the area which is using the vanishing-point. such
as car-lane detection, 2D to 3D conversion, Navigating system with better performance.
References
[1] JW. Choi, WJ. Kim, HJ. Kim, CI. Kim. “Real-Time Vanishing Point Detection using the Local Dominant Orientation Signature”
전자공학회 논문지 제 48권 SP편 제 2호. 2011.
[2] R. Ebrahimpour, R. Rasoolinezhad, Z. Hajiabolhasani, M.
Ebrahimi. “Vanishing point detection in corridors: using Hough transform and K-means clustering” IET Computer Vision. 10.
2010.
[3] C. Rother. “A new approach to vanishing point detection in architectural environments” Image and Vision Computing, vol.2,pp.
647-655. 2002.
[4] A. Andres, D. Agnes, V. Sebastien “Vanishing Point Detection without any a Priori Information” Pattern Analysis and Machine Intelligence, IEEE Transactions. Vol.25,N).4. April 2003.
[5] PV. Hough. “Methods and means to recognize complex patterns” U.S. Patent 3,069,654. 1962.
[6] V. Cantoni, L. Lombardi, M. Porta, N. Sicard. “Vanishing point detection: Representation analysis and new approaches” in Proc. of 11th International Conference on Image Analysis and Processing, pp. 90-94. 2001.
[7] J. Matas, C. Galambos, J. Kittler. “Progressive Probabilistic Hough Transform for Line Detection” Computer Vision and Pattern Recognition. 1999.
[8] JW. Han. “Relative Depth-Map Generation from Monocular Image using a Valid Vanishing Point” 한국정보과학회 가을 논문 집. vol.33, No.2. 2006.
[9] M. Peyman, JA. Starzyk, WS. Wijesoma “Fast Vanishing-Point Detection in Unstructured Environments” IEEE Transactions on Image Processing, Vol.21,NO.1, January 2012.
요약(국문초록)
소실점(Vanishing-point)은 실제 3D공간상에서의 평행한 직선들이 카메라 렌즈를 통하여 2D상으로 투영되는 과정에서 원근감에 의하 여 수렴하는 한 점으로서, 영상에서 한쪽 방향으로 가장 먼 지점을 의미한다.
이러한 소실점은 평행한 직선들에 의하여 만들어지게 되므로 인공 적 구조물이 존재하는 영상에서 나타나게 되며, 영상의 구도에 따라 그 위치가 영상 내․외부에 모두 존재할 수 있다.
하지만 현재 활발히 연구되고 있는 소실점의 검출 분야는 차량이 나 로봇의 자동항법기능에 사용되는 알고리즘이 주를 이루며, 3D건 물 구조복원 등 특수한 목적을 갖는 검출이 주를 이룬다.
이러한 알고리즘들은 카메라 파라미터 등의 사전정보가 필요하거 나, 영상 내부에 소실점이 존재한다는 제한을 두고 보다 빠르게 검 출하는 방법들이며, 해당 목적 분야 외에서는 사용하기 부적절한 알 고리즘들이 대다수이다.
본 논문에서 연구진은 소실점이 존재하는 영상을 대상으로 영상정 보 만으로부터 소실점을 검출하기 위해 영상내의 직선성분이 수렴 하는 최적의 지점을 소실점으로 추정하는 방법에 주목하였으며 이 때 직선성분의 강도가 소실점 추정에 있어서 큰 영향을 미치게 되
므로 보다 나은 직선의 검출 및 강도부여에 주목하게 되었다.
본 연구진이 새로이 제안하는 직선의 강도부여 방법은 크게 패턴 매칭과 직선의 강도부여로 나뉘며 패턴 매칭은 각각의 경계선픽셀 이 직선의 형성에 기여하는지 여부를 판단하는 방법, 직선의 강도 부여는 인공적 구조물에서 빈번히 생기는 차선이나 창문틀 난간 등 의 주기적인 직선이 갖는 강도를 보상하는 방법이다.
본 연구진이 제안하는 방법의 우수성을 증명하고자 100개의 소실 점이 존재하는 영상을 대상으로 현재 존재하는 몇몇 방법들과 그 결과를 비교하였으며, 제안하는 방법을 통한 소실점의 추정이 여타 방법들에 비하여 성능의 향상을 보임을 확인하였다.
주요어 : 소실점, 선형적 원근감, 패턴 매칭, 직선의 강도, 인공적 구 조물
학번 : 2012-20764
감사의 글
대학교를 졸업하며 학업에 더 큰 뜻을 두고 이곳 서울대학교 대 학원에 진학한 후 어느덧 2년이라는 시간이 지나 석사과정을 마무 리 짓는 시간이 되었습니다. 지금에 와서 돌이켜보니 2년이라는 길 지 않은 시간동안 연구실이라는 집단 내에서 책임감과 인덕의 중요 성, 계획적이고 능동적인 연구자세 등 얻어가는 것이 많음을 새삼 느끼게 됩니다. 또한 이 모든 것이 저 혼자만의 힘이 아닌, 많은 분 들의 도움이 있었음을 다시한번 느끼며, 이 자리를 빌어 짧게나마 감사하다는 말을 전하고 싶습니다.
먼저 많이 부족한 저를 인정해 주시고 애정어린 격려와 조언으로 올바른 연구자의 길로 이끌어주신 김태정 교수님께 깊은 감사를 드 립니다. 또한 많은 시간을 함께하며 때로는 힘이 되어주고 때로는 자극제가 되어준 정말 소중한 연구실 식구들에게 감사하다는 말을 전하고 싶습니다.
마지막으로 헤아릴 수 없이 커다란 사랑과 믿음으로 지금의 저를 있게 해주신 사랑하는 부모님 김종열, 송인옥님과, 동생 김아람에게 항상 감사하며, 사랑한다는 말을 전하고 싶습니다.