저작자표시-비영리-변경금지 2.0 대한민국 이용자는 아래의 조건을 따르는 경우에 한하여 자유롭게
l 이 저작물을 복제, 배포, 전송, 전시, 공연 및 방송할 수 있습니다. 다음과 같은 조건을 따라야 합니다:
l 귀하는, 이 저작물의 재이용이나 배포의 경우, 이 저작물에 적용된 이용허락조건 을 명확하게 나타내어야 합니다.
l 저작권자로부터 별도의 허가를 받으면 이러한 조건들은 적용되지 않습니다.
저작권법에 따른 이용자의 권리는 위의 내용에 의하여 영향을 받지 않습니다. 이것은 이용허락규약(Legal Code)을 이해하기 쉽게 요약한 것입니다.
Disclaimer
저작자표시. 귀하는 원저작자를 표시하여야 합니다.
비영리. 귀하는 이 저작물을 영리 목적으로 이용할 수 없습니다.
변경금지. 귀하는 이 저작물을 개작, 변형 또는 가공할 수 없습니다.
공학석사 학위 논문
RuO 2 -loaded TiO 2 nanotube array electrodes for efficient electrocatalytic gas evolution
이산화티타늄 나노튜브 어레이에 로딩된
이산화루테늄 전극의 전기화학적 기체발생 촉매특성
2018 년 8 월
서울대학교 대학원 재료공학부
허 성 은
RuO 2 -loaded TiO 2 nanotube array electrodes for efficient electrocatalytic gas evolution
지도교수 김 진 영
이 논문을 공학석사학위논문으로 제출함
2018 년 8 월
서울대학교 대학원
재료공학부
허 성 은
허성은의 석사학위논문을 인준함 2018 년 6 월
위 원 장 남 기 태 (인)
부 위 원 장 김 진 영 (인)
위 원 장 호 원 (인
)i
Abstract
RuO 2 -loaded TiO 2 nanotube array electrodes for efficient electrocatalytic gas evolution
Seong Eun Heo Department of Materials Science and Engineering The Graduate School Seoul National University
Ruthenium dioxide (RuO2) has an advantage of various chemical reactions like dehydrogenation, gas phase oxidation of HCl, and chloro-alkali process. In order to enhance stability of RuO2-based catalysts, the use of TiO2 is successful in recent years. In general, nanostructured scaffolds with the large relative surface area are adopted in the catalytic reactions for maximizing the number of active sites. For the electrocatalytic reactions, however, the scaffold should be conducting enough so that the charges required for the redox reaction can be transported to the surface of the loaded RuO2 catalysis. In the same context, TiO2 nanotube arrays (NTAs) can be a promising scaffold for the CER
ii
reaction, because it can transport charges (as evidenced in the solar cell or PEC applications) and it can be a good combination with RuO2 (as evidenced by DSA®). In addition, the nanoscale morphologies (e.g. tube length, pore diameter, and wall thickness), crystalline structure (e.g. crystalline phase and preferred orientation), and the electrical properties (e.g. conductivity) can be precisely controlled by the processing parameters.
In this study, we firstly report the RuO2-loaded TiO2 NTAs as an efficient nanostructure electrode for the electrocatalytic CER process. Nanostructruring is well- known for enhancing the catalysts activity, we design TiO2 based nanostructure to investigate more active catalysts. The samples have been prepared electrochemically (i.e.
electrochemical anodization for preparing TiO2 NTAs and electrochemical deposition for loading RuO2) and the dependence of the CER performance on the materials properties of the composite electrodes such as the crystallinity and electrical conductivity have been investigated. It has been found that the conductivity of the electrode under the anodic polarization is essential for achieving good CER performance, and the black TiO2
prepared by annealing as-anodized NTAs under an Ar atmosphere has been found to be the best scaffold for the RuO2 catalysis.
keywords: Chlorine Evolution Reaction(CER), TiO2 nanotube arrays (TiO2
NTAs), Ruthenium dioxide, Heterogeneous Catalysis, Electrochemical analysis.
Student Number: 2016-29604
iii
Contents
Abstract ... i
Contents ... iii
List of Tables ... vi
List of Figures ... vii
Chapter 1. Introduction ... - 1 -
1.1 Chlorine Evolution Reaction (CER) ... - 1 -
1.1.1 Chlor-alkali process ... - 1 -
1.1.2 Mechanism of chlorine evolution reaction ... - 8 -
1.1.3 Recent research trend and literature review ... - 12 -
1.2 TiO
2nanotube arrays (TiO
2NTAs)... - 22 -
1.2.1 Brief outline of TiO2 ... - 22 -
1.2.2 Self-organized TiO2 Nanotube arrays ... - 25 -
1.2.2.1 Factors affecting the morphology of TiO2 NTAs ... - 29 -
iv
1.2.3 Mechanistic regime ... - 35 -
1.2.4 Black TiO2 and modification of physical properties of TiO2 NTAs ... - 37 -
2. Experimental Details ... - 44 -
2.1. Preparation of TiO
2nanotube arrays (TiO
2NTAs) ... - 44 -
2.2. Preparation of the RuO
2-NTAs electrode ... - 45 -
2.3. Materials Characterization ... - 46 -
2.4. Electrochemical measurements ... - 47 -
3. Results and discussion ... - 55 -
3.1 Preparation of TiO
2NTAs ... - 55 -
3.1.1 voltage dependence of TiO2 NTAs ... - 55 -
3.1.2 effect of pore widening ... - 60 -
3.2 Preparation of TiO
2@RuO
2electrodes ... - 62 -
3.2.1 pulse electrodeposition and constant current electrodeposition ... - 62 -
3.2.2 effect of annealing condition ... - 71 -
v
3.3 Characterization of TiO
2@RuO
2electrodes ... - 73 -
3.3.1 Materials characterization ... - 73 -
3.3.2 Electrochemical analysis ... - 79 -
3.3.2.1 Evaluation of catalytic activity ... - 79 -
3.3.2.2 Evaluation of conductivity under different bias ... - 89 -
4. Conclusions ... - 95 -
References ... - 96 -
Abstract in Korean ... - 115 -
vi
List of Tables
Table 1. Typical chlorine evolution reaction reaction conditions. [8] ... - 7 - Table 2. Various mechanisms proposed for chlorine evolution reaction. [17] ... - 16 - Table 3. Summary of RuO2-based composite materials activity and selectivity. [8] .. - 20 -
Table 4 Summary of TiO2 resistance measurement ... - 41 - Table 5. Compilation of CER performance metrics for Ru-based catalyst synthesized under different condition. ... - 86 - Table 6. Summary of catalytic activity and stability of each TiO2 NTAs@RuO2
electrodes ... - 88 - Table 7. Electrochemical parameters of TiO2 NTAs electrode obtained by EIS.. - 94 -
vii
List of Figures
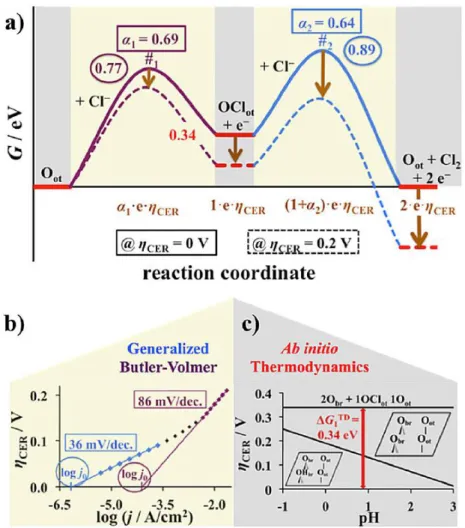
Figure 1. A schematic of the operation mechanism of the diaphragm cell. In the conventional diaphragm cell, a porous asbestos mat is used to separate the anodic reaction of CER and the cathodic reaction of HER, where NaOH is simultaneously formed in the cathodic compartment. [7] ... - 4 - Figure 2. A schematic of the operation mechanism of the mercury cell. [7] ... - 5 - Figure 3. A schematic of the operation mechanism of the membrane cell. [7] ... - 6 - Figure 4. (2×1) surface unit cell of RuO2(110). Undercoordinated ruthenium atoms of the RuO2(110) surface are denoted by Rucus and Ru2f. Adsorbates bridging two Ru2f atoms are indicated with the index “br” and adsorbates in terminal position on Rucus atoms with the index “ot” (on-top). red spheres: ruthenium 1-fold cus atoms (Rucus), blue spheres: ruthenium 2-fold cus atoms (Ru2f), green spheres: oxygen atoms. [9] ... - 10 - Figure 5. a) the free-energy profile along the reaction coordinate at different applied overpotentials. (ηCER = 0V, 0.2V, respectively) b) Experimental Tafel plot for a wide range of overpotentials, exhibiting two characteristic linear Tafel regions with Tafel slopes of 36 and 86 mV/dec. c) Ab initio thermodynamics provides the Pourbaix diagram that summarizes the stable surface configurations depending on the pH value and the applied overpotential. Under CER conditions, a fully-oxygen covered RuO2(110) surface is energetically preferred. [10] ... - 11 -
viii
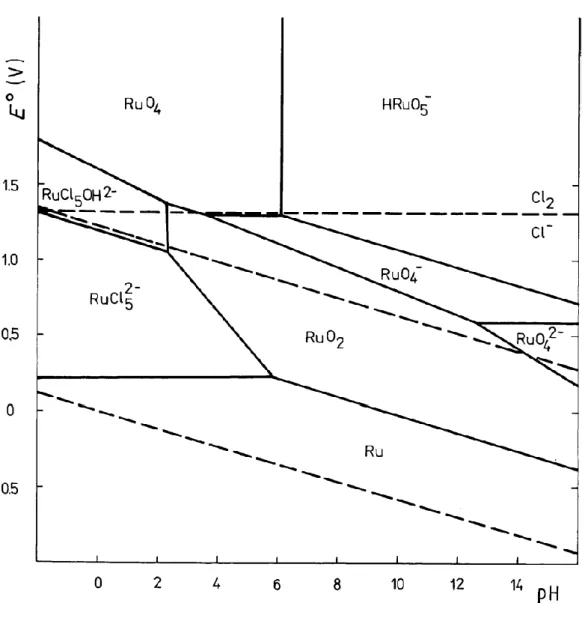
Figure 6. Various chlorine species during chlorine evolution and three main reactions in chlorine chemistry. [8] ... - 17 - Figure 7. Pourbaix diagram for ruthenium in concentrated NaCl solution (25℃ , 265g/dm3 NaCl). [23] ... - 18 - Figure 8. Corrosion of RuO2-based materials under anodic current. [24] ... - 19 - Figure 9. conceptual process scheme of the novel two step chlor-alkali process. [7] .. - 21 -
Figure 10. polyhedral representation of rutile(A) and anatase(B) and other unit cell structure (brookite: c, TiO2-B: d) [50-51] ... - 24 - Figure 11. Summary of synthesize methods for TiO2 nanomaterial. (a) general method for synthesizing nanomaterials [88] (b) AAO- assisted templated synthesize.
[89] ... - 32 - Figure 12. Three possible scenarios for electrochemical anodization schematic view of reactions that occur during the anodization. [70-71] ... - 33 - Figure 13. Factors that affect the morphology of TiO2 nanotube arrays [75, 77, 90, 78, 80, 86, 87] ... - 34 - Figure 14. Two representative model of formation of TiO2 NTAs. [70] ... - 36 - Figure 15. Electrical properties of TiO2 NTAs. [46] ... - 40 -
ix
Figure 16. Summary of various doped TiO2 and its color change characteristics. [96- 97] ... - 42 - Figure 17. Various methods to identify defect in black TiO2 NTAs. [101-102] .... - 43 - Figure 18. Schematic view of 3-electrode system used in our study. [107] This system is also applied in fabrication of anodized TiO2. ... - 51 - Figure 19. General schematic view of electrolyte and electrode interface. [108] . - 52 - Figure 20. Three typical cases of electrochemical impedance spectroscopy (a) fast diffusion rate compared to electron transfer rate, (b) similar diffusion compared to electron transfer rate, (c) slow diffusion compared to electron transfer rate. [108] .. - 53 -
Figure 21. Two typical cases of model of TiO2 nanotube arrays. [109-110] ... - 54 - Figure 22. (a) Obtained current profile characteristics and (b) typical current-time characteristics.[111] ... - 57 - Figure 23. Voltage dependence of pore diameter(inner/outer), Time dependence of tube length ... - 58 - Figure 24. Comparison of samples which is made under different voltages ... - 59 - Figure 25. Comparison of samples which is different in pore widening time. ... - 61 - Figure 26. Pourbaix diagram of Ru-H2O system. This graph indicates thermodynamically stable phases at a given voltage and pH. [114] ... - 66 -
x
Figure 27. Comparison of TiO2@RuO2 electrodes which is fabricated by constant- current method and pulse electrodeposition. ... - 67 - Figure 28. Schematic view of pulse electrodeposition and galvanostatic electrodeposition. ... - 68 - Figure 29. Potential transients during pulse electrodeposition. ... - 69 - Figure 30. Potential transients during different condition of pulse electrodeposition.
(a) no mass transfer limit (b) non steady-state (transient) mass transfer limit (c) steady-state mass transfer limit. [117] ... - 70 - Figure 31. Morphology of TiO2@RuO2 electrodes which fabricated under different heat treatment. ... - 72 - Figure 32. (a) XRD spectra of c-TiO2 NTAs, different loading of RuO2 (insets: optical image of a-TiO2, c-TiO2, b-TiO2 NTAs) (b) XPS Ru 3d spectra of c-TiO2@RuO2
50000 pulse cycles (c) XPS O 1s spectra of c-TiO2@RuO2 50000 pulse cycles. ... - 76 - Figure 33. Comparison of (a) XPS O 1s spectra of b-TiO2 and c-TiO2, (b) XPS Ti 2p spectra of b-TiO2 and c-TiO2 ... - 77 - Figure 34. SEM image of (a) a-TiO2@ RuO2 10000 pulse cycles (inset: top view of the same sample) (b) a-TiO2@ RuO2 30000 pulse cycles (c) a-TiO2@ RuO2 50000 pulse cycles (d) c-TiO2@ RuO2 50000 pulse cycles (e) c-TiO2@ RuO2 50000 pulse cycles (f) a-TiO2@ RuO2 50000 pulse cycles. TEM image of (g) c-TiO2@ RuO2 50000 pulse cycles (h) EDS mapping of selected area. ... - 78 -
xi
Figure 35. Monitoring CER activity of a) a-TiO2@RuO2 NTAs b) c-TiO2@RuO2
NTAs and HER activity of c) c-TiO2@RuO2 NTAs (insets: electrochemical surface area measurement) ... - 82 - Figure 36. stability test comparison between two samples and their optical images. - 83 -
Figure 37. Mott-Schottky plot at a fixed frequency of 1kHz on annealed TiO2 NTAs.
... - 84 - Figure 38. LSV scan of b-TiO2@RuO2 NTAs in a) 0.5M H2SO4 with scan rate 10mV/s.
b) 5M NaCl (pH=2) with scan rate 10mV/s ... - 85 - Figure 39. Comparison of CER overpotential at 10mA cm-2 with other Ru-based electrocatalyst reported in the literature. ... - 87 - Figure 40. (a) CV scan of each TiO2 substrate, Pt and graphite (electrolyte: 0.1M VOSO4 supported by 3M H2SO4) (b) CV scan of each TiO2 substrate, Pt and Ti (electrolyte: 2mM Ferrocene supported by TBAF) ... - 91 - Figure 41. Electrochemical impedance spectroscopy. (a) Nyquist plot at -0.5V (vs.
SCE) (b) Nyquist plots of the impedance data for c-TiO2 and b-TiO2 at 2V (vs. SCE) ... - 92 - Figure 42. Electronic conductivity of TiO2 NTAs obtained from EIS data under different bias (pH=2) [118] ... - 93 -
- 1 -
Chapter 1. Introduction
1.1 Chlorine Evolution Reaction (CER)
1.1.1 Chlor-alkali process
The chlor-alkali industry for producing chlorine itself as a chemical is obviously one of the largest industrial electrochemical processes featured by the annual production of more than 70 million tons.1-3 Besides the chlorine production, the CER is becoming more and more important for emerging applications based on the electrochemical advanced oxidation process such as the water purification,4 sterilization,5 and the ballast water treatment.6 Also, chlorine gas is a gas used for various chemical reactions. It uses for synthesizing polyvinyl chloride (PVC), various chlorinated polymers (eg, polyvinylidene chloride (PVDC), Polychloroprene) and the precursor for various organic synthesis and inorganic synthesis.4
The chlor-alkali process is a process of electrolyzing brine to obtain chlorine gas and sodium hydroxide (NaOH). The following reactions occur at the cathode and anode.
Anode: 2𝐶𝑙−→ 𝐶𝑙2+ 2𝑒− 𝐸0 = 1.3583V (vs. NHE)
Cathode: 2𝐻2𝑂 + 2𝑒−→ 𝐻2+ 2𝑂𝐻− 𝐸0= 0.8277V (vs NHE) However, in the mercury cell, NaHg formation reaction (2𝑁𝑎++ 2𝐻𝑔 + 2𝑒−→ 2𝑁𝑎𝐻𝑔) occurs.
- 2 - Overall: 2𝑁𝑎𝐶𝑙 + 2𝐻2𝑂 → 𝐶𝑙2+ 𝐻2+ 2𝑁𝑎𝑂𝐻
Currently commercialized processes include mercury process, diaphragm process, and membrane process. The previous two processes are older than membrane processes and have been developed in Europe and the US, respectively. The membrane process is a process developed in Japan.4 The schematic diagram for each process is as follows. (Figure 1, 2, 3)7
First, in the case of the diaphragm process, Na+ is permeable to the asbestos layer to form NaOH. However, asbestos acts as a physical barrier between the two electrodes, allowing the movement of water and ions. Therefore, Cl- ions in brine can be passed over to make NaCl, and OH-ions formed in the anode can be passed to the cathode to increase the pH, causing selectivity problems with Oxygen Evolution.
Second, in the mercury process, NaHg amalgam is formed instead of the reduction reaction of water in the reduction electrode. Because it is a membrane-free process, it can be driven at a high current density even if the voltage is the same. However, the use of mercury is decreasing due to pollution problems.
Third, there is a membrane process. The diaphragm process uses a membrane instead of asbestos, and the cation exchange resin, nafion, solves the NaCl impurity problem.
- 3 -
Chlor-alkali process is mainly carried out under the following conditions which is summarized in Table 1.8 As can be seen in the table, it is an electrochemical process and therefore takes place at much higher temperature and current density conditions.
Ruthenium-based catalysts, which are particularly stable and therefore far superior to other catalysts with stability, have been used predominantly.
- 4 -
Figure 1. A schematic of the operation mechanism of the diaphragm cell. In the conventional diaphragm cell, a porous asbestos mat is used to separate the anodic reaction of CER and the cathodic reaction of HER, where NaOH is simultaneously formed in the cathodic compartment. [7]
- 5 -
Figure 2. A schematic of the operation mechanism of the mercury cell. [7]
- 6 -
Figure 3. A schematic of the operation mechanism of the membrane cell. [7]
- 7 -
Table 1. Typical chlorine evolution reaction reaction conditions. [8]
- 8 -
1.1.2 Mechanism of chlorine evolution reaction
Chlorine evolution reaction can occur in various catalysts (RuO2, IrO2, PtO2, etc.), and the mechanism has been mainly explored in the most successful RuO2 or RuO2- TiO2 composite. So how does chlorine evolution occur on RuO2 catalysts?
In recent years, Over group has explored what is happening on the single crystal RuO2 (110) plane through various calculations and supported experimental evidence.9-10 They argue that, as reported by other groups11-12, the Tafel slope at low overvoltages and at high overvoltages are different and can be explained by first-principles calculations.
The crystal structure of RuO2 is as follows. (Figure 4)9 Among them, there are three kinds of sites that are considered as active sites of catalysts. First is the unsaturated Ru site(Rucus). As the oxidation progresses, Oxygen sticks to this, and the oxygen atoms protruding outward are called Oot. In the case of RuO2, Oot is the main active site and is a catalyst capable of generating chlorine through two steps. The two steps are as follows.
1. Volmer step 𝑂𝑜𝑡+ 2𝐶𝑙−→ 𝑂𝑜𝑡− 𝐶𝑙 + 𝑒−+ 𝐶𝑙− 2. Heyrovsky step 𝑂𝑜𝑡− 𝐶𝑙 + 𝐶𝑙−→ 𝑂𝑜𝑡+ 𝐶𝑙2+ 𝑒−
The Volmer step is the process of making a reaction intermediate called OCl with 𝐶𝑙− on the 𝑂𝑜𝑡, and the Heyrovsky step is the process of finally producing the Cl2 gas with 𝐶𝑙− attached to the reaction intermediate. If the overvoltage is small, the second step (Heyrovsky step) is the step to determine the reaction rate (rate-determining step:
RDS). However, if the overvoltage is large, the first step, the volmer step, determines the
- 9 -
reaction rate It is shown through thermodynamic calculation that it is a step. The change of the tafel slope according to the overvoltage is explained by various methods such as the amount of Cl on the surface. However, the calculation shows that the RDS changes depending on the overvoltage. (Figure 5)10
- 10 -
Figure 4. (2×1) surface unit cell of RuO2(110). Undercoordinated ruthenium atoms of the RuO2(110) surface are denoted by Rucus and Ru2f. Adsorbates bridging two Ru2f atoms are indicated with the index “br” and adsorbates in terminal position on Rucus atoms with the index “ot” (on-top). red spheres: ruthenium 1-fold cus atoms (Rucus), blue spheres: ruthenium 2-fold cus atoms (Ru2f), green spheres: oxygen atoms. [9]
- 11 -
Figure 5. a) the free-energy profile along the reaction coordinate at different applied overpotentials. (𝛈𝑪𝑬𝑹= 𝟎𝑽, 𝟎. 𝟐𝑽, respectively) b) Experimental Tafel plot for a wide range of overpotentials, exhibiting two characteristic linear Tafel regions with Tafel slopes of 36 and 86 mV/dec. c) Ab initio thermodynamics provides the Pourbaix diagram that summarizes the stable surface configurations depending on the pH value and the applied overpotential. Under CER conditions, a fully-oxygen covered RuO2(110) surface is energetically preferred. [10]
- 12 -
1.1.3 Recent research trend and literature review
Ruthenium oxide (RuO2) has been known as one of the best heterogeneous catalysis for the anodic chlorine evolution reaction (CER). In spite of the excellent catalytic properties, however, the biggest issue of the RuO2-based catalysis is the high materials cost. Therefore, the commercial CER catalysis widely used in the industry is the Dimensionally Stable Anodes (DSA®) consisting of 70-mole% rutile TiO2 and 30-mole%
RuO2, which exhibits minimal loss of performance with minimal use of RuO2. In addition, the presence of TiO2 has been known to enhance the stability under the anodic polarization during the CER process.13-14
Research Trends
In the case of CER, much research has been done on mechanisms.15-16 Various mechanisms have been proposed (Table 2)17 and recent studies have shown that thermodynamic calculations and first principles can better explain experimental results.
In addition, many studies on selectivity have been carried out since Cl2 chemistry can cause various chemical species to proceed in aqueous solution (Figure 6)8, and the problem of oxygen generation at the oxidation electrode always follows. Surprisingly, selectivity is also closely related to stability. As the selectivity to Cl2 increases, there is less current associated with OER, which leads to slower degradation of the oxide and improved stability. There are two major factors that affect selectivity.8 First, it is a process condition (pH, temperature, the current density of the electrolyte, the 𝐶𝑙−concentration
- 13 -
of the electrolyte, etc.). The second is the structure and composition of the anode. Various studies have confirmed that selectivity and efficiency are affected by what anode is, what doping is, what amount of Ru is, and so on. The results are summarized as follows.
1. The partial current of OER can be significantly lowered in the case of an electrolyte added with HCl.18-19
2. The lower the pH, the more kinetics of OER are inhibited. Therefore, it is preferable to measure in acidic conditions.20
3. The higher the 𝐶𝑙− concentration, the better the current efficiency.21 This can be explained by the increase of adsorption due to mass transfer enhancement.
4. The higher the current density, the lower the selectivity.20
5. When the pH is low in the 𝐶𝑙−-rich electrolyte, the formation of soluble chloride is closely related to degradation.22 However, if the pH is higher (base condition), there seems to be a different degradation mechanism.
6. The corrosion of DSA is minimum between pH = 2 and 3.19 This can be explained by the pourbaix diagram (Figure 7).23 Because conversion from RuO2 to RuO4 is important to explain degradation mechanism.
7. The factor related to the stability of DSA is the OER partial current. The higher the partial current of OER, the more Ru oxidation and corrosion increases.8 The degradation mechanism of RuO2 associated with OER is shown in the figure below. (Figure 8) 24 As
- 14 -
the anodic polarization is overprotected, RuO(OH)2 formed on the surface is converted into RuO42-, and the amount of Ru is gradually decreased. However, the current density of CER and stability of electrode were not related to each other.8 It is not a problem that the current density of the CER increases, but the occurrence of other side reactions such as OER is a key factor in deterioration.
8. It has been reported that as the active surface increases, local current density decreases and selectivity increases.21 The surface area was mainly controlled by the size control of RuO2 particles. In this study, the TiO2 nanotube array was used to increase the active surface.
9. It can be seen that the selectivity of OER increases as the loading amount of the catalyst increases.21
10. Other materials besides RuO2 have also been reported for CER activity. IrO225, PdO26, and CoOx27 is mainly investigated. In addition, RuO2 composite materials containing SnO228, Sb2O529-30, and TiO231 have been reported. In the case of RuO2, TiO2 was found to be advantageous in terms of cost and stability, but the pure phase was more advantageous in the case of IrO2. PdO has not been explored much, but it has proved to be more advantageous than RTO (RuO2-TiO2 mixed oxide) in terms of stability and efficiency. As CoOx has been reported as a good catalyst for OER, it has poor selectivity compared to other materials, and there is even corrosion due to decomposition of HClO (hypochlorite decomposition). Due to the high price of Ru-based materials, substitution with non-noble
- 15 -
metals such as Co has been studied extensively, but there has not yet been a successful case of Ru over Ti-mixed RTO.
11. In addition to changing materials, many attempts have been made to change the electronic sturucture through doping. In particular, there have been many attempts to improve selectivity by doping various elements such as Zn32-33, Ni34, Mg35, Fe36, Co27 and Sn36 into RuO2.
12. As a result, the RTO composition of RuO2 mixed with TiO2 has more advantages in terms of activity, selectivity, stability, and cost than other catalysts.
13.In recent years, processes using catalysts using Mn-based cheap materials have been introduced in academia, eliminating membranes.7 (Figure 9)
- 16 -
Table 2. Various mechanisms proposed for chlorine evolution reaction. [17]
- 17 -
𝐶𝑙2+ 𝐻2𝑂 ↔ 𝐻++ 𝐻𝑂𝐶𝑙 + 𝐶𝑙− 𝐻𝑂𝐶𝑙 + 𝐻2𝑂 ↔ 𝐻3𝑂++ 𝐶𝑙𝑂− 2𝐻𝑂𝐶𝑙 + 𝐶𝑙𝑂−↔ 𝐶𝑙𝑂3−+ 2𝐻++ 2𝐶𝑙−
Figure 6. Various chlorine species during chlorine evolution and three main reactions in chlorine chemistry. [8]
- 18 -
Figure 7. Pourbaix diagram for ruthenium in concentrated NaCl solution (25℃ , 265g/dm3 NaCl). [23]
- 19 -
Figure 8. Corrosion of RuO2-based materials under anodic current. [24]
- 20 -
Table 3. Summary of RuO2-based composite materials activity and selectivity. [8]
- 21 -
Figure 9. conceptual process scheme of the novel two step chlor-alkali process. [7]
- 22 -
1.2 TiO
2nanotube arrays (TiO
2NTAs)
1.2.1 Brief outline of TiO2
Titanium dioxide (TiO2) is widely investigated due to its good stability (including corrosion resistance) and physical properties and biocompatibility. Especially, it is widely used in pigment37, sunscreens38-39, paints40, ointments, and toothpaste41. In energy-related application, Fujishima and Honda first reported as the photocatalytic splitting of water under UV light.42 In chlorine evolution reaction, the presence of TiO2
has been known to enhance the stability under the anodic polarization during the CER process.13-14 In addition, TiO2 is often used as an additive in conjunction with SnO2 to enhance the selectivity of CER with respect to oxygen evolution reaction (OER).20 In fact, it has been reported that up to about 70% TiO2 increases selectivity rather than impairing the catalytic properties of RuO2. This is because TiO2 lowers the partial current due to OER which may prevent dissolution.13-14
TiO2 often has four polymorphs. tetragonal rutile, tetragonal anatase, orthorhombic brookite, and monoclinic TiO2.43 (Figure 10) In addition, polymorphs at high pressure, or less common structrue have been reported as well.44 Of these, rutile is the most thermodynamically stable phase formed at high temperatures45, while the remainder is formed at a slightly lower temperature. TiO2 nanotube arrays are amorphous in the as-dep condition46 and can be transformed to anatase or rutile when annealed.47 But for rutile, it needs to be heat treated at very high temperatures (> 800℃).47 Although it has
- 23 -
been reported that when the heat treatment is performed at a temperature of 900℃ or higher, the TiO2 nanotube array is completely changed to rutile, but the shape of the TiO2
nanotube array is not maintained.47 Not only TiO2 nanotube arrays, Mo oxide nanotube arrays have also been observed to break the shape of nanotubes during high-temperature heat treatment.48 This is because the crystal structure is changed and lattice strain is generated and thus strain is generated. In addition, rutile is the most thermodynamically stable phase in the bulk system45, but at the nanoscale, many experimental and theoretical studies support that the most stable phase is anatase.49 Therefore, in the case of TiO2
nanotube arrays, many studies related to anatase have been conducted.
- 24 -
Figure 10. polyhedral representation of rutile(A) and anatase(B) and other unit cell structure (brookite: c, TiO2-B: d) [50-51]
- 25 -
1.2.2 Self-organized TiO2 Nanotube arrays
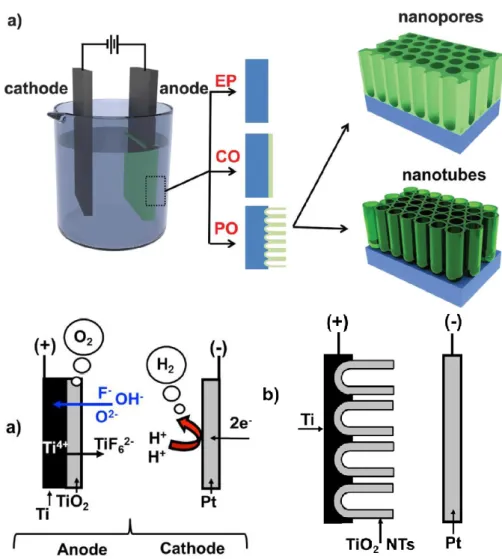
There are many ways to make TiO2 nanotubes. (Figure 11) It can be divided into solution-based approaches, vapor-based approaches, templated growth and electrochemical methods.50 Solution-Based Approaches include hydrothermal/solvothermal methods, sol-gel methods, surfactant-assisted methods, microwave assisted methods, sonochemical synthesis, high temperature pyrolysis and electrospinning methods. Solution-based approach is low cost, and simple process, but it still has a disadvantage that it is not easy to control morphology or control physical properties.50 Vapor-based approaches include chemical / physical Vapor Deposition (CVD / PVD), atomic layer deposition(ALD)-related methods, and pulsed laser deposition.
Since it grows at a high temperature in a vacuum condition, it has good crystallinity and it is a great advantage that it can precisely control composition and growth site with a catalyst or a precursor.50 However, it has a disadvantage of being expensive and having a bad scalability. Templated growth is a method of controlling morphology by using a porous template. The biggest advantage is that growth does not have a large effect on the crystal surface of the material. However, there is a disadvantage that crystallinity is not good and purity is not easy to control. Electrochemical methods can grow TiO2 nanotube arrays directly on Ti metal, and it is not difficult to control length or pore size. Many people have tried it because it is simple, low-cost, and excellent in scalability.
The origin of the electrochemical process of forming TiO2 nanotube arrays dates back to the formation of the Alumina porous layer. Anodic Aluminum Oxide (AAO) was
- 26 -
first reported by Rummel52 and Baumann53, and has attracted much interest from researchers. Especially, various anodization methods (mild anodization (MA), hard anodization (HA), pulse anodization (PA), cyclic anodization (CA)) have been studied, especially for templates or platform as energy storage54-56, photovoltaic 57-58, photonic applications59-60, biomedical applications61-62, etc.). In 1999, Zwilling and co-workers demonstrated that TiO2 nanotube arrays can be synthesized for the first time using fluorine-containing electrolytes.63 The formation of nanotube arrays in this manner has also been applied to other valve metals and alloys (Hf64, Ta57, W65, Nb66, Zr67, Fe68, Mo48, TiW69 etc).
A simple mechanism for making TiO2 nanotube arrays is as follows. (Figure 12)70
Working Electrode (Anode): 𝑀 → 𝑀𝑧++ 𝑧𝑒−
2𝐻2𝑂 → 𝑂2+ 4𝐻++ 4𝑒− (Oxygen evolution reaction: OER) 𝑀 +𝑧
2𝐻2𝑂 → 𝑀𝑂𝑧/2+ 𝑧𝐻++ 𝑧𝑒− (formation of oxide)
Counter Electrode (Cathode, Pt or carbon): 2𝐻++ 2𝑒−→ 𝐻2 (Hydrogen evolution reaction: HER)
- 27 -
Oxidation takes place at the working electrode, leading to a change from pure metal to metal oxide. At the counter electrode, reduction occurs, so hydrogen ions contained in the electrolyte are reduced and hydrogen gas is observed. Depending on various electrolyte conditions (temperature, pH, applied potential, electrolyte or organic, fluoride contents, viscosity, etc.), the kinetic of the reactions occurring on the working electrode can be controlled, It plays a key role. There are three possible scenarios for the growth of the oxide depending on the conditions of the electrolyte. (Figure 12)71
Scenario 1: If oxide is completely dissolved in the electrolyte, electropolishing of the metal layer will be observed.
Scenario 2: If oxide does not dissolve in electrolyte at all, compact oxide is formed.
Scenario 3: If the oxide partially dissolves in the electrolyte, the 𝑀𝑧+ cation can be solvated Under certain conditions the formation and dissolution of the oxide will be in a steady state to form a nanotube or porous layer.
The current of anodization can be obtained by using a high field approximation, and the ionic current density is determined by the thickness of the barrier. The growth of the oxide depends on the rate at which the 𝑀𝑧+ ions migrate outward and the 𝑂2− ions moving inward from the water to the metal. (Figure 12) In general, the growth of oxide is related to the magnitude of the electric field, and the equation is given by
- 28 - 𝐼 = 𝐴𝑒𝐵𝐸, 𝐸 =∆𝑈
𝑑
where I is the current, ∆𝑈 is the voltage across the oxide layer of thickness d, and A and B are material-dependent constants.72
If a compact oxide is formed, the electric field is greatly reduced as the thickness of the oxide layer becomes thicker, which interferes with ion migration, and the growth of the oxide is stopped at any moment. This is given by d = 2.5 nm / V * U in TiO2.73
As in Scenario 3, when the oxide partially melts, metal cations will form with F anions and solvated to form water-soluble 𝑀𝐹6− . When these chemical solvents and oxides form a steady state, a porous film is formed.
Generally, a hexagonal nanopore cell (honeycomb structure) is formed in a TiO2
nanotube array. How does the nanotube form? This is related to the chemical nature of TiF6-. First, the F-ion is smaller, so it can diffuse faster than the larger 𝑂2−ion. Because of this, an F-rich layer is formed at the metal / oxide interface and a tube shape is formed as water easily dissolves these layers. In contrast, in the case of Al, Al-fluoride is not well soluble in water, so a porous form is better formed.
- 29 -
1.2.2.1 Factors affecting the morphology of TiO2 NTAs 1. H2O-based (aqueous) vs. organic-based
In the case of H2O-based electrolytes, the chemical etching rate is faster than the organic-based ones, so the steady state is reached sooner and the length is limited. The maximum growth is reported to be about 2.5 micrometers.74 On the other hand, an organic- based electrolyte can grow up to 100 micrometers, and the pore radius can grow larger.75 In addition, organic-based electrolytes can slow the dissolution of cell boundaries because the chemical etching rate is significantly slower, which is advantageous for making highly ordered structures. The nature of the organic material also depends on whether it is based on dimethyl sulfoxide (DMSO) or on ethylene glycol (EG). Single-walled NTAs are created based on DMSO76, whereas double-walled NTAs are created based on EG.47 (Figure 13)
2. Temperature
Growth occurs more slowly because the kinetic associated with ion migration is worse at lower temperatures. In addition, if the temperature is very low, it can be observed that the nanotubes are grown not in nanotubes but in chemical etching.77 As a result of the observation of the composition, the nanocolumn is composed of an 𝐹−rich composition and is easily etched by water. (Figure 13)
- 30 - 3. Presence or absence of complexing agent
When complexing agents such as lactic acid78 or EDTA79 are used, Ti4+ ions are caught, which prevents Ti4+ ions from diffusing into the inner wall. As a result, the thickness of the bottom layer becomes thinner and the thickness of the barrier oxide becomes thinner, so that a higher electric field is required than usual. So we can observe a phenomenon that grows longer than when no complexing agent is added. In addition, dielectric breakdown is not observed at a relatively large voltage. (Figure 13)
4. Concentration and pH of 𝐹−ion
The concentration of F ion and pH are also related to the dissolution of the oxide layer. The lower the pH, the faster the dissolution rate. Also, the higher the concentration of fluoride, the faster the dissolution rate of the oxide layer.80 (Figure 13)
5. aging effect
As the anodization progresses more and more, the TiF6-complex is formed in the electrolyte, which increases the ionic concentration and increases the conductivity of the electrolyte.81 As a result, the longer the length of the TiO2 nanotubes is, the longer the anodization is repeated. In addition, the increased TiF6- concentration has the effect of slowing the rate of chemical dissolution and increasing the maximum oxide length.82 (Figure 13)
- 31 - 6.Voltage
Voltage is often known to have a proportional relationship with diameter.83 Higher voltages increase the strength of the electric field through the oxide layer and affect the migration and diameter of the ions. However, if the electric field reaches a certain threshold value, the diffusion of water becomes a rate-determining step and the voltage and potential are inversely proportional to each other. (Figure 13)
7. Time
The length of the TiO2 nanotubes can be controlled with time, and the maximum length of the TiO2 nanotubes is determined by the steady state. Sometimes it takes a long time to observe the shape of the nanograss.80 (Figure 13)
8. Presence of pre patterning
If you do pre-patterning, you can observe that the tube grows in a more well- ordered form.84 The most common method is the double anodization method, which is also derived from AAO growth. 85 In addition, pre-patterns can be created using Focused Ion Beam (FIB)86 or other nanoimprinting methods such as stamping.87 (Figure 13)
- 32 -
Figure 11. Summary of synthesize methods for TiO2 nanomaterial. (a) general method for synthesizing nanomaterials [88] (b) AAO- assisted templated synthesize.
[89]
- 33 -
Figure 12. Three possible scenarios for electrochemical anodization schematic view of reactions that occur during the anodization. [70-71]
- 34 -
Figure 13. Factors that affect the morphology of TiO2 nanotube arrays [75, 77, 90, 78, 80, 86, 87]
- 35 -
1.2.3 Mechanistic regime
There are two main mechanisms that explain the formation of TiO2 nanotube arrays. (Figure 14)70 One is the field-assisted dissolution model and the other is the flow mechanism model. The field-assisted dissolution model describes that the oxide layer is formed in both the metal / oxide interface and the oxide / electrolyte after the pore is first initiated, and the electric field is concentrated inside the pore, causing dissolution centering thereon Model. Recently, the flow mechanism model has been proposed to explain other phenomena. The pore initiation of TiO2 nanotube arrays differs slightly depending on the type of electrolyte. In the case of aqueous solution, both Ti4+ injection into the electrolyte and dissolution of the oxide layer by 𝐹− ion contribute to the electrolyte, whereas in the organic solvent, the chemical dissolution becomes very small and the pore is formed only under special circumstances. Recent studies have reported that morphological instability leading to pore initiation and self-order occurs in certain oxide formation efficiencies. In this model, plastic flow and stress associated with volume expansion are not important. However, a model has been recently proposed in which a pore is formed by perturbation between an oxide layer and an electrolyte. As a result, TiO2
nanotube arrays using organic solvents have been shown to play an important role in complex formation of pores by ejection of Ti and field-assisted dissolution of oxide layers by 𝐹−ions.
- 36 -
Figure 14. Two representative model of formation of TiO2 NTAs. [70]
- 37 -
1.2.4 Black TiO2 and modification of physical properties of TiO2 NTAs
In general, the anatase phase is known to be the largest electron mobility phase.91-
92 For this reason, applications related to the conduction of electrons such as solar cells93 and photoelectrochemical cells94 are related to anatase. However, rutile has an advantage in synthesizing single crystals because rutile is the most thermodynamically stable phase.95
In the case of TiO2 nanotube arrays, both amorphous and anatase phases have a similar band gap of 3.2 eV. Despite similar band gaps, the properties associated with photoelectrochemical reactions such as solar cells are quite different. The electrical conductivity of TiO2 differs greatly depending on the measurement method, as indicated in the previous review literature.46 Especially, there is a big difference when measured in a 2 points geometry and 4 points geometry. (Table 4) Comparing the results of 4point measurements with bulk, it can be seen that the resistance is smaller in case of nanotube.
In addition, electrical conductivity measurements using the impedance method can be explained by the high defect density of anodic TiO2 nanotubes, which is slower to transport in bulk than transport at grain boundaries. It is also observed that the dependence of temperature on TiO2 nanotubes is proportional to T-1/4, and it is predicted that electrons are transported by Mott variable range hopping conduction mechanism in TiO2 nanotubes.
This implies that the TiO2 nanotube system is a strongly disordered system with a localized charge-carrier state. (Figure 15)
- 38 -
In addition, these TiO2 nanotubes can be doped in a variety of ways, making it easy to change their conductivity. The overall research trends related to this are summarized in Figure 16.96-97 We used Ar annealing and Ar/H2 annealing, which are the easiest methods to preserve defects in the TiO2 nanotube array.
In particular, TiO2 can produce defects (Ti3+ and oxygen vacancies) when subjected to heat treatment in a reducing atmosphere or vacuum, and the color of the TiO2
varies greatly. Of these, TiO2 with black color is called black TiO2. Black TiO2 was first reported by Chen in 2011 and reported as a photocatalyst with improved optical properties.98
TiO2 NTAs also show a change in the color of TiO2 when subjected to a heat treatment in a reducing atmosphere or in a vacuum containing hydrogen, and the formula in which the defect is made is as follows.99
2𝑇𝑖𝑇𝑖𝑋+ 𝑂𝑂𝑋 → 2𝑇𝑖𝑇𝑖′+1
2𝑂2+ 𝑉𝑂′′
(Kroger-Vink Notation for crystal defects)
the symbol for the atom involved, or V if the site is vacant;
a superscript indicating the net charge:
- • for charge +1, - 𝑋 for zero net charge,
- 39 - - ′ for charge -1;
As can be seen from the equation, Ti4+ ion loses one electron to become Ti3+, and oxygen is converted into oxygen, and the remaining two electrons occupy oxygen vacancy.
In the case of hydrogen atmosphere, the following reaction formula is obtained.100 𝑂𝑂2−+ 2𝑇𝑖4++ 𝐻2→ 𝑉𝑂+ 2𝑇𝑖3++ 𝐻2𝑂
Hydrogenation is accomplished by the simultaneous formation of O vacancy and Ti3+ center.
These oxygen vacancies and Ti3+ can be confirmed by various methods. More roughly, it can be confirmed by shift of the XPS spectrum, and more directly by electron paramagnetic resonance (EPR). In addition, we confirmed that it was blue shifted through Raman and confirmed that this is Ti3 + center. In the EPR method, the oxygen vacancy is confirmed with high accuracy (g-value = 2) but the Ti3+ center is hard to ascertain accurately.101-102 In addition, we confirm that the charge carrier is increased by the Mott- schottky method or indirectly by the difference of UV-vis spectrum. (Figure 17)
- 40 - Figure 15. Electrical properties of TiO2 NTAs. [46]
- 41 -
TiO2 NTAs Polycrystalline bulk anatase
Single crystalline bulk anatase Resistivity 10-2 ohm·cm / 102~107
ohm·cm* 102~107 ohm·cm 1.5 ohm·cm
Ref 103-104 105-106 92
* 2 point measurement
Table 4 Summary of TiO2 resistance measurement
- 42 -
Figure 16. Summary of various doped TiO2 and its color change characteristics. [96- 97]
- 43 -
Figure 17. Various methods to identify defect in black TiO2 NTAs. [101-102]
- 44 -
2. Experimental Details
2.1. Preparation of TiO
2nanotube arrays (TiO
2NTAs)
TiO2 nanotube arrays were synthesized by two-step electrochemical anodization of Ti foil (thickness 0.25 mm, 99.99% trace metals basis (Aldrich)). Before anodization, Ti foils were degreased by sonication in acetone, ethanol and deionized water. The samples were anodized in electrolytes containing Ethylene glycol, 0.25wt% NH4F and 2.5vol% water.
In the first-step anodization, the Ti sheet was anodized at various voltage (30V~70V) for 2hour at room temperature, and then the as-grown TiO2 nanotube arrays were removed ultrasonically. The same samples underwent the second-step anodization for 30min. After anodization, the samples were cleaned with deionized water and dried under gentle nitrogen stream. Next, the pores of the TiO2 nanotube arrays were widened by immersing the films in formamide solution containing 0.15M NH4F and 3.5wt% water at 72℃ for 10min followed by cleaning water. b- TiO2 was obtained by annealing the samples in H2(4%)/Ar atmosphere at 450℃ for 1h with a heating rate 5℃/min. c- TiO2 was obtained by annealing in air at 450℃ for 1h with a heating rate 5℃/min.
- 45 -
2.2. Preparation of the RuO
2@NTAs electrode
Ruthenium oxide nanoparticles were deposited onto NTAs by pulsed electrodeposition (PED). RuO2 electrodeposition underwent at -1mA/cm2 in a three- electrode configuration with 50ms on time, and 1s off time using NTAs as the working electrode, Pt wire as the counter electrode, and a saturated calomel electrode (SCE) as a reference electrode. The electrolyte consists of RuCl3·xH2O (10mM) and KCl (0.5M) dissolved in deionized water. After RuO2 electrodeposition, the fabricated samples were annealed in air at 200℃ for 3h with heating rate 5℃/min.
- 46 -
2.3. Materials Characterization
The morphology of the film was characterized by Field Emission Scanning Electron Microscopy (FE-SEM, JEOL, JSM-7600F) with Energy Dispersive X-ray Spectrometer.
X-ray diffraction (XRD) patterns were collected to identify the phase of the fabricated electrode. To investigate the chemical oxidation states of the samples, X-ray photoelectron spectroscopy (XPS, SIGMA PROBE (VG, UK)). To calibrate the binding energy of the samples, C 1s photoelectron peak (284.5eV) was used. The detailed crystallographic structure and morphology is studied by Transmission electron microscopy (JEOL, JEM-2100F).
- 47 -
2.4. Electrochemical measurements
The fabricated electrodes were characterized by cyclic voltammetry (CV) in a three- electrode system consisting of fabricated electrode, Pt wire and saturated calomel electrode (SCE) as working electrode, counter electrode and reference electrode respectively. The schematic view of electrochemical setup is down below. (Figure 18)107 To perform hydrogen evolution reaction (HER) test, the nitrogen purged 0.5M H2SO4
electrolyte was used. For chlorine evolution reaction (CER) test, 5M NaCl (pH=2) was employed as electrolyte. The electrical double layer capacitance (EDLC) of electrodes were carried out by using cycling between 0.2V and 0.4V vs RHE at various scan rates of 10mV/s, 25mV/s, 50mV/s, 100mV/s and 200mV/s. The current density at 0.3V vs RHE and the corresponding scan rates were linearly plotted.
The ferrocene (Fe(C2H5)) solution (2mM) is prepared by dissolving ferrocene in acetone. To reduce the resistance of solution, 0.3M tetrabutylammonium tetrafluoroborate ([Bu4N] BF4) is used as supporting electrolyte. For each ferrocene solution, the cyclic voltammetry was recorded in the potential range of 0.6VSCE to 1.2VSCE at 10mV/s scan rate.
Vanadium redox couple solution is prepared by dissolving 0.1M VOSO4 in 3M sulfuric acid. For each solution, the cyclic voltammetry was conducted in the potential range of -0.75VSCE to 0.75VSCE at 50mV/s scan rate.
Electrochemical impedance measurements to obtain the Mott-Schottky plot, using a conventional three-electrode system and a computer-controlled multichannel potentiostat (PARSTAT MC 1000, Princeton Applied Research, USA).
- 48 -
The donor density of b-TiO2 substrate can be measured through the capacitance measurement. Using Mott-Schottky equation, the carrier density is calculated as follows.
1
𝐶
2= 2
𝑒𝐴
2𝜀𝜀
0𝑁
𝐷[(𝑈
𝑆− 𝑈
𝐹𝐵) − 𝑘
𝐵𝑇 𝑒 ]
Where C is the space charge capacitance, A is the geometric area of electrode, 𝑁𝐷 is the donor carrier density, e is the elementary charge, 𝜀0 is the permittivity of the free space, 𝜀 is the dielectric constant of the electrode material(=48 for anatase TiO2), 𝑈𝑆 is the applied potential, 𝑈𝐹𝐵 is the flat band potential, 𝑘𝐵 is the Boltzmann constant and T is the temperature.
To determine electrochemical characters of interface between electrode and interface, electrochemical impedance spectra (EIS) was measured under various potential from -1V to 2V vs SCE at fix frequency, 1000Hz. When voltage applied electrodes, the electrical capacitance and resistance are defined below. (Figure 19) 108 The electrochemical impedance spectroscopy (EIS) is a useful tool for analyzing the electrochemical properties of interfaces. The impedance method is a method of recording a change in capacitance and resistance by applying a small alternating voltage.
Electrochemical reactions often occur between the electrodes and the electrolyte, which can be analyzed by the impedance method. When the electrode is negatively charged on a flat electrode, the circuit corresponding to the schematic diagram is as follows. (Figure 19)
- 49 -
Also, the impedance value at this time is given by the following equation. 108
𝑍(𝜔) = 𝑅
𝑠+ 𝑅
𝑝+ 𝜎𝜔
−12𝜎𝜔
12(𝐶
𝑑+ 1)
2+ 𝜔
2𝐶
𝑑2(𝑅
𝑝+ 𝜎𝜔
−12)
2+ 𝑗
[𝜔𝐶
𝑑(𝑅
𝑝+ 𝜎𝜔
−12)
2
+ 𝜎𝜔
−12(𝐶
𝑑𝜎𝜔
12+ 1)]
(𝐶
𝑑𝜎𝜔
12+ 1)
2+ 𝜔
2𝐶
𝑑2(𝑅
𝑝+ 𝜎𝜔
−12)
2Here, ω = 2πf, f is frequnecy, j = √−1, and
𝜎 = 𝑅𝑇
√2𝑛
2𝐹
2𝐴 ( 1 𝐷
𝑂12𝐶
𝑂(𝑥, 𝑡)
+ 1
𝐷
𝑅12𝐶
𝑅(𝑥, 𝑡) )
where A is the electrode area, Cs are concentrations of subscripted species at a distance x from the
electrode surface, and t is time
When the frequency goes to infinity, the following equation can be used.
𝑍(𝜔) = 𝑅
𝑠+ 𝑅
𝑝1 + 𝜔
2𝐶
𝑑2𝑅
𝑝2− 𝑗 𝜔𝐶
𝑑𝑅
𝑝21 + 𝜔
2𝐶
𝑑2𝑅
𝑝2= 𝑍′(𝜔) − 𝑗𝑍′′(𝜔)
- 50 -
Conversely, when the frequency converges to 0, it becomes simpler as follows.
𝑍(𝜔) = 𝑅
𝑠+ 𝑅
𝑝+ 𝜎𝜔
−12− 𝑗(𝜎𝜔
−12+ 2𝜎
2𝐶
𝑑) = 𝑍′(𝜔) − 𝑗𝑍′′(𝜔)
The nyquist plot shows the real part on the x axis and the imaginary part on the y axis. In general, it can be confirmed that a semicircle is formed at a high frequency and a linear shape is formed at a low frequency. In this case, it is possible to derive a different graph depending on the ratio of the electron transfer rate to the diffusion rate. (Figure 20) 108 In TiO2 nanotube arrays, two types of models are commonly used. (Figure 21) 109-110 Recently, the second model is successful because in most cases wall is very conductive due to its thin thickness(~10nm). So we selected the second model to investigate TiO2
nanotube array interface.
- 51 -
Figure 18. Schematic view of 3-electrode system used in our study. [107] This system is also applied in fabrication of anodized TiO2.
- 52 -
Figure 19. General schematic view of electrolyte and electrode interface. [108]
- 53 -
Figure 20. Three typical cases of electrochemical impedance spectroscopy (a) fast diffusion rate compared to electron transfer rate, (b) similar diffusion compared to electron transfer rate, (c) slow diffusion compared to electron transfer rate. [108]
- 54 -
Figure 21. Two typical cases of model of TiO2 nanotube arrays. [109-110]
- 55 -
3. Results and discussion
3.1 Preparation of TiO
2NTAs
3.1.1 voltage dependence of TiO
2NTAs
First, the current profile seen in typical TiO2 nanotube array formation is as follows. As shown in the Figure 22, the current decreases dramatically as TiO2 is formed, and steady state is reached at some moment and a constant current is maintained. At this time, it is known that the rate of formation and dissolution of oxide is the same.111 The reason for the dullness in the graph is that chemical dissolution does not occur constantly when initial pore is generated. When 2nd anodization is performed, we can obtain a graph similar to the typical anodization process.
The magnitude of the diameter produced by varying the applied voltage was investigated with the same electrolyte conditions. TiO2 nanotubes are known to increase in diameter as the voltage increases. This is because the electric field affects the migration of ions as they increase and affects the diameter. As the voltage increases, the electric field also increases and the higher electric field weakens
![Figure 2. A schematic of the operation mechanism of the mercury cell. [7]](https://thumb-ap.123doks.com/thumbv2/123dokinfo/11714075.0/19.892.167.734.202.623/figure-2-schematic-operation-mechanism-mercury-cell-7.webp)
![Figure 9. conceptual process scheme of the novel two step chlor-alkali process. [7]](https://thumb-ap.123doks.com/thumbv2/123dokinfo/11714075.0/35.892.163.728.222.592/figure-conceptual-process-scheme-novel-chlor-alkali-process.webp)
![Figure 10. polyhedral representation of rutile(A) and anatase(B) and other unit cell structure (brookite: c, TiO 2 -B: d) [50-51]](https://thumb-ap.123doks.com/thumbv2/123dokinfo/11714075.0/38.892.215.687.206.915/figure-polyhedral-representation-rutile-anatase-unit-structure-brookite.webp)
![Figure 11. Summary of synthesize methods for TiO 2 nanomaterial. (a) general method for synthesizing nanomaterials [88] (b) AAO- assisted templated synthesize](https://thumb-ap.123doks.com/thumbv2/123dokinfo/11714075.0/46.892.188.711.237.877/summary-synthesize-nanomaterial-synthesizing-nanomaterials-assisted-templated-synthesize.webp)
![Figure 13. Factors that affect the morphology of TiO 2 nanotube arrays [75, 77, 90, 78, 80, 86, 87]](https://thumb-ap.123doks.com/thumbv2/123dokinfo/11714075.0/48.892.245.647.213.966/figure-13-factors-affect-morphology-tio-nanotube-arrays.webp)
![Figure 16. Summary of various doped TiO 2 and its color change characteristics. [96- [96-97]](https://thumb-ap.123doks.com/thumbv2/123dokinfo/11714075.0/56.892.239.649.225.895/figure-summary-various-doped-tio-color-change-characteristics.webp)
![Figure 17. Various methods to identify defect in black TiO 2 NTAs. [101-102]](https://thumb-ap.123doks.com/thumbv2/123dokinfo/11714075.0/57.892.187.706.202.958/figure-various-methods-identify-defect-black-tio-ntas.webp)
