저작자표시-비영리-변경금지 2.0 대한민국 이용자는 아래의 조건을 따르는 경우에 한하여 자유롭게
l 이 저작물을 복제, 배포, 전송, 전시, 공연 및 방송할 수 있습니다. 다음과 같은 조건을 따라야 합니다:
l 귀하는, 이 저작물의 재이용이나 배포의 경우, 이 저작물에 적용된 이용허락조건 을 명확하게 나타내어야 합니다.
l 저작권자로부터 별도의 허가를 받으면 이러한 조건들은 적용되지 않습니다.
저작권법에 따른 이용자의 권리는 위의 내용에 의하여 영향을 받지 않습니다. 이것은 이용허락규약(Legal Code)을 이해하기 쉽게 요약한 것입니다.
Disclaimer
저작자표시. 귀하는 원저작자를 표시하여야 합니다.
비영리. 귀하는 이 저작물을 영리 목적으로 이용할 수 없습니다.
변경금지. 귀하는 이 저작물을 개작, 변형 또는 가공할 수 없습니다.
공학박사학위논문
Decomposition of Bis(3-Sulfopropyl) Disulfide and Poly(Ethylene Glycol-Propylene Glycol) during Cu
Electrodeposition and
Its Monitoring via Electrochemical Method
구리 전해 도금 과정에서 유기 첨가제로 사용되는
bis(3-sulfopropyl) disulfi
de 및
poly(ethylene glycol-propylene glycol)의 분해와 이에 대한 전기화학적 모니터링
2016 년 2 월
서울대학교 대학원 화학생물공학부
최 승 회
Decomposition of Bis(3-Sulfopropyl) Disulfide and
Poly(Ethylene Glycol-Propylene Glycol) during Cu Electrodeposition and Its Monitoring via Electrochemical Method
구리 전해 도금 과정에서 유기 첨가제로 사용되는 bis(3-sulfopropyl) disulfide 및 poly(ethylene glycol-propylene glycol)의 분해와 이에 대한 전기화학적 모니터링
지도교수 김 재 정
이 논문을 최승회 박사학위논문으로 제출함
2015
년
11월
서울대학교 대학원 화학생물공학부
최 승 회
최승회의 공학박사 학위논문을 인준함
2015
년 12 월
위
원
장
(인
)부 위 원 장 (인)
위
원
(인
)위 원 (인)
위
원
(인
)i
Abstract
Cu electrodeposition has been widely utilized in various industrial fields because of its high productivity, low process cost, and excellent products qualities. Cu plating bath usually contains small amount of organic additives that control the morphologies and the properties of Cu deposits. However, the organic additives are unstable under the electrolytic condition and gradually decompose through various chemical and electrochemical reactions. Because of the decomposition of the additives and the consequent degradation of the solution performance, the additives concentrations of the bath are tightly monitored with the electrochemical methods such as cyclic voltammetry stripping (CVS), and maintained by daily bleed-and-feed system.
Despite those efforts, the bath is eventually unusable after long time operation of plating bath. It is because the breakdown products, which affect the properties of deposited Cu films and disturb the signal of monitoring tool, are uncontrollably accumulated in the bath. However, the present monitoring system cannot provide the information of breakdown products, and it is necessary to develop the advanced monitoring methods that enable to analyze not only the parent additives but also their breakdown products. Therefore, this study describes the influences of byproducts on Cu
ii
electrodeposition process in detail and suggests the advanced methodologies enabling the analysis of both the parent organic additives and their breakdown products.
The aging of bis(3-sulfopropyl) disulfide (SPS) over 120 min led to the deterioration in bath performance. It was associated with the breakdown of SPS into 3-mercapto-1- propane sulfonate (MPS) and 1,3-propane disulfonic acid (PDS) via the electro-oxidation reaction and the sequential chemical oxidation by dissolved oxygen gases. The subsequent experiments revealed that the effects of PDS on Cu2+ reduction kinetics, Cu film properties and filling capabilities are negligible since it could not form chemical linkage to the Cu surface. However, MPS significantly affected the electrochemical response of plating bath, leading to the inaccurate results in CVS analysis of SPS concentration. Moreover, the presence of MPS deteriorated the filling capability of Cu plating bath. Both aspects implied the need for the development of advanced monitoring methods that provide both SPS and MPS concentrations.
To evaluate their concentrations individually, a two-step CVS analysis was suggested in which the total accelerator concentration ([SPS] + 1/2[MPS]) and conversion ratio were separately determined. All MPS species in the bath were oxidized to SPS by controlling the plating solution pH. Subsequent modified linear approximation technique (MLAT)-CVS analysis successfully revealed the total accelerator concentration in the Cu
iii
plating solution. Individual SPS and MPS concentrations were thereby calculated using the conversion ratio evaluated from the difference in their relative accelerating abilities.
This modified method enabled determination of the SPS concentration with <10% error, suggesting a reliable and high accuracy tool to predict pattern filling capabilities of plating solutions.
During electrodeposition, poly(ethylene glycol-propylene glycol) (PEG-PPG), a suppressor-type additive, fragmented into lower molecular weight (MW) units by the oxidative scissoring reaction on ether bond. This reaction accompanied the change in terminal groups from hydroxyl to aldehyde, formic ester, and ketone and reduces average MW. Consequently, the aged solution contained high population of low MW PEG-PPG units, which affects both the electrochemical responses of bath and the properties of Cu deposits. This result indicated that the monitoring of MW of PEG-PPG was necessary for accurate prediction of solution performance.
Considering those factors, the breakdown products from decomposition of additives significantly affect the filling capabilities and Cu film properties. Concentration analyses of both parent additives and its breakdown product are necessary for accurate diagnosis of Cu plating bath. This comprehensive study provides the general guideline for the
iv
development of advanced monitoring methods that are more accurate than conventional CVS.
Key word: Cu, electrodeposition, organic additive, cyclic voltammetry stripping, bis (3-sulfopropyl) disulfide, poly(ethylene glycol-propylene glycol), modified linear approximation technique, dilution titration
Student number: 2012-30260
v
Content
Abstract ... i LIST OF TABLES ... viii LIST OF FIGURES ... ix Chapter I. Introduction ... 1 1.1. Recent Trend for Semiconductor Metallization ... 1 1.2. Cu Electrodeposition ... 5 1.3. Superfilling ... 10 1.4. Degradation of Plating Bath ... 15 1.4.1. Decomposition of SPS ... 15 1.4.2. Decomposition of PEG ... 17 1.4.3. Factors influencing the decomposition of organic additives ... 19 1.5. Monitoring Methods for Additives Concentrations ... 23 1.5.1. Cyclic voltammetry stripping ... 23 1.5.2. Spectroscopy analysis ... 28 1.6. Purpose of This Study ... 35 Chapter II. Experimental ... 38 2.1. Aging Experiment ... 38 2.1.1. Aging of SPS ... 38 2.1.2. Aging of PEG-PPG ... 39 2.1.3. Aging of full solution ... 41 2.2. Effect of Breakdown Products ... 41
vi
2.2.1. Solution extraction ... 41 2.2.2. Electrochemical analysis ... 42 2.2.3. Analysis of solution performance ... 43 2.3. CVS Analysis ... 45 2.3.1. Electrolyte ... 45 2.3.2. MLAT-CVS ... 46 Chapter III. Decomposition of SPS... 50 3.1. Decomposition of SPS ... 50 3.2. Effect of SPS Concentration ... 62 3.3. Effect of PDS ... 64 3.4. Effect of MPS ... 71 3.5. Summary ... 76 Chapter IV. Advanced CVS Monitoring Method ... 77 4.1. Two-step CVS Analysis ... 77 4.2. Summary ... 93 Chapter V. Decomposition of PEG-PPG ... 94 5.1. Decomposition of PEG-PPG ... 94 5.2. Effect of Breakdown Products ... 103 5.3. Summary ... 113 Chapter VI. Conclusion ... 114 Reference ... 117 국문초록 ... 125 Appendix I ... 129
vii
1. Introduction ... 129 2. Experimental ... 131 3. Results and Discussion ... 136 4. Conclusion ... 151 5. Reference ... 152 Appendix II ... 155 1. Introduction ... 155 2. Experimental ... 157 3. Results and Discussion ... 159 4. Conclusion ... 167 5. Reference ... 168 Appendix III ... 170 1. Introduction ... 170 2. Experimental ... 171 3. Results and Discussion ... 171 4. Conclusion ... 181 5. Reference ... 182 감사의 글 ... 192
viii
LIST OF TABLES
Table 3.1. Measured Concentrations of Accelerator with Conventional MLAT-CVS Analysis. ... 74 Table 4.1. Strategy to Oxidize MPS into SPS. ... 84 Table 4.2. Measured CT, XS, CS, and CM with Modified CVS Analysis. ... 91 Table 5.1. Chemical Structures and Their Chemical Shifts of PEG-PPG, SPS, and Water
in 1H- and 13C-NMR Spectra. ... 98
ix
LIST OF FIGURES
Figure 1.1. 2013 overall roadmap technology characteristic. (ref. 1) ... 3 Figure 1.2. Schematic diagram of damascene process. ... 4 Figure 1.3. Schematic diagram of Cu electrodeposition. ... 8 Figure 1.4. Conventional organic additives for Cu electrodeposition. ... 9 Figure 1.5. (a) Subconformal, (b) conformal, and (c) superconformal profiles of Cu at
the initial and final stage of electrodeposition. ... 13 Figure 1.6. Superconformal film growth based on CEAC mechanism. (ref. 54) ... 14 Figure 1.7. Number of failure in wafer electric test of interconnection. ... 20 Figure 1.8. Molecular structures of PDS. ... 21 Figure 1.9. PEG decomposition pathway by electrolysis. (ref. 75) ... 22 Figure 1.10. Standard procedures of MLAT-CVS. ... 29 Figure 1.11. Example Q plot for MLAT-CVS analysis of accelerator. The numbers
indicate the charges obtained from corresponding unit procedures in Figure 1.9. (see Figure 1.9) ... 30 Figure 1.12. Standard procedures of DT-CVS. ... 31 Figure 1.13. Example Q plot for DT-CVS analysis of suppressor. ... 32 Figure 1.14. Standard procedure of RC-CVS. ... 33 Figure 1.15. Example RC plot for RC-CVS analysis of leveler. ... 34 Figure 2.1. Schematic diagram of aging experiment. ... 49
x
Figure 3.1. Filling performance of plating solutions aged for (a) 0 min, (b) 30 min, (c) 60 min, (d) 90 min, (e) 120 min, and (f) 180 min. 360 μM PEG–PPG was added before the experiments. ... 56 Figure 3.2. CV voltammograms of plating solutions aged for 0, 30, 60, 90, 120, and 180
min. 360 μM PEG–PPG was added before the experiments. ... 57 Figure 3.3. (a) 1H-NMR spectrums of plating solutions aged for 0, 30, 60, 90, 180 min.
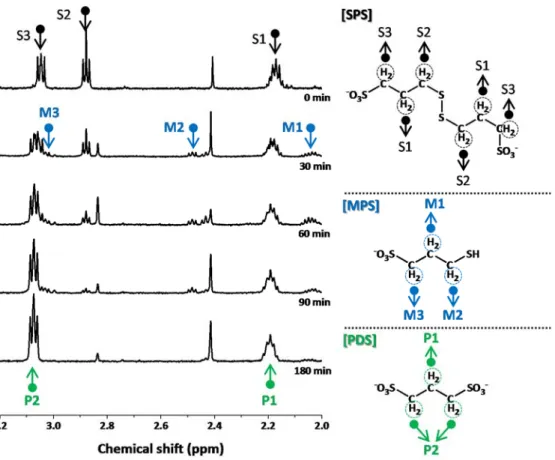
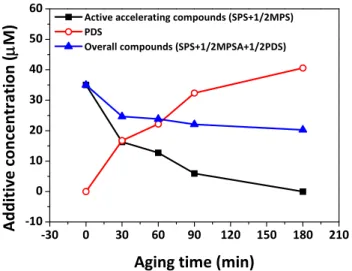
Black (S1~S3), blue (M1~M3), and green (P1, P2) arrows indicate the peaks of SPS, MPS, and PDS, respectively. 1H-NMR spectrums of (b) power and (c) standard samples were also displayed. ... 58 Figure 3.4. 1H-NMR spectrums of (a) power and (b) standard samples. ... 59 Figure 3.5. Concentrations of active accelerating compounds, PDS and overall
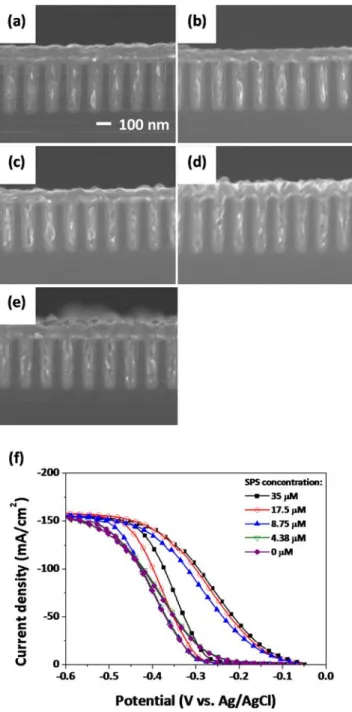
compounds in the plating solution aged for 0, 30, 60, 90, and 180 min. The active accelerator concentrations were calculated from the sum of SPS and one-half of MPS concentrations. ... 60 Figure 3.6. Decomposition pathway of SPS during electrodeposition. ... 61 Figure 3.7. Filling performance of SPS as function of its concentration: (a) 35, (b) 17.5,
(c) 8.75, (d) 4.38, and (e) 0 μM, respectively. PEG–PPG (360 μM) was also added. The CV voltammograms corresponding to (a)–(e) are shown in (f).
... 63 Figure 3.8. Redox reactions of SPS-related compounds during Cu electrodeposition.67 Figure 3.9. CV results of plating solution as function of the (a) conversion ratio of SPS
and (b) PDS concentrations. PEG–PPG (360 μM) was also added. ... 68
xi
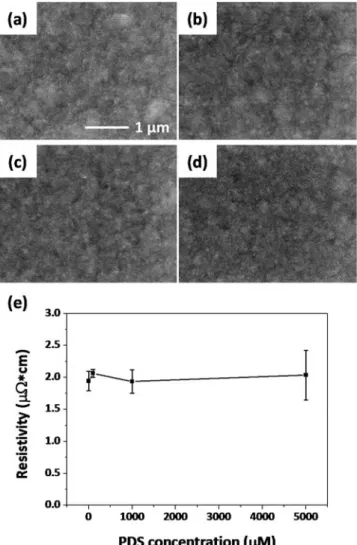
Figure 3.10. Surface morphology of Cu films deposited with (a) 0, (b) 100, (c) 1000, (d) 5000 μM PDS. PEG–PPG (360 μM) was also added. The resistivities obtained from (a)–(d) are shown in (e). ... 69 Figure 3.11. (a) XRD spectrum, (b) grain sizes, and (c) carbon contents of Cu films
deposited with 0, 100, 1000, 5000 μM of PDS. PEG–PPG (360 μM) was also added. The grain sizes of the films were obtained from Scherrer’s equation.
... 70 Figure 3.12. CVS results showing the influence of XS on the accelerating effect. .... 73 Figure 3.13. Filling performances of plating solutions (a) #1, (b) #2, (c) #3, (d) #4, (e) #5,
and (f) #6 (see Table 1 for details) ... 75 Figure 4.1. Algorithm of two-step CVS analysis. ... 83 Figure 4.2. 1H-NMR results of MPS in Cu plating solutions after the treatments 1. (see
Table 3.1) ... 85 Figure 4.3. 1H-NMR results of MPS in D2O solutions containing 1 mM CuSO4 and
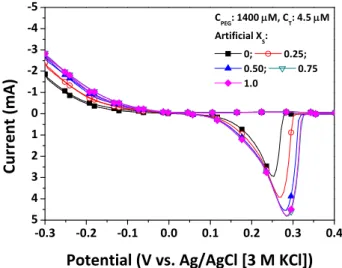
different amounts of H2SO4 as a pH adjuster. For the comparison, 1H-NMR results of SPS and MPS in pure D2O were also presented. ... 86 Figure 4.4. CVS results with various XS values after pH adjustment. ... 87 Figure 4.5. MLAT-CVS results of accelerator concentrations in Cu plating solutions with
and without pH adjustment. ... 88 Figure 4.6. (a) Q/Qi as a function of CT with various XS values. The slope of the Q/Qi vs.
CT plot is presented in (b). ... 89
xii
Figure 4.7. Modified CVS analysis procedure. ... 90 Figure 4.8. Concentration changes of SPS, MPS, and PDS during aging experiments
with (a) Ir/IrOx insoluble and (b) Cu plate soluble anodes. ... 92 Figure 5.1. (a) Normalized 1H-NMR spectra of PEG-PPG after 0 hr, 3 hr, 6 hr, and 9 hr
of aging. The magnified images of each of the peaks show the formation of (b) formic ester, (c) hydroxyl, (d) aldehyde, (e) ketone, and (f) propyl groups.
... 99 Figure 5.2. 13C-NMR spectra of PEG-PPG, before and after aging. ... 100 Figure 5.3. MALDI-TOF spectra of PEG-PPG after 0 hr, 3 hr, 6 hr, and 9 hr of aging.
... 101 Figure 5.4. Decomposition mechanisms of PEG-PPG during Cu electrodeposition.
... 102 Figure 5.5. Changes in PEG-PPG concentrations; amount of PEG-PPG consumed during
aging was periodically supplied at intervals of 15 hr, 25 hr, and 35 hr based on electrochemically calculated values of CVS measurements. ... 108 Figure 5.6. MALDI-TOF spetra of PEG-PPG after 0 hr, 15 hr, 25 hr, and 35 hr of aging
and periodic addition of supplement. The analyses were carried out just after the addition of PEG-PPG supplement as shown in Figure 5.4... 109 Figure 5.7. GPC spectra of PEG-PPG after 0 hr, 15 hr, 25 hr, and 35 hr of aging and
periodic addition of supplement. The analyses were carried out just after the addition of PEG-PPG supplement as shown in Figure 5.4. ... 110
xiii
Figure 5.8. CAs of fresh and aged electrolytes after addition of 35 μM SPS at (a) -0.10 V, (b) -0.15 V, and (c) -0.2 V.(d) Additional CAs in fresh electrolytes containing 35 μM SPS, and 1.67 mM NaCl and PEG of various MWs and concentrations.
The mass concentrations of PEGs were fixed at 1260 ppm to maintain the concentration of monomers. Aging of electrolyte was carried out through electrodeposition and periodic addition of PEG-PPG supplement as depicted in Figure 5.4. ... 111 Figure 5.9. (a) Surface morphology, (b) XRD spectra, (c) Cu (111) grain sizes calculated
using Scherrer’s equation, and (d) resistivities of Cu films obtained from fresh and aged electrolytes. 35 μM SPS was added to the electrolyte prior to electrodeposition. Aging of electrolyte was carried out through electrodeposition and periodic addition of PEG-PPG supplement as depicted in Figure 5.4. ... 112
1
Chapter I. Introduction
1.1. Recent Trend for Semiconductor Metallization
The continuous demand for the high performance electronic device and the reduction of process cost have driven the development of ultra large scale integration (ULSI) semiconductor devices. The critical dimension of semiconductor devices has continued to decrease in accordance with Moore’s law, and recently, the development of 14 nm- scale technology is ready to be realized. Figure 1.1 describes the critical dimension of logic and memory devices for next generation suggested by 2013 International Technology Roadmap for Semiconductor (ITRS).1
Continuous decrease of semiconductor dimension has led to the changes in the wiring materials from Al to Cu.2 It is attributed to the substantial increase of resistance- capacitance delay (RC delay) caused by the decrease of the wiring width to a few nanometer scale. Therefore, since the late 1990’s, the RC delay has dominated the gate delay, determining the overall speed of microprocessor.3 It stimulates the use of low resistivity wiring materials like Cu (1.67 μΩ ∙ cm) and Ag instead of Al (2.66 μΩ ∙ cm) in the metallization process. Furthermore, it has been reported that Cu has advantage
2
over Al against the electromigration problem that are strongly related with the reliability issues.2,3
The change in wiring material from Al to Cu accompanies the development of Cu damascene process. Generally, Al metal line is fabricated with the sequential unit processes of physical vapor deposition (PVD), lithography, subtractive etching, and the deposition of surrounding dielectric. However, this process sequence cannot be directly applied to the metallization of Cu, since the non-volatile CuCl2 residue remains on substrate after the subtractive etching process.
Therefore, the damascene process has been developed for Cu metallization. Figure 1.2 presents the standard procedure of damascene process.6-15 Damascene process typically comprises the unit processes of the deposition of interlayer dielectric material, lithography and the etching for pattern formation, physical vapor deposition (PVD) of diffusion barrier layer, PVD of Cu film as seed layer, electrodeposition of Cu for pattern filling, and the chemical-mechanical polishing for the planarization. Recently, due to the poor step coverage of PVD,16-19 the alternative processes such as electroless deposition (ELD), chemical vapor deposition (CVD), or atomic layer deposition are suggested for the fabrication of diffusion barrier and Cu seed layer.20-22
3
Figure 1.1. 2013 overall roadmap technology characteristic. (ref. 1)
4 Figure 1.2. Schematic diagram of damascene process.
5
1.2. Cu Electrodeposition
Cu electrodeposition is one of core processes in the damascene Cu metallization.6-15 This process is based on the electrochemical reduction of Cu2+ ion onto the substrate surface by the external power source. Figure 1.3 describes the detail mechanism of Cu electrodeposition. Under the electric field by external power source, Cu2+ ion from bulk solution moves to the surface of substrate by the convection, the diffusion, and the migration process. Then, Cu2+ ion adsorbs on Cu surface and diffuses until it reaches the vacant lattice sites. At the vacant sites, Cu2+ is confined and reduced to metallic Cu by two-step charge transfer; the reduction of Cu2+ to Cu+ and the reduction of Cu+ to Cu0. Among those process, the slowest step is regarded as the rate-determination step.
The qualities of Cu deposits are affected by process variables, such as the supporting electrolyte, the potential/current waveform, and the combination of organic additives.
Supporting electrolyte is non-reactive solute for the purpose of minimizing the solution resistance and stabilizing Cu2+ ion in the solution. Currently, sulfuric acid, pyrophosphate and cyanide-based solutions have been generally utilized as supporting electrolytes for various purposes.23,24 Particularly for the damascene Cu plating, the sulfuric acid-based
6
electrolyte has been mostly preferred due to its excellent filling capability, low cost, and low toxicity.10-15
The potential/current waveform is also significant factor affecting the performance of plating bath. While the constant current/potential is generally applied in the majority of industrial field, the uses of modified waveforms like pulse, and pulse-reverse have been widely applied for the control of grain size,25 the enhancement of filling capability,26,27 and the construction of twin boundaries that shows excellent mechanical properties.28-31
The morphologies and the properties of Cu deposits are also affected by the combination of organic additives. As shown in Figure 1.4, the organic additives have been categorized as the accelerator, suppressor, and leveler based on their electrochemical behaviors and functionality on the pattern filling process. Suppressor group additives are typically the polymers containing either ethylene or propylene oxide such as polyethylene glycol (PEG), polypropylene glycol (PPG), or copolymer (PEG- PPG).32-40 They generally control the uniformity of deposited films through adsorption in the complex form with the dissolved cuprous and chloride ions on the surface of Cu.38,40 Meanwhile, accelerator group additives typically contain either mercapto or disulfide functional groups such as bis(3-sulfopropyl) disulfide (SPS), 3-mercapto-1- propanesulfonate (MPS), and 3-N,N-dimethylaminodithiocarbamoyl-1-propanesulfonic
7
acid (DPS).41-48 They improve the surface roughness and enable the superfilling of Cu for fabricating the metal interconnections in various electronic devices.41-48 The third chemical group is called as the leveler, which decreases the micro-scale roughness of Cu deposits by reducing the current flowing to the peak site to below that flowing to the recessed site through a convection-dependent adsorption mechanism.49-53 1,2,3- benzotriazole (BTA), janus green B (JGB), dodecyltrimethylammonium chloride (DTAC), and polyethylene imine (PEI) are typically used as leveling agent.49-53
8 Figure 1.3. Schematic diagram of Cu electrodeposition.
9
Figure 1.4. Conventional organic additives for Cu electrodeposition.
Structure Accelerator
Suppressor
Leveler
‐O3S H2 C C
H2 H2 C S S
CH2 H2 C C
H2 SO3‐
2NA+
CH2 H2 C
O CH CH2
O CH3
n CH2
H2 C
O
n O CH
CH2 CH3
n
N
N+ N
N N N
Cl‐
HN
N N
SPS DPS
PEG PPG PEG‐PPG
BTA JGB
H2 C C
H2 H2 S C O
HO O C
H2 S
C N CH3
CH3 S
MPSA
H2 C C
H2 H2 C SH S
O O HO
DTAC
CH2 H2 C N
H n
PEI
H3C H2 C
N+
11
10
1.3. Superfilling
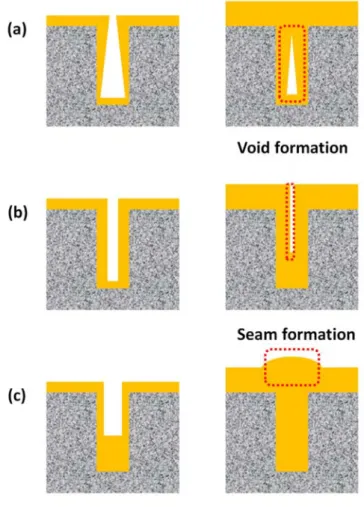
Generally, the growths of Cu in patterned substrates result in three types of cross- sectional profiles; subconformal, conformal, or superconformal profiles. Figure 1.5 shows the subconformal, conformal and superconformal deposits profiles. Subconformal profile results from the rapid Cu deposition on the trench top relative to trench bottom. It generally appears when the Cu deposition rate is governed by either the mass transfer or the solution resistance. Meanwhile, the conformal profile is formed when the deposition rates at the trench top and trench bottom are comparable, which results from the charge transfer-limited Cu deposition by the conformal adsorption of suppressor-type additives.
Both subconformal and conformal profiles are improper for Cu interconnection because it has been known that the void and seam are vulnerable for electromigration.2,3 Therefore, the superconformal profile is mostly preferred and it can be achieved by the proper combination of organic additives.
The Cu superfilling within a submicron trenches or microscale vias has been demonstrated by a number of different mechanisms including curvature enhanced accelerator coverage (CEAC),11,12,54,55 convection dependent adsorption (CDA),56-58 and negative differential resistance (NDR)59-62 models. CEAC model is associated with the
11
bottom-up process of the submicron-sized trenches. For CEAC mechanism, the bottom- up filling of metal is explained with the increase of accelerator coverage at the bottom of features by the reduction of geometrical area. This phenomenon is quantified by Eq. 1.1 that shows the differential changes of accelerator coverage by the area reduction, displacement of suppressor, and the incorporation.54
dθ
dt κνθ C k 1 θ k θ Eq. 1.1
Here, θ is the surface coverage of SPS, κ is the curvature, ν is the interface velocity, CSPS is the concentration of SPS, k is the adsorption coefficient of SPS on Cu surface, k is the incorporation constant, and q is the power-law consumption exponent. The first term, κνθ , indicates the increase of SPS coverage by the reduction of geometrical area at the bottom of trench. The accelerator is rapidly accumulated in the bottom of trenches where the area reduction proceeds due to sidewall thickening. It leads to the higher Cu deposition rate at the bottom, followed by the bottom-up filling and bump formation, as described at Figure 1.6.56
Both CDA and NDR models are related to the bottom-up filling of micro-sized patterned features such as microvia or through silicon via (TSV). According to CDA model, the leveler-type additives adsorbs preferentially on the pattern tops where the diffusion length from bulk solution is relatively short. This has been demonstrated by
12
several electrochemical analyses where the electrodes with rotation is more polarized than that without rotation.56-58
NDR model is based on the local inhibition breakdown at the bottom of via, followed by the fast bottom-up filling until the inhibition layer is re-established. This was firstly suggested by Moffat et al who achieved bottom-up filling of Cu into TSV using tetronic 701 as single suppressor additives.59 Further investigation in Au, Zn, and Ni systems has elucidated the detail mechanism and revealed critical variable to achieve the bottom-up filling without voids.60-62
13
Figure 1.5. (a) Subconformal, (b) conformal, and (c) superconformal profiles of Cu at the initial and final stages of electrodeposition.
14
Figure 1.6. Superconformal film growth based on CEAC mechanism. (ref. 54)
15
1.4. Degradation of Plating Bath
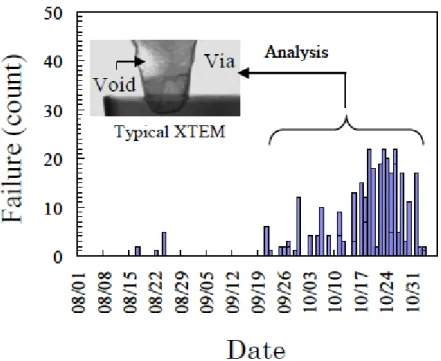
As aforementioned at section 1.2, the organic additives are crucial factors affecting the morphology and the properties of Cu deposits. However, the organic additives are not stable in the electrolytic condition and they gradually decompose through various chemical/electrochemical side reactions.63-80 As shown in Figure 1.7, the decomposition of organic additives leads to the degradation of bath performances, leading to defects in either trench filling or the subsequent chemical–mechanical planarization (CMP) process.65,70 This chapter introduces the decomposition mechanisms of additive, especially focusing on the well-known two additives, SPS and PEG.
1.4.1. Decomposition of SPS
It has been known that the decomposition of accelerator occurs through at least three kinds of pathways; the reaction with dissolved oxygen molecular, the electro-oxidation reaction, and the dissociation reactions.63-72 The reaction by oxygen molecular occurs under both open circuit and electrolytic conditions. Healy et al. has reported that SPS decomposes under open circuit condition by Cu+, which comes from the
16
comproportionation-disproportionation reaction between Cu2+ and metallic Cu, to form Cu-thiolate complex.67 They also have suggested that the Cu-thiolate complex is unstable in the presence of O2 and undergoes oxidation. Koh et al. has reported that the Cu- thiolate complexes can react with dissolved oxygen molecular to form inactive sulfonate compounds.69 This reaction can take place even at the open circuit conditions when the Cu ion is present. However, the electrolytic condition can prompt the decomposition rate because of the rapid formation of cuprous ion at both cathode and anode.63,64
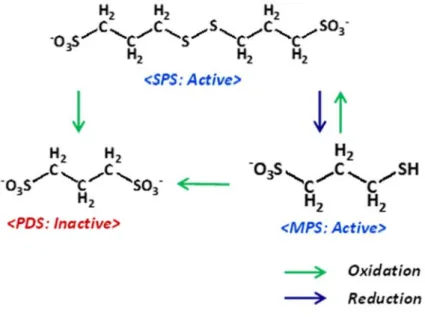
The electro-oxidation reaction occurs at the anode under electrolytic condition. This reaction yields 1,3-propane disulfonic acid (PDS) as breakdown products as described at Eq. 1.2.63,68
SPS 6H O → 2PDS 10e 12H Eq. 1.2
Figure 1.8 presents the molecular structures of PDS. Since this reaction occurs at the surface of anode, the reaction rate is affected by the properties and surface area of anode.
This reaction occurs more rapidly when the anode overpotential is high, therefore, the use of insoluble anode usually prompts the reaction 1.2.63,81
The third decomposition pathway is the dissociation of disulfide bonds on the cathode surface.42,82-84 This reaction accompanies the formation of two MPS molecular, some of
17
which are recombined into SPS by the oxidation reaction with cupric ion. The redox cycle between SPS and MPS is presented at Eq. 1.3.42,63,84
2MPS 2Cu ↔ SPS 2Cu 2H Eq. 1.3
Here Cu+ is further stabilized to form complex with residual MPS or Cl-,24 or rapidly oxidized by dissolved oxygen molecular.85 Eq 1.3 is often used to explain the catalytic effect of SPS or MPS on Cu reduction process.84
1.4.2. Decomposition of PEG
Unlike to SPS, PEG have been shown to be stable under the open circuit conditions.
However, under the electrolytic condition, PEG also decomposes and gradually fragments into low molecular units by either nucleophilic substitution reaction or the radical decomposition reaction.73-77
The nucleophilic substitution mechanism is based on the catalytic activity of Cu2+ for the cleavage of ether bond at the cathode surface.74 This reaction occurs via two-step; the nucleophilic substitution reaction followed by the successive unimolecular or bimolecular elimination reactions, as described Eqs 1.4-1.5.
18
R CH CH O CH CH R HNu:
→ R CH CH Nu R′ CH CH OH Eq. 1.4
R CH CH Nu → R CH CH HNu Eq. 1.5
Here, R and R’ are the polymer chain and Nu is the nucleophile such as Cu2+ ion.
These reactions happen at the cathode and yield the vinyl ether- and alcohol-terminated PEG.74
The radical decomposition mechanism focuses on the reactivity of hydroxyl radical generated by the series of chemical reactions, as described at Eqs 1.6-1.14.75,86,87
2Cl → Cl 2e Eq. 1.6
Cl H O ↔ HOCl Cl H Eq. 1.7
HOCl ↔ H OCl Eq. 1.8
6OCl 3H O → 2O Cl 4Cl 6H 3
2O 6e Eq. 1.9
O Cl H O → O Cl 2H 2e Eq. 1.10
OCl 2HOCl → ClO 2Cl 2H Eq. 1.11
HOCl OCl → ClO ∙ Cl OH ∙ Eq. 1.12
OH ∙ OCl → ClO ∙ OH Eq. 1.13
OCl ∙ OCl OH → 2Cl O OH ∙ Eq. 1.14
19
The hydroxyl radical abstracts hydrogen from a methyl group in PEG to generate PEG internal radical and H2O, followed by the C-O hydrolysis resulting in the breakdown of PEG, as shown in Figure 1.9.75 Finally, low molecular weight (MW) PEG with aldehyde-, ethyl ether-, and vinyl ether-terminal groups are produced as byproduct.75
1.4.3. Factors influencing the decomposition of organic additives
The decomposition of organic additives depends on the several process factors such as the type of anode, oxygen level in plating bath, applied current/potential, or the presence of membrane. The insoluble anode usually results in fast decomposition of organic additives because of its high anodic potential stimulating anodic-oxidative decomposition reaction and the oxygen evolution.63,73,81 The soluble Cu anode also has the potential risk for SPS decomposition, providing cuprous ion that drives the oxidation of SPS by dissolved oxygen.67,69 Therefore, the phosphorous impurity has been used to diminish the release of cuprous ion into the electrolyte. The membrane to separate the cathodic and anodic spaces also has been widely applied in order to inhibit the decomposition and enlarge bath lifetime.88
20
Figure 1.7. Number of failure in wafer electric test of interconnection. (ref. 70)
21
‐
O
3S H
2C C
H
2H
2C SO
3‐Figure 1.8. Molecular structures of PDS.
22
Figure 1.9. PEG decomposition pathway by electrolysis. (ref. 75)
23
1.5. Monitoring Methods for Additives Concentrations
Because of decomposition of the additives and the consequent degradation of the solution performance, concentration monitoring systems and additive feeding systems based on the measured concentrations are necessary to maintain the performance of the plating solution. Various methods have been developed for monitoring the additive concentrations, including the electrochemical techniques89-95 such as cyclic voltammetry stripping (CVS)89-93 and cyclic pulse voltammetry stripping (CPVS),94 and the spectroscopic methods such as nuclear magnetic resonance (NMR),63,73 UV-visible spectroscopy,42,80 mass spectroscopy,64,65,75,77 raman spectroscopy,96 chromatography.97,98 This chapter briefly introduces CVS method and the various spectroscopic tools to evaluate the concentrations of organic additives in Cu plating solution.
1.5.1. Cyclic voltammetry stripping
CVS has been regarded as the most powerful method for the determination of additives concentrations in Cu plating solution.63,69,70,73,89-94 This method is based on the impact of organic additives on Cu reduction kinetics; the accelerator-type additives
24
increase the deposition rate, while the suppressor-type additives decrease the deposition rate. Several experimental techniques known as the dilution titration (DT), the modified linear approximation technique (MLAT) and the response curve (RC) are applied to determine the concentration of suppressor-, accelerator-, and leveler-type additives, respectively.73,89,92,93
(a) MLAT-CVS
MLAT-CVS is used for the analysis of accelerator concentration.89,93 The standard procedure of MLAT-CVS is described at Figure 1.10; 1) evaluation of Qi from CVS analysis of the suppressor-saturated plating solution (the intercept solution); 2) evaluation of Q0 after addition of the target solution (Cu plating solution to be analyzed) into the intercept solution; 3) evaluation of Q after addition of the accelerator standard solution into the intercept solution; 4) repetition of procedure 3 (2–3 times) to determine the increase in ∆Q/∆Cs; and 5) evaluation of the accelerator concentration in the target plating solution from the Eq. 1.15.
C Q Q
∆Q/∆C
V V
V Eq. 1.15
Here Qi, Q0, and Q are the stripping charges of the intercept solution, the intercept solution mixed with the target solution, and the intercept solution after the addition of
25
accelerator standard solution, respectively. And, C is the concentration of accelerator in target plating solution, CS is the concentration of SPS in intercept solution after addition of accelerator standard solution, and C is the concentration of accelerator in target plating solution, Vi is the volume of intercept solution, and Vt is the addition volume of target solution, respectively.
Figure 1.11 presents the example Q-plot for the MLAT-CVS analysis of SPS, a representative accelerator. By SPS in target plating solution, Q0 is higher than Qi, and the value of Q0-Qi converts to SPS concentration with comparing the charge increase by unit SPS concentration.
(b) DT-CVS
DT-CVS is typically used for the quantification of suppressor-type additives.73,92,93 Figure 1.12 shows the standard procedure of DT-CVS analysis. In DT-CVS, the suppressor concentration in the target plating solution is determined by the following procedures; (1) measurement of the stripping charge (Qb) by CVS of an additive-free plating solution, named as base solution, (2) addition of a small amount of the target plating solution into the base solution, (3) measurement of the normalized stripping charge (Q/Qb) by CVS of the mixture, (4) repetition of procedures (2)-(3) until Q/Qb
26
reaches an end point, referred to as the evaluation ratio which is a predetermined value for titration calculation, and (5) measurement of the volume of the target plating solution at the specific evaluation ratio. Above procedures are identically applied to the standard solution, in which the concentration of suppressor is tightly controlled to make the standard curve (calibration curve) of Q/Qb as a function of suppressor concentration. By comparing the volume of the target solution with that of a standard solution at the evaluation ratio, the suppressor concentration of the target solution can be determined, from the basic titration formula shown in Eqs. 1.16-1.18.
C C at evaluation ratio Eq. 1.16
C C V C
V V
V C
V V Eq. 1.17
C V C
V V
V V
V Eq. 1.18
In the above equation, C is the concentration of suppressor in (target + base) mixture, C’ is the concentration of suppressor in (standard + base) mixture, Vb is the volume of the base solution, Vs is the volume of the standard solution at the evaluation ratio, Vp is the volume of the target solution at the evaluation ratio, Cs is the concentration of the suppressor in the standard solution, and Cp is the concentration of the suppressor in the target solution.
27
Figure 1.13 shows typical Q-plot results of DT-CVS. By the suppressor species in the target plating solution, Q/Qb decreases with addition of target plating solution and finally reaches the evaluation ratio. The volume of target plating solution required to lower Q/Qb
to evaluation ratio is compared to that of standard solution, and thereby the concentration of suppressor can be eventually evaluated.
(c) RC-CVS
The RC-CVS method is typically used for the determination of leveler-type additive in Cu plating solution.93 In RC-CVS method, the decrease in stripping charge by leveler species is measured, which sequentially converts into leveler concentration in plating solution. Standard procedure of RC-CVS is described at Figure 1.14. Preliminarily, the standard calibration curve (also named as RC curve) depicting the relation between leveler concentration and normalized stripping charge was obtained with following steps;
1) preparation of suppressor- and accelerator-saturated Cu plating solution called as base solution, 2) measurement of stripping charge, 3) addition of leveler standard solution into base solution, 4) measurement of stripping charge, 5) repetition of procedure 3-4 (for 5- 10 times).
28
Figure 1.15 presents the typical example of RC curve showing the linear relation between Q/Qb and leveler concentration. With this calibration plot, the leveler concentration of unknown sample is can be accurately determined.
1.5.2. Spectroscopy analysis
Various merits of CVS including the accuracy, the simplicity, and the time requirement for analysis has allowed its wide applications in the various industrial fields. However, the drawback of CVS has been pointed out, including the incapability of the analysis of breakdown products and the signal interference by breakdown products.70,73 The detection and quantification of byproduct conventionally relies on the spectroscopic methods such as UV-visible spectroscopy,42,80 1H-NMR,63,73 and mass spectroscopy.64,65,75,77 For the application of spectroscopy, the pretreatment of solution sample is necessarily carried out in order to extract organic species from plating bath.
Examples of pretreatment include solid phase extraction (SPE)68,74 and liquid-liquid extraction.78,79 Various applications of spectroscopic methods on the monitoring of plating solution can be found elsewhere.63-66,73,74,96-99
29 Figure 1.10. Standard procedures of MLAT-CVS.
Start
Addition of target solution into intercept solution
CVS (plot #2) Trial = 3
End CVS of intercept
solution (plot #1)
No
Yes Addition of accelerator
standard solution into intercept solution
CVS (plot #3‐5) Preparation of intercept
solution
30
Figure 1.11. Example Q plot for MLAT-CVS analysis of accelerator. The numbers indicate the charges obtained from corresponding unit procedures in Figure 1.9. (see Figure 1.9)
‐0.08 ‐0.06 ‐0.04 ‐0.02 0.00 0.02 0.04 0.06 0.08
20 40 60 80 100
y* = y intercept
#5
#4
#2
Q‐Q intercept (C)
Addition volume of SPS standard solution (mL)
#3
x* = x intercept
31 Figure 1.12. Standard procedures of DT-CVS.
Start
Addition of standard solution into VMS
CVS (Q)
Q/Qb< E.R.
End CVS of VMS (Qb)
Addition of target solution into VMS
CVS (Q)
Q/Qb< E.R.
CVS of VMS (Qb)
No No
Yes Yes
32
Figure 1.13. Example Q plot for DT-CVS analysis of suppressor.
0.0 0.1 0.2 0.3 0.4 0.5 0.6
0.0 0.1 0.2 0.3 0.4 0.5 0.6 0.7 0.8 0.9 1.0 1.1
V
tQ/Q b
Addition volume (mL)
Standard solution Target solution
Evaluation ratio (E. R.)
V
S33 Figure 1.14. Standard procedure of RC-CVS.
Start
Addition of leveler standard solution into base solution
CVS (Q)
Q/Qb< End point
End
Preparation of base solution and CVS (Qb)
No
Yes
Preparation of base solution and CVS (Qb)
CVS (Q)
Addition of target solution into base solution
34
Figure 1.15. Example RC plot for RC-CVS analysis of leveler.
0 2 4 6 8 10
0.7 0.8 0.9 1.0
1.1 y = ‐0.025 x + 0.987 R2=0.975
Q/Q b
Addition volume of L standard solution (L)
35
1.6. Purpose of This Study
Although the significant efforts are continuously made to maintain the concentration of organic additives in Cu plating bath, the bath is eventually unusable after long time of operation due to the impacts of additive breakdown products. The breakdown products might either adsorb on Cu surface or form a complex with Cu2+ ion, thereby deteriorating the filling capability of plating bath and changing the properties of Cu film. Besides, the additives breakdown products might disturb the monitoring results if their signals are overlapped with their parent additives. For example, MPS, one of the breakdown products from SPS decomposition, might disturb the MLAT-CVS results of SPS concentrations because both MPS and SPS result in the acceleration effect for Cu reduction. Considering those aspects, it is necessary to develop the advanced monitoring methods that enable to analyze not only the parent additives but also their breakdown products.
This study comprehensively describes the additives decomposition phenomenon, the influences of breakdown products, and the development of advanced monitoring methods for accurate evaluation of bath performance. In particular, the decompositions of SPS and PEG-PPG are focused on.
36
In chapter 3, the influences of breakdown products from SPS decomposition are investigated by analyzing the electrochemical behavior, Cu film properties and the filling capability. At first, the breakdown products of SPS are verified using in-situ 1H-NMR analysis. The analyzed breakdown products are MPS and PDS, and the subsequent experiments revealed their effects on the filling capability and CVS monitoring results.
In chapter 4, a two-step CVS analysis was suggest for the individual measurement of SPS and MPS concentrations in acidic Cu plating solution. The suggested method is based on an assumption that the interconversion between SPS and MPS is strongly influenced by the solution pH because oxidation of MPS into SPS accompanies the formation of a proton (Eq. 1). In the first step, we determined the total accelerator concentration (conc. of SPS + 1/2 conc. of MPS) using the MLAT-CVS method, after oxidizing MPS into SPS by adjusting the Cu plating solution pH. Subsequently, in the second step we determined the conversion ratio from the result that acceleration by MPS was more effective than that by SPS. We finally obtained the concentrations of SPS and MPS separately using the values of the total accelerator concentration and conversion ratio.
In chapter 5, the decomposition of PEG-PPG during Cu electrodeposition and the influences of MW reduction are studied. The breakdown product of PEG-PPG was
37
examined with the spectroscopic methods including 1H-NMR, matrix assisted laser desorption ionization time of flight (MALDI-TOF), and gel permeation chromatography (GPC). The influence of breakdown products was also studied by analyzing the electrochemical behavior and performances of aged bath.
38
Chapter II. Experimental
2.1. Aging Experiment
2.1.1. Aging of SPS
Figure 2.1 illustrates the experimental apparatus used in this study. Individual additives was intentionally decomposed by continuous electrodeposition under conventional plating conditions, referred to as the “aging experiments” throughout this paper.
The SPS aging experiments consisted of the following procedures: (1) electrodeposition with a suppressor-free electrolyte for 30, 60, 90, 120, and 180 min, (2) supplement of the consumed CuSO4 and NaCl, and (3) collection and analysis of the plating solution. Electrodeposition for the aging experiment was carried out at a 10 mA/cm2 current density at 25°C. The plating solution consisted of 0.56 M CuSO4, 1.47 M H2SO4, 1.67 mM NaCl, and 35 μM SPS. Cu foil with an active area 70 cm2 was used as the working electrode and either Ir/IrOx or Cu plates were used as counter electrodes.
The total volume of solution in the bath was 1.5 L. The bath was equipped with a bubbler
39
to enhance the mass transport of cupric ions. After the experiments, some of the plating solution was extracted for 1H-NMR measurements.
Since both cupric and chloride ions are consumed during aging experiment, they were periodically supplied every 30 min. The supplementing of CuSO4 was based on the amount of charge passed, whereas the supplementing of NaCl was based on measurements by ‘Chloride Concentration Analyzer for Acidic Plating Solution’ from Jungdo21 Co. It should be noted that the Na+ added to the electrolyte during the replenishment can also affect the additive chemistry, though the detailed chemistry is not fully understood up to now.
2.1.2. Aging of PEG-PPG
PEG-PPG (average MW: 900 Da) was aged using electrodeposition with a current density of 40 mA/cm2 in an acidic plating solution consisting of 0.56 M CuSO4, 1.47 M H2SO4, 1.67 mM NaCl, and 1400 μM PEG-PPG. Cu foil with an active area 70 cm2 was used as the working electrode and either Ir/IrOx or Cu plates were used as counter electrodes. The volume of electrolyte in the cell was 1.5 L. The ratio of cathodic surface area per electrolyte volume was about 0.047 cm-1. The bubbler was equipped to enhance the mass transport of Cu ions, and the temperature of electrolyte was precisely controlled
40
to remain at 39 °C. Since both cupric and chloride ions were consumed during electrodeposition, these were periodically supplied every 3 hr based on the amount of charge passed and measurement done by the chloride concentration analyzer for acidic plating solutions (Jungdo21 Co.) The decomposition rate of PEG-PPG under these experimental conditions was much faster than the conventional plating cell where the protections against decomposition were well-installed.
The aging experiment comprised a series of conventional electrodeposition, measurement of PEG-PPG concentration using the DT method of CVS, and addition of an adequate supplement of fresh PEG-PPG into the electrolyte. Therefore, the concentrations of PEG-PPG in fresh and aged plating solutions were comparable, while the amount of by-products increased as the duration of aging increased. Cu electrodeposition was performed using the same conditions as described in the aforementioned experiments. The CVS was performed at 15 hr, 25 hr, and 35 hr intervals from the start of the electrodeposition for the measurement of PEG-PPG concentration.
Then, fresh PEG-PPG was supplied to the electrolyte to maintain the concentration of PEG-PPG.
The DT methods of CVS (797 VA Computrace, Metrohm) were used to determine the concentration of PEG-PPG in the electrolyte. The Pt rotating disk electrode (RDE),
41
insoluble anode, and Ag/AgCl (3 M KCl) were used as working, counter and reference electrodes, respectively. The scanning swept from 2.0 V to -0.2 V with a scan rate of 100 mV/s and a rotation of 1000 rpm. The evaluation ratio of the DT method was fixed at 0.6.
All the aforementioned parameters were previously optimized in our system.
2.1.3. Aging of full solution
Cu plating bath containing 0.25 M CuSO4, 1.0 M H2SO4, 1.0 mM NaCl, 50 μM SPS and 360 μM PEG-PPG are aged by electrodeposition at 10 mA/cm2. Cu foil with an active area 70 cm2 was used as the working electrode and either Ir/IrOx or Cu plates were used as counter electrodes. The temperature of electrolyte was precisely controlled to remain at 25 °C. Both cupric and chloride ions were periodically supplied every 30 min based on the aforementioned methods.
2.2. Effect of Breakdown Products
2.2.1. Solution extraction
42
Individual additives were extracted from the acidic plating solution through the following steps: (1) addition of 10 ppm saccharin as an internal standard for the normalization of 1H-NMR peaks; (2) neutralization of the plating solution with the addition of 8 M KOH solution; (3) addition of pure ethanol in the ratio of 4 (solution) : 6 (ethanol) to precipitate the inorganic compounds; (4) filtering and evaporation to remove the precipitator and water; and (5) dissolution of the residue in D2O. A final solution containing additives and saccharin (internal standard) was investigated using 1H and 13C- NMR (600 MHz, Bruker), MALDI-TOF (Voyager-DETM, Applied Biosystems Inc.), and GPC (HPLC UltiMate 3000 RI system, Thermo).
2.2.2. Electrochemical analysis
<Aging effect of SPS>
Cyclic voltammetry (CV) was performed in order to study the influences of SPS decomposition and the by-products from it on the electrochemical behavior of the plating solution. For CV measurements, a Cu RDE with 300 rpm rotation was used as the working electrode while the counter and the reference electrodes were the same as those used in the feature-filling experiments. The scan rate was 10 mV/s. The first cycle of scan was used to compare the electrochemical behavior of plating solution.
43
<Aging effect of PEG-PPG>
Chronoamperometry (CA) was performed in previously prepared electrolytes for clarifying the effect of aging. 35 μM SPS was additionally added to those electrolytes to investigate the competitive adsorption between SPS and PEG-PPG. The CA was carried out with a Cu RDE, 99.9 % Cu wire, and Ag/AgCl (saturated KCl) as the working, counter, and reference electrodes. The rotating speed and geometric area of RDE were 300 rpm and 0.1258 cm2, respectively. The applied potentials were fixed at -0.1 V, -0.15 V and -0.2 V for 150 s.
2.2.3. Analysis of solution performance
<Aging effect of SPS>
After aging the plating solution for 30, 60, 90, 120, and 180 min (i.e., continuous operation without supplement of SPS), analysis of the feature-filling performance was carried out at 10 mA/cm2 at 25°C. PEG–PPG (360 μM, Mw: 900) was then added to the solution as the suppressor. Patterned Cu wafers with a 55-nm-wide trench having an aspect ratio of 6 and a multilayer structure of physical vapor deposited (PVD) Cu (7.5 nm)/PVD Ta (6 nm)/PVD TaN (1.5 nm), a Cu wire (99.9% pure) and a Ag/AgCl (sat.
44
KCl) electrode were used as the working, the counter and the reference electrodes, respectively.
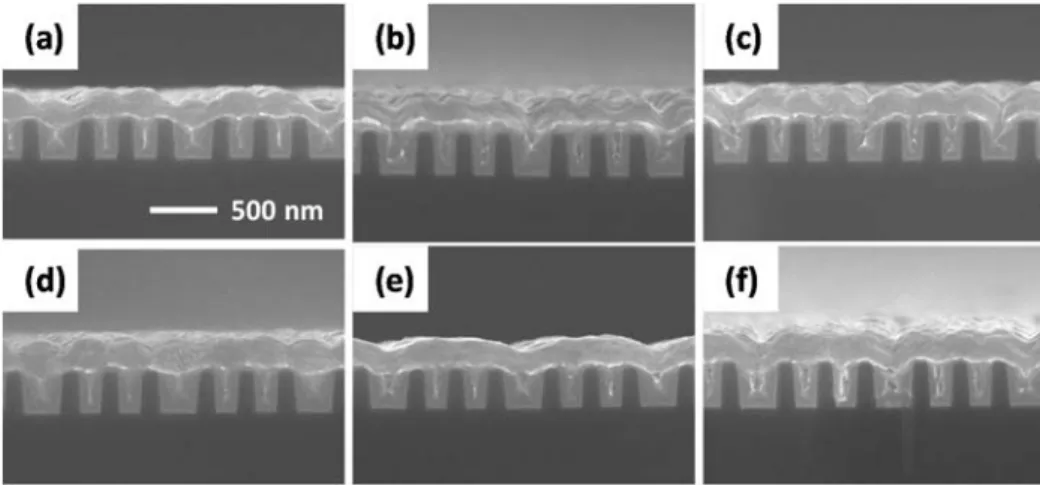
The effects of the dissociation by-product, PDS, on the properties of Cu films were studied by electrodeposition of Cu in electrolyte consisting of 0.56 M CuSO4, 1.47 M H2SO4, 1.67 mM NaCl, 360 μM PEG-PPG, 35 μM SPS, and various concentrations of PDS. Blanket Cu wafer with the structures of PVD Cu (40 nm)/PVD Ta (7 nm)/SiO2 was used as a working electrode with the same counter and reference electrodes used in the feature filling. Cu films were deposited with 10 mA/cm2 current density for 500 s. The deposited Cu films were examined by X-ray diffraction (XRD, D8-Advance, Bruker), field-emission scanning electron microscopy (FESEM, S-4800, Hitachi), four-point probe (CMT-SR1000N, Chang Min Tech.). The impurity level of Cu films was obtained by elemental analyzer (Flash EA 1112, Thermo Electron Corporation) after the deposition of Cu for 2400 s on the 10 μm-thick Cu foil. The other conditions were the same as mentioned above.
The influences of another breakdown product, MPS, was explored with a pattern filling experiment of the target solutions having different compositions of SPS and MPS.
The solution for pattern filling was composed of target solutions and 90 µM PEG (MW:
3400). Electrodeposition was carried out at room temperature with 10 mA/cm2 current
45
density. Cu pattern wafers with the structure of Cu seed (50 nm at the bottom of the trench, 15 nm at the sidewall)/Ta (30 nm at the bottom, 15 nm on the sidewall)/SiO2 were used as the working electrodes. A Cu rod (99.9% purity) and Ag/AgCl [sat. KCl]
were used as the counter and reference electrodes, respectively.
<Aging effect of PEG-PPG>
Cu films were deposited in the previously prepared electrolyte to investigate the effect of solution aging on the properties of Cu films. Blanket Cu wafers with the structures of PVD Cu (40 nm)/PVD Ta (7 nm)/SiO2 were used as working electrodes. The Cu films were deposited with a current density of 10 mA/cm2 for 500 s. The counter and reference electrodes were the same as that used in CA experiments. The deposited Cu films were examined by X-ray diffraction (XRD, D8-Advance, Bruker), field emission scanning electron microscopy (FESEM, S-4800, Hitachi), and a four point probe (CMT-SR1000N, Chang Min Tech.).
2.3. CVS Analysis
2.3.1. Electrolyte
46
Cu plating solutions, referred to as the target solution, intercept solution #1 (IS1), and intercept solution #2 (IS2), were used in this experiment. Target solutions comprised 0.25 M CuSO4, 1.0 M H2SO4, 1 mM NaCl, 0–50 µM SPS, and 0–100 µM MPS. IS1 was a base solution for conventional MLAT-CVS analysis with a composition of 0.125 M CuSO4, 0.5 M H2SO4, 1.0 mM NaCl, and 1400 µM PEG (MW: 3400). IS2 was a pH- modified IS1 consisting of 0.125 M CuSO4, 0.5 M H2SO4, 1.0 mM NaCl, 1400 µM PEG (MW: 3400), and 1.2 M KOH. The composition of IS1 was optimized for conventional MLAT-CVS, while IS2 was optimized for the two-step CVS.
2.3.2. MLAT-CVS
CVS analysis was aimed at observing the electrochemical behavior of the solutions and measuring the concentrations of accelerators. CVS plots were obtained using either IS1 or IS2 as the base electrolyte. Prior to the CVS measurement, 0–4.5 µM SPS and 0–9 µM MPS were added into IS1 or IS2. A Pt RDE with a rotating speed of 2000 rpm, a Pt rod, and Ag/AgCl (3 M KCl) were used as the working, counter, and reference electrodes, respectively. A scan rate of 0.1 V/s and a vertex potential of -0.3 V were constantly applied.
47
Conventional MLAT-CVS analysis of the SPS concentration was carried out using the following procedures: 1) evaluation of Qi from the CVS analysis of IS1 (volume of IS1:
50 mL); 2) addition of diluter (1.0 mM NaCl) into the target plating solution at a 1:1 (v/v) ratio; 3) evaluation of Q0 after addition of the diluted target solution into IS1 (addition volume: 5 mL); 4) evaluation of Q after addition of the standard SPS solution (5000 µM SPS) into IS1 (addition volume: 0.05 mL); 5) repetition of procedure 4 (3 times) to determine ∆Q/∆CS; and 6) evaluation of the SPS concentration of the target plating solution from (Q0-Qi)/(∆Q/∆CS ).Eq. 1.15.
However, our modified MLAT-CVS analysis consisted of a two-step methodology.
The first step was carried out to evaluate the total accelerators concentration with the following procedures: 1) evaluation of Qi from the CVS analysis of IS2 (volume of IS2:
50 mL), 2) addition of pH adjuster (2.4 M KOH, 1.0 mM NaCl) into the target plating solution with a 1:1 (v/v) ratio, 3) evaluation of Q0 after addition of the pH-adjusted target plating solution into IS2 (addition volume: 5 mL), 4) evaluation of Q after addition of the SPS standard solution (5000 µM SPS) into IS2 (addition volume: 0.05 mL), 5) repetition of procedure 4 (3 times) to determine ∆Q/∆CS, and 6) evaluation of the SPS concentration in the target plating solution from the value of (Q0-Qi)/(∆Q/∆CS ).
48
The second step was aimed at measuring the conversion ratio: 1) evaluation of Qi from the CVS analysis of IS1 (volume of IS1: 50 mL), 2) addition of diluter (1.0 mM NaCl) into the target plating solution with a 1:1 (v/v) ratio, 3) evaluation of Q after addition of the diluted target plating solution into IS1 (addition volume: 0.5–2 mL), 4) repetition of procedure 3 (3–5 times) to obtain the relation between Q/Qi and addition volume of the target plating solution, 5) evaluation of the slope for the calculation of (∆Q/Qi)/∆CT, where CT is the total accelerator concentration, and 6) evaluation of the conversion ratio using the pre-determined calibration curve. The conditions of all electrochemical experiments, including the electrodes, scan rate, and vertex potential, were as described above.
49 Figure 2.1. Schematic diagram of aging experiment.
50
Chapter III. Decomposition of SPS
3.1. Decomposition of SPS
SPS, a dimer of MPS, has been regarded as one of the essential components for achievement of superfilling. The role of SPS for superfilling is to accelerate the deposition rate at the trench bottom more than the deposition rate at the trench top via the CEAC mechanism described at chapter 1. Acceleration by SPS has been explained by the competitive adsorption theory11,12,54,55 or by the catalytic action caused by the reduction of cupric ions.42,84 In the competitive adsorption theory, acceleration is regarded as a recovery of the deposition rate previously suppressed by the polyethylene glycol (PEG)- Cl inhibition layer, and recovery occurs through the displacement of the PEG-Cl layer with SPS.11,12,54,55 A recent study revealed that the acceleration is a result of the dissociative adsorption of SPS with displ