저작자표시-비영리-변경금지 2.0 대한민국 이용자는 아래의 조건을 따르는 경우에 한하여 자유롭게
l 이 저작물을 복제, 배포, 전송, 전시, 공연 및 방송할 수 있습니다. 다음과 같은 조건을 따라야 합니다:
l 귀하는, 이 저작물의 재이용이나 배포의 경우, 이 저작물에 적용된 이용허락조건 을 명확하게 나타내어야 합니다.
l 저작권자로부터 별도의 허가를 받으면 이러한 조건들은 적용되지 않습니다.
저작권법에 따른 이용자의 권리는 위의 내용에 의하여 영향을 받지 않습니다. 이것은 이용허락규약(Legal Code)을 이해하기 쉽게 요약한 것입니다.
Disclaimer
저작자표시. 귀하는 원저작자를 표시하여야 합니다.
비영리. 귀하는 이 저작물을 영리 목적으로 이용할 수 없습니다.
변경금지. 귀하는 이 저작물을 개작, 변형 또는 가공할 수 없습니다.
공학석사 학위논문
A Study on the Method for the Estimation of Energy Efficiency Operational Indicator of a Ship Based on Technologies of Big Data and
Deep Learning
빅데이터와 딥러닝 기술을 기반으로 한 선박 에너지 효율 운항 지표 예측 방법에 대한 연구
2018년 2월
서울대학교 대학원 조선해양공학과
김 성 훈
Contents
Abstract ... 1
Introduction ... 3
Regulations on energy efficiency of ships ... 3
Energy Efficiency Operational Indicator (EEOI) ... 5
EEOI estimation for shipyards ... 6
EEOI estimation using public data based on technologies of big data and deep learning ... 9
Related works ... 10
Input data for EEOI estimation ... 13
Ship dynamic data ... 14
Auto Identification System (AIS) data ... 14
Ship static data ... 16
Ship and engine data ... 17
Environment data ... 18
Weather data ... 18
Format and size of input data ... 19
Data mapping for EEOI estimation ... 21
Mapping between Message 1 and Message 5 of AIS data ... 21
Mapping between AIS data and ship and engine data ... 22
Mapping between AIS data and weather data ... 22
EEOI Estimation ... 23
Overall procedure for EEOI estimation ... 24
Current correction ... 26
Total resistance and propeller efficiency estimation... 28
Total resistance and propeller efficiency estimation using Holtrop-Mennen method ... 28
Input for total resistance and propeller efficiency estimation ... 32
Total resistance and propeller efficiency estimation for EEOI estimation ... 36
Additional resistance estimation ... 37
Additional resistance estimation following ISO15016 ... 37
Input for additional resistance estimation ... 44
Additional resistance estimation for EEOI estimation ... 46
Actual engine power estimation ... 47
Actual engine power estimation using modified DPM and Holtrop-Mennen method ... 47
Input for actual engine power estimation ... 52
Actual engine power estimation for EEOI estimation ... 56
EEOI estimation ... 57
Verification of proposed method ... 58
Computation time for EEOI estimation ... 62
Big data technologies for EEOI estimation ... 64
Concept of big data ... 65
Big data technology ... 66
Hadoop ... 66
Spark ... 68
Application of big data technology for EEOI estimation ... 69
Utility of big data technology ... 71
Deep learning for EEOI estimation ... 73
Concept of surrogate model ... 74
Concept of deep learning ... 74
Overall procedure of deep learning for EEOI estimation ... 75
Application of deep learning for EEOI estimation ... 76
Computation time for EEOI estimation using surrogate model ... 80
Conclusions and future works ... 81
References ... 83
국문 초록 ... 86
Figures
Figure 1 Continuous cycle of SEEMP ... 4
Figure 2 Overall procedure for EEOI estimation ... 10
Figure 3 Input module for EEOI estimation ... 13
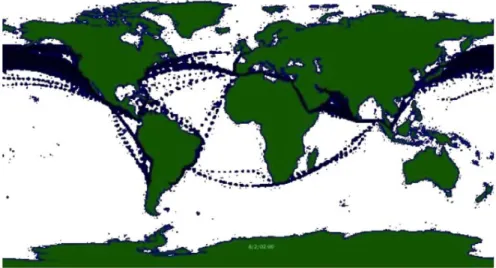
Figure 4 Coverage of container ships greater than 65,000 gross tonnages in August 2011. Black dots indicate messages received from vessel at the reported location ... 16
Figure 5 Example of part load SFOC curves for high efficiency turbochargers, valid for fuel oil and gas fuel operation, respectively ... 17
Figure 6 Mean sea level and wind speed at January. 7, 2017 provided by ECMWF ... 19
Figure 7 Observation intervals of weather data ... 22
Figure 8 EEOI estimation module for EEOI estimation ... 23
Figure 9 Overall procedure for EEOI estimation ... 25
Figure 10 Procedure for total resistance and propeller efficiency estimation ... 36
Figure 11 Wind resistance coefficient for ... 39
Figure 12 Procedure for additional resistance estimation ... 46
Figure 13 Flow chart of evaluation based on Direct Power Method ... 48
Figure 14 Procedure for actual engine power estimation ... 56
Figure 15 Procedure for Energy Efficiency Operational Indicator estimation ... 57
Figure 16 Result of EEOI estimation using data from March, 2014 to April, 2014 ... 59
Figure 17 Result of EEOI estimation using data from May, 2014 to June, 2014 ... 60
Figure 18 Result of EEOI estimation using data from July, 2014 to August, 2014 ... 60
Figure 19 Result of EEOI estimation using data from September, 2014 to October, 2014 ... 60
Figure 20 Result of EEOI estimation using data from November, 2014 to January, 2015 61 Figure 21 Big data module for EEOI estimation ... 64
Figure 22 Characteristics of big data ... 66
Figure 23 Hadoop ecosystem ... 67
Figure 24 Spark ecosystem ... 68
Figure 25. Big data platform for EEOI estimation ... 69
Figure 26 Web interface of Zeppelin ... 70
Figure 27 Comparison of computation time ... 72
Figure 28 Deep learning module for EEOI estimation ... 73
Figure 29. Procedure of deep learning for EEOI estimation ... 75
Figure 30 Training result according to epoch... 78
Figure 31 EEOI estimation result using DNN ... 79
Tables
Table 1 Carbon factors for each fuel type ... 7
Table 2 Summary of related studies and its characteristics ... 12
Table 3 Classification of information transmitted/received from AIS base station ... 15
Table 4 Contents, data type, and size of public data ... 20
Table 5 Input for total resistance and propeller efficiency estimation ... 33
Table 6 Input for additional resistance estimation ... 45
Table 7 Input for engine power estimation ... 53
Table 8 coefficients and terms of the KT and KQ polynomials for the Wageningen B-screw series for Reynolds number 2 10 6 ... 55
Table 9 Reference data for verification of proposed method ... 58
Table 10 Verification result for EEOI estimation ... 62
Table 11 Processing time for EEOI estimation ... 63
Table 12 Computation time for analysis ... 71
Table 13 Training data for deep learning ... 76
Table 14 Hyper parameter for deep learning ... 77
Table 15 Computation time for EEOI estimation ... 80
Abstract
A Study on the Method for the Estimation of Energy Efficiency Operational Indicator of a Ship Based on Technologies of Big Data and
Deep Learning
Seong-Hoon Kim Department of Naval Architecture and Ocean Engineering The Graduate School Seoul National University
In shipyards, EEOI estimation is required to compare the efficiency of ships and to check the time-varying efficiency of the ships. However, since it is difficult to obtain operating data required for EEOI estimation, it is necessary to estimate EEOI using public data such as Automatic Identification System (AIS) data, ship and engine data, and weather data.
In this study, a method for EEOI estimation using public data was proposed. In the proposed method, total resistance and propeller efficiencies are estimated using the Holtrop-Mennen method, additional resistance is estimated following the International Organization for Standardization (ISO)15016:2015, and engine power is estimated using
the modified Direct Power Method (DPM) and Holtrop-Mennen method.
Since the public data have a large capacity, big data technologies such as Hadoop and Spark were applied. The public data was stored to Hadoop, and the data was processed using Spark. Moreover, to reduce the computation time for EEOI estimation, a surrogate model constructed using deep learning was also applied.
To evaluate the effectiveness of the proposed method, it is applied to estimate EEOI of the example ship. The result shows that the method can estimate EEOI effectively and accurately.
Keywords: Automatic Identification System (AIS), Big data, Deep learning, Energy Efficiency Operational Indicator (EEOI), Hadoop, Spark, Surrogate model
Student number: 2016-21130
Introduction
Regulations on energy efficiency of ships
In 1973, as interest in the marine environmental protection increases globally, the International Maritime Organization (IMO) adopted the Prevention of Pollution from Ships (MARPOL) as requirements on pollution from chemicals, garbage, sewage, and other harmful substances. And, the MARPOL Annex VI was adopted in 1997 to deal with problems of main air pollutants contained in ship’s exhaust gas. Moreover, the MARPOL Annex VI was amended to regulate ship efficiency in 2011 (IMO, 2011).
The MARPOL Annex VI includes the concept of Energy Efficiency Design Index (EEDI) and related regulations. EEDI is an index to show the efficiency of a designed ship.
EEDI represents the amount of CO2 generated by the ship while doing one tonne-mile of transport work, and it means efficient when the value of EEDI is small. The CO2 emission is equal to the product of the engine power, Specific Fuel Oil Consumption (SFOC), and carbon factor. And, the transport work is equal to the product of the deadweight and speed of the ship. Therefore, EEDI can be represented as Equation 1.
Engine Power SFOC Carbon Factor Deadweight Speed
EEDI
Equation 1
According to the MARPOL Annex VI, EEDI shall be calculated for each new ship of 400 gross tonnage and above, and it shall be lower than required EEDI. The required EEDI also can be obtained from the MARPOL Annex VI.
The MARPOL Annex VI also includes the concept of Ship Energy Efficiency Management Plan (SEEMP) and related regulations. SEEMP is a management tool for improving the energy efficiency of a ship during its operation lifecycle. SEEMP has a continuous cycle of four steps as Figure 1; planning step, implementation step, monitoring step, and self-evaluation and improvement step. In the planning step, the current status of ship energy usage is checked, and target status is set. In the implementation step, a system for monitoring is established so that the energy efficiency measures can be evaluated. In the monitoring step, data related to the efficiency is collected and analyzed. In the self- evaluation and improvement step, the effectiveness of the implemented measures is evaluated, and improved measures are suggested.
Figure 1 Continuous cycle of SEEMP
According to the MARPOL Annex VI, SEEMP shall be kept on board for each ship of 400 gross tonnage and above. There is no specific reference for verifying SEEMP’s content, but its existence on board must be verified (IMO, 2016).
Energy Efficiency Operational Indicator (EEOI)
In the monitoring step of SEEMP, Energy Efficiency Operational Indicator (EEOI) is applied as the primary monitoring tool for energy efficiency. EEOI, similar to EEDI, represents the amount of CO2 exhausted by a ship while doing one tonne-mile of transport work, and it means efficient when the value of EEOI is small. However, EEOI represents the actual CO2 emission during each voyage while EEDI is calculated for one design condition. For EEOI calculation, the actual CO2 emission is calculated by multiplying the actual fuel consumption for each type of fuel with carbon factor of each fuel. And, the transport work is calculated by multiplying cargo mass and distance traveled of each voyage. Therefore, EEOI can be represented as Equation 2 (IMO, 2016).
arg ,
( )
F ij j i j
c o i i i
F C
EEOI m D
Equation 2In the Equation 2, i is the voyage number, j is the fuel type, Fij is the mass of consumed fuel j at voyage i, CjF is the fuel mass to CO2 mass conversion factor for fuel j, mcargo is cargo carried (tonnes) or work done (number of TEU or passengers) or gross tonnes for
passenger ships, and D is the distance in nautical miles corresponding to the cargo carried or work done.
There are no specific requirements for EEOI. However, application of EEOI is recommended by IMO, and scope of use is expanded. EEOI changes during operation as the ship’s performance changes. Therefore, EEOI enables ship owners and shipping companies to measure the efficiency of the ship in operation and to decide such as hull cleaning, decommissioning, and order for a new ship. Moreover, EEOI can be used to compare and track the efficiency of ships. In other words, it is possible to use EEOI for marketing and technical development for shipyards.
EEOI estimation for shipyards
EEOI represents the efficiency of a ship in operation. Therefore, comparing the EEOIs of two similar ships, it is possible to see which ship is more efficient in operation. By tracking the EEOI of a ship for years, it is possible to see how the efficiency of the ship changes over time. For shipyards, the information about EEOI can be used for marketing and technical development. If the EEOI of the ship is low and maintained, the information can be used to advertise. In the opposite case, it contributes to technology development for increasing efficiency of the ship.
Ship owners and shipping companies can use EEOI. However, shipyards hardly use EEOI because it is difficult to obtain the actual operating data such as actual Fuel Oil Consumption (FOC) after delivering ships. Therefore, to use EEOI for shipyards, it is necessary to estimate EEOI using public data only.
The public data available to shipyards includes ship dynamic data, ship static data, and environment data. The ship dynamic data contains position, speed, draft, and others which vary with time and condition. These data can be obtained from Auto Identification System (AIS) data. The ship static data covers principal dimensions, engine specification, and others which are unchanging over time and condition. These data can be obtained from shipyards, engine maker, and research companies. The environment data refers to information of wind, wave, current, etc.
To estimate EEOI using the public data, the values of each variable in the Equation 2, CjF
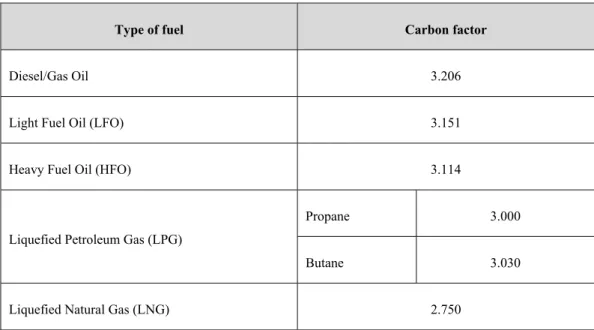
, D, mcargo, and Fij, should be estimated one by one using the public data. First, the carbon factor, CjF, is fixed value according to fuel type. The values of CjF is as follows;
Table 1 Carbon factors for each fuel type (IMO, 2014)
Type of fuel Carbon factor
Diesel/Gas Oil 3.206
Light Fuel Oil (LFO) 3.151
Heavy Fuel Oil (HFO) 3.114
Liquefied Petroleum Gas (LPG)
Propane 3.000
Butane 3.030
Liquefied Natural Gas (LNG) 2.750
The distance traveled by the ship, D can be estimated using real-time position from the ship dynamic data. The distance between two positions of a voyage can be the value of D.
The actual cargo mass, mcargo can be obtained using deadweight, design draft from the ship static data and actual draft from the ship dynamic data. The ratio of actual and design draft can be assumed to same with the ratio of actual and design cargo mass. Then, mcargo can be calculated by multiplying the ratio of draft and deadweight as Equation 3.
actual
cargo cargo,design
design
m T m
T Equation 3
In the Equation 3, Tactual is the actual draft, Tdesign is the design draft, mcargo is the actual cargo mass, and mcargo, design is the design cargo mass.
The FOC, Fij, is equal to the product of the SFOC, operation hour, and actual engine power. The SFOC can be obtained from the ship static data. The operation hour can be calculated from the travel time in the ship dynamic data. However, the actual engine power cannot be obtained from the public data. Therefore, a method to estimate actual engine power is necessary, and it is proposed in this study. In the method, the Holtrop-Mennen method (Holtrop et al., 1982) is applied to estimate total resistance, propeller efficiencies, and actual engine power. And, the methods suggested by International Organization for Standardization (ISO)15016:2015 (ISO, 2015) are modified and applied to estimate additional resistance and actual engine power.
EEOI estimation using public data based on technologies of big data and deep learning
There are two problems to estimate EEOI using the public data. First, it is difficult to use traditional data processing system such as data warehouse and statistics packages because the volume of the public data is too large. The data size of the public data for one year is about 2 Terabyte (TB). Moreover, the accumulated data size for several years reaches dozens of TB. Therefore, using the traditional data processing system may occur errors or long computation time. Second, a lot of computation power is required to estimate EEOI. The EEOI estimation procedure including the proposed method uses various inputs and has many steps. Therefore, it causes a lot of computation time and requires high- performance computers.
In this study, technologies of big data and deep learning were applied to solve the problems. For the first problem, a big data platform was constructed and used for storing and processing the public data. Therefore, it was possible to handle the large size of data fast. For the second problem, a surrogate model was constructed using deep learning. The proposed method was substituted by the surrogate model. Therefore, it was possible to skip many steps of the EEOI estimation procedure and reduce processing time.
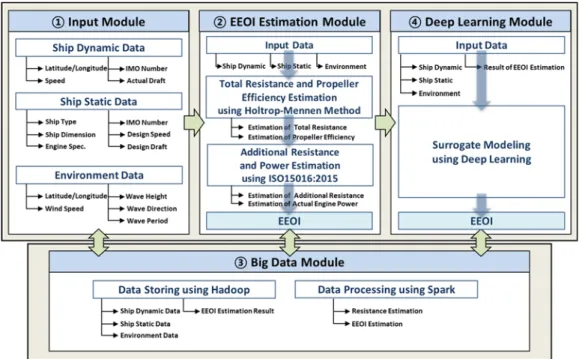
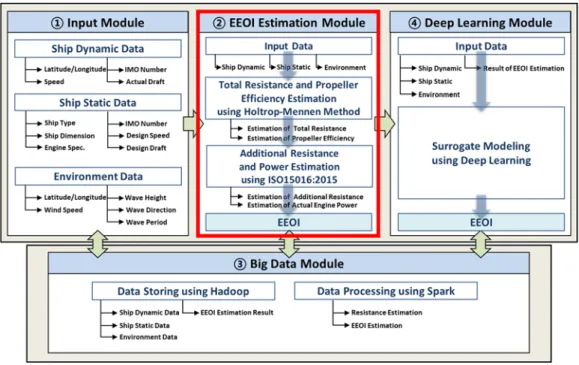
Figure 2 shows the overall procedure for EEOI estimation using the public data based on the technologies of big data and deep learning. The public data is used as input data, and EEOI is estimated following the proposed method. A surrogate model is constructed using the input data and the result of the EEOI estimation. Moreover, all procedure is performed based on big data technologies such as Hadoop and Spark. Each detail will be given later.
Figure 2 Overall procedure for EEOI estimation
Related works
As concerns and regulations on environmental protection increase, many studies related to EEOI has been done in the last few years. Even, some studies about EEOI estimation using public data also has been performed. Perez et al. (2009) estimated emission from ships. However, the emission was estimated using actual operating data, and AIS data was used only for calibration. Smith et al. (2013) suggested the method for EEOI estimation using public data. They considered loading condition, hull condition, and actual speed condition. And, the conditions were applied to the EEOI estimation as factors obtained from AIS data and ship specification. However, without taking actual marine environment into consideration, sea margin was assumed to be 15 percent. Chi et al. (2015) proposed an
AIS-based framework for real-time monitoring of ship efficiency. EEOI was estimated in real time based on position and speed from AIS data. However, actual engine power for EEOI estimation was simply assumed to have a cubic relationship with ship speed. Rakke (2016) estimated resistance and actual engine power using Holtrop-Mennen method with AIS data and ship specification. However, marine environment was not considered in the estimation. Wen et al. (2017) estimated EEOI using public data and applied it to green routing. For EEOI estimation, actual engine power is assumed to have a cubic relationship with ship speed, and ship speed was corrected considering wind speed.
As mentioned above, there are some researches about EEOI estimation using public data. Compared to the above studies, this study has several differences. First, EEOI was estimated without operating data, but only with public data. Second, marine environment such as wind, wave, and current, were considered. Third, to reduce computation time, the technologies of big data and deep learning were applied to EEOI estimation. The related studies mentioned above are summarized in Table 2 to be compared with this study.
Table 2 Summary of related studies and its characteristics
Related works
Objective of
Research Input Data Environment Impact
Big Data
Deep Learning
Perez et al.
(2009) Estimating emission AIS, actual operating data
Using
operating data X X
Smith et al.
(2013) Estimating EEOI AIS,
ship and engine data Assuming sea
margin as 10~15% X X
Chi et al.
(2015)
Real-time monitoring of vessel efficiency
AIS,
actual operating data Using
operating data X X
Rakke (2016)
Estimating emission using Holtrop-Mennen
method
AIS, world fleet, ship and engine data
Assuming sea
margin as 15% X X
Wen et al.
(2017) Green routing to minimize EEOI
AIS, ship and engine,
weather data
Speed correction
using wind speed X X
This study
Estimating EEOI based on big data and deep learning
AIS, ship and engine,
weather data
Estimating additional resistance
O O
Input data for EEOI estimation
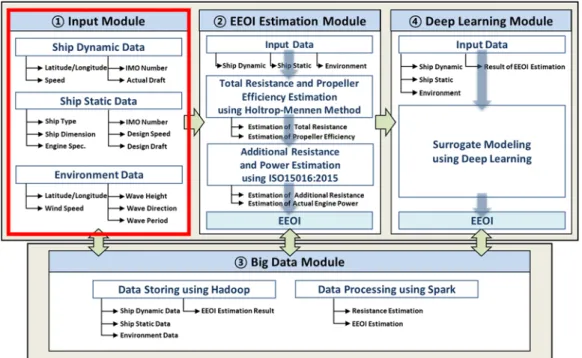
Figure 3 Input module for EEOI estimation
As shown in the Figure 3, the public data was used as input data for EEOI estimation.
This chapter describes the input data for EEOI estimation; the ship dynamic data, ship static data, and environment data.
Ship dynamic data
The ship dynamic data refers the information that changes over time. A Ship travels at different speed and direction over time, and position of the ship changes in real time.
Moreover, draft changes depending on loading condition. All these information is included in the ship dynamic data.
Auto Identification System (AIS) data
In the International Convention for the Safety of Life at Sea (SOLAS) Chapter V, regulations relating to AIS were adopted. Due to the regulations, all ship of 300 gross tonnage and upwards shall carry AIS capable of providing information about the ship to other and coastal authorities automatically (IMO, 2002).
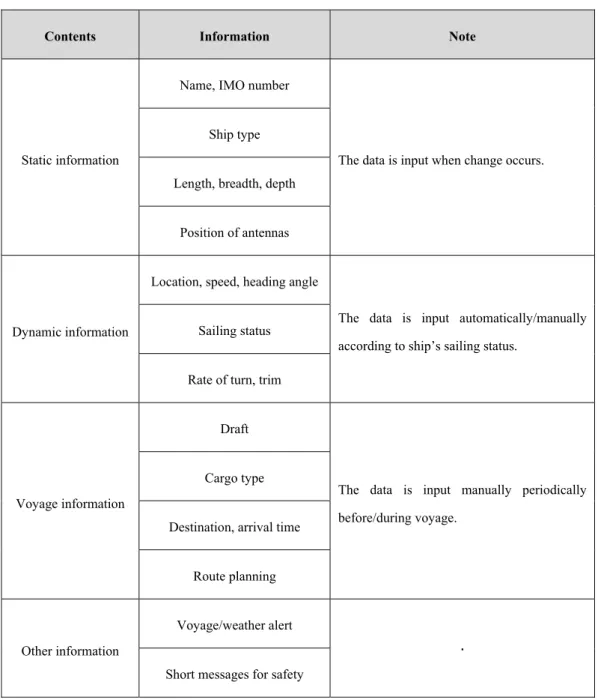
The ship dynamic data is obtained from AIS data. AIS is a system that automatically transmits ship operational data. It provides complementary means in the event of a marine accident, and it is used for monitoring operation of ships. AIS sends 27 kinds of messages to satellites which are called Message 1 to 27. The information obtained from the messages is shown in Table 3. And, Figure 4 shows an example of location information for container ships larger than 65,000 gross tonnages, collected using AIS data.
Table 3 Classification of information transmitted/received from AIS base station (Park, 2015)
Contents Information Note
Static information
Name, IMO number
The data is input when change occurs.
Ship type
Length, breadth, depth
Position of antennas
Dynamic information
Location, speed, heading angle
The data is input automatically/manually according to ship’s sailing status.
Sailing status
Rate of turn, trim
Voyage information
Draft
The data is input manually periodically before/during voyage.
Cargo type
Destination, arrival time
Route planning
Other information
Voyage/weather alert
· Short messages for safety
Figure 4 Coverage of container ships greater than 65,000 gross tonnages in August 2011. Black dots indicate messages received from vessel at the reported location (Smith, 2013)
In this study, the Message 1 and 5 were used for the EEOI estimation. The Message 1 includes Maritime Mobile Service Identity (MMSI), time, location, heading angle, speed over ground, etc. And, the Message 5 includes MMSI, International Maritime Organization (IMO) number, time, actual draft, etc.
Ship static data
The ship static data refers the information which are unchanging over time and condition.
Basic information of a ship such as name, type, flag, class does not change once it is set.
Principal dimensions which includes length, breadth, depth, deadweight, etc. also do not change after the ship is built. Moreover, engine specification is determined by the engine installed on the ship. All these information is included in the ship static data.
Ship and engine data
In this study, ship and engine data is defined as the ship static data for EEOI estimation.
The ship and engine data includes basic ship information, principal dimensions, and engine specification. And, it is obtained from shipyards, engine maker, and research companies.
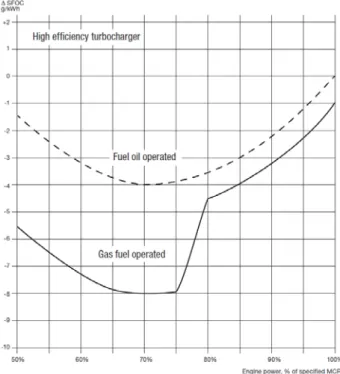
In this study, the ship and engine data were collected from several sources. And, principal dimensions such as length, breadth, depth, design draft, design speed, etc., and engine specification such as Nominal Maximum Continuous Rating (NMCR), Specific Fuel Oil Consumption (SFOC), etc. were used for the EEOI estimation. Figure 5 shows SFOC curves which is an example for the ship and engine data.
Figure 5 Example of part load SFOC curves for high efficiency turbochargers, valid for fuel oil and gas fuel operation, respectively (MAN B&W, 2014)
Environment data
To estimate actual engine power of a ship, additional resistance acting on the ship must be estimated. For the additional resistance estimation, the environment data of ship’s location is required. The environment data includes sea state such as wave and current, and weather condition such as temperature and wind.
Weather data
In this study, weather data is defined as the environment data for EEOI estimation. The weather data includes information of wind, wave, current, etc. And, it is obtained from the European Centre for Medium-Range Weather Forecasts (ECMWF) and National Oceanic and Atmospheric Administration (NOAA)
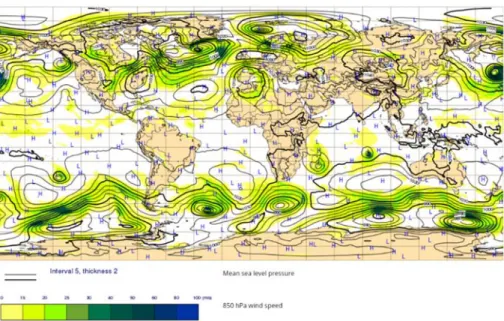
The ECMWF is an independent intergovernmental organization supported by 34 European countries which observes and forecasts weather. And, the NOAA is an American scientific agency which focuses on conditions of oceans and atmosphere. They store collected weather data and provide some of them to the public. Figure 6 shows an example of the weather data provided by ECMWF.
Figure 6 Mean sea level and wind speed at January. 7, 2017 provided by ECMWF
In this study, the weather data about wind, wave, and current was gathered from the ECMWF and NOAA. The weather data about wind includes wind speed and direction. The weather data about wave includes significant wave height, mean wave direction, and mean wave period. And, the weather data about current includes current speed and direction.
Format and size of input data
To apply the public data to EEOI estimation, it is important to check data type and size of the public data and determine appropriate data processing method. In this study, the AIS data and ship and engine data were pre-processed and used as data type of Comma- Separated Values (CSV). Moreover, size of the one-year data for 5,500 ships is almost 150
Gigabytes (GB). In case of the weather data, it is stored in the form of Network Common Data Form (NetCDF) which is generally used for environment data, and its size is almost 1.2 Terabytes (TB) for one year. Contents in detail, data type, and size of the public data mentioned above are summarized in Table 4.
Table 4 Contents, data type, and size of public data
AIS data Ship and engine data Weather data
Contents
Message 1 - Time - MMSI
- Latitude / Longitude - Course over ground - Speed over ground - Heading angle
- IMO number - Ship type - Year built
- Length / Beam / Depth - Design draft
- Design speed - Specification for main
engine
- Specification for auxiliary engine - Cargo capacity
- Time
- Latitude / Longitude - Wind speed - Wind direction - Significant wave height - Mean wave direction - Mean wave period - Current speed - Current direction Message 5
- Time - MMSI - IMO number
- Departure / Destination - Actual Draft
Data
type CSV CSV NetCDF
Size 150 GB
(for 5,500 ships and 1 year)
20 Megabytes (MB) (for 5,500 ships)
1.2 TB (for 1 year)
Data mapping for EEOI estimation
All the information required for the EEOI estimation is included in the input data.
However, the input data is not stored in a single file, and the scale of the time and location of each input data is not exactly same. Therefore, to use the input data for the EEOI estimation, it is required for mapping each input data. In this study, the input data is mapped based on the Message 1 in the AIS data.
Mapping between Message 1 and Message 5 of AIS data
In order to map the Message 1 and 5, it is necessary to find information of a specific ship in the AIS data. All ships have an MMSI, which is an identification number used for satellite communications. And, MMSI is included in the Message 1 and 5. Therefore, in this study, MMSI in the Message 1 was used to map information in the Message 1 and 5.
Additionally, it is also required to find information of the Message 1 and 5 at the same time. The time scales of the Message 1 and 5 are not constant because they are recorded when there is a change of the ship status. And, it is almost impossible to find information of the Message 1 and 5 at the exactly same time. Therefore, in this study, information of the Message 5 which is measured at the nearest time to information of the Message 1 was used. And, information of the Message 1 was not used if there is no information of Message 5 which has smaller time difference than one hour. It is due to the assumption that the draft in the Message 5 does not change drastically within a short hour.
Mapping between AIS data and ship and engine data
In order to map the AIS data and ship and engine data, it is necessary to find the information of a specific ship in the ship and engine data. All ships have an IMO number under regulation of SOLAS (IMO, 1996). And, the Message 5 of the AIS data and the ship and engine data include IMO numbers. Therefore, in this study, the IMO number of the Message 5 is used to retrieve ship information from the ship and engine data.
Mapping between AIS data and weather data
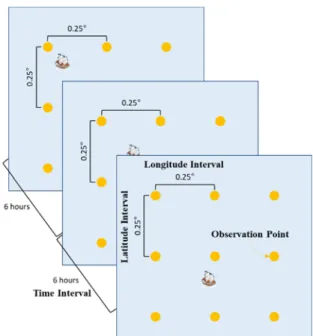
As shown in Figure 7, the weather data is observed at 0.25° intervals of latitude and longitude. And the time interval of observation is 6 hours.
Figure 7 Observation intervals of weather data
Therefore, it is not possible to fully map the AIS data and weather data. In this study, the weather data which has the closest time and location with the AIS data was used. To map between the two data, latitude, longitude, and time information was taken from the Message 1 of the AIS data. Then, the values obtained were compared with the values in the weather data. And, information in the weather data with the nearest values was used for the EEOI estimation.
EEOI Estimation
Figure 8 EEOI estimation module for EEOI estimation
As shown in the Figure 8, the proposed method was used for EEOI estimation. This chapter describes the proposed method for EEOI estimation and examines applicability.
The proposed method includes speed correction for current, total resistance and propeller efficiency estimation, and additional resistance and actual engine power estimation. The proposed method was applied to data of a reference ship for verification.
Overall procedure for EEOI estimation
As mentioned, EEOI can be calculated using FOC, carbon factor, cargo mass, and distance. Since FOC is not provided to the public, the most important process is to estimate FOC for EEOI estimation. Moreover, actual engine power is a key factor for estimation because FOC can be calculated with actual engine power, SFOC, and operating hour.
Actual engine power can be estimated from resistance acting on a ship and propeller efficiencies. In this study, the resistance was divided into total resistance due to shape and movement of the ship, and additional resistance due to environment condition.
For the EEOI estimation, the total resistance was estimated using the Holtrop-Mennen method. And, the additional resistance was obtained following the ISO15016:2015. Then, the actual engine power was estimated using the Holtrop-Mennen method and modified Direct Power Method (DPM) in the ISO15016:2015.
Figure 9 Overall procedure for EEOI estimation
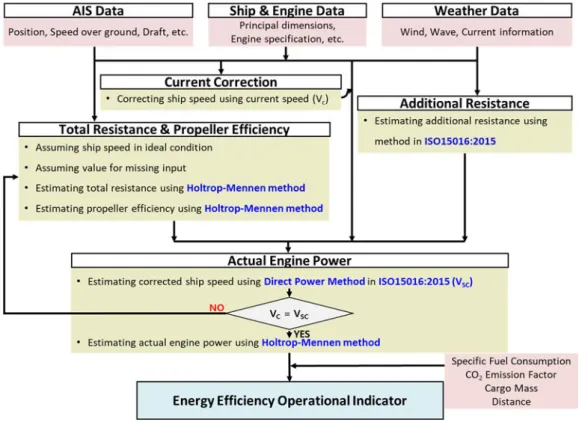
The detailed procedure for EEOI estimation is shown in the Figure 9. The AIS, ship and engine, and weather data is used as input data. Current speed is removed directly from speed over ground. Using the input data and assumed ship speed in ideal condition, total resistance and propeller efficiencies are estimated. And, additional resistance is estimated following the ISO15016:2015. Then, the ship speed in ideal condition is corrected following and modifying the Direct Power Method (DPM) in the ISO15016:2015. In the DPM, the estimated total resistance, propeller efficiencies, and additional resistance are used, and speed changed by the weather condition is derived. The speed obtained by the DPM is compared to the ship speed corrected using the current speed. If they are different,
the ship speed in ideal condition is changed and total resistance and propeller efficiencies are estimated again. When they have same value, actual engine power is estimated using the assumed ship speed in ideal condition with the Holtrop-Mennen method. In other words, if the ship uses the estimated engine power, it travels at the assumed speed in ideal condition, and corrected speed using the DPM in actual environment condition. Lastly, after the actual engine power is estimated, EEOI is calculated using SFOC, CO2 emission factor, cargo mass, and distance.
Current correction
The AIS data includes speed over ground. It is not possible to estimate actual engine power using speed over ground directly because a ship is affected by current. Therefore, speed over ground was corrected using current speed in this study. For the speed correction, speed over ground and heading angle in the AIS data and u and v components of current velocity in the weather data were used. In this study, u is velocity in the east direction and v is velocity in the north direction.
The corrected speed was calculated as sum of the velocities of the ship and current. The u and v components of the ship were obtained using the speed over ground and heading angle. Since the heading angle in the north direction is 0, the components were obtained by Equation 4 and Equation 5.
Ship Speed sin(Heading Angle)
uship Equation 4
Ship Speed cos(Heading Angle)
vship Equation 5
In the Equation 4 and Equation 5, uship and vship are the u component and v component of the ship velocity.
Then, the corrected speed of the ship was calculated by Equation 6
2 2
( ) ( )
C ship current ship current
V u u v v Equation 6
In the Equation 6, VC is the speed corrected using the current speed, and ucurrent and vcurrent
are the u component and v component of the current velocity.
Total resistance and propeller efficiency estimation
In this study, the total resistance and propeller efficiencies were estimated for the EEOI estimation. And, the Holtrop-Mennen method was used for the estimation. Almost of the inputs required to use the Holtrop-Mennen method were obtained from the AIS data and ship and engine data. And, the missing information was estimated using assumptions of other studies.
Total resistance and propeller efficiency estimation using Holtrop-Mennen method
The Holtrop-Mennen method provides formulas for estimating resistance and propeller efficiencies which are derived by regression analysis based on model test. In this method, total resistance of a ship is divided into six components; frictional resistance, appendage resistance, wave resistance, additional pressure resistance of bulbous bow near the water surface, additional pressure resistance due to immersed transom immersion, and model- ship correlation resistance. And, it can be expressed as Equation 7.
(1
1)
T F APP W B TR A
R R k R R R R R
Equation 7In the Equation 7, RT is the total resistance, RF is the frictional resistance, k1 is the form factor of the hull, RAPP is the appendage resistance, RW is the wave resistance, RB is the additional pressure resistance of bulbous bow near the water surface, RTR is the additional pressure resistance due to immersed transom immersion, and RA is the model-ship correlation resistance.
And, formulas for each component are provided as Equation 8 to Equation 14.
1/ 2 2
F F bh
R V C S Equation 8
In the Equation 8,
is the density of the sea, V is the ship speed, CF is the coefficient of frictional resistance, and Sbh is the wetted surface area of the bare hull1.06806 0.46106
1 14
0.121563 3 0.36486 0.60247
1 0.93 0.487118 ( / ) ( / )
( / R) ( / ) (1 P)
k C B L T L
L L L C
Equation 9
In the Equation 9, C14 is the prismatic coefficient based on the waterline length, B is the breadth of the ship, L is the waterline length, T is the draft of the ship, LR is the length of run, is the displacement volume of the ship, and CP is the prismatic coefficient of the ship.
2
1/ 2 (1 2)
APP APP Eq F
R
V S k C Equation 10In the Equation 10, SAPP is the wetted area of the appendages, and k2 is the appendage resistance factor.
2
1 2 5exp{ 1 d 4cos( )}
RW
g C C C m Fr m
Fr Equation 11In the Equation 11, g is the gravitational acceleration, Fr is the Froude number, and the other variables are coefficient for wave resistance.
( 3 2) 3 1.5 2
0.11 PB / (1 )
B BT i
R e Fr A
g Fr Equation 12In the Equation 12, PB is the measure for the emergence of the bow, ABT is the cross- sectional area at the fore perpendicular, and Fri is the Froude number based on immersion of bulbous bow.
2
1/ 2 6
TR T
R
V A C Equation 13In the Equation 13, AT is the transom area under the waterline, and C6 is the coefficient for additional pressure resistance of immersed transom immersion.
1/ 2 2
A Total A
R
V S C Equation 14In the Equation 14, Stotal is the total wetted area of the ship, and CA is the coefficient for model-ship correlation resistance.
Also, in the Holtrop-Mennen method, formulas for propeller efficiencies such as relative rotative efficiency and hull efficiency are provided as Equation 15 and Equation 16
0.9922 0.05908 / 0.07424( 0.0225 )
R AE AO CP LCB
Equation 15
In the Equation 15, R is the relative rotative efficiency, AE/AO is the propeller expanded area ratio, and LCB is the longitudinal center of buoyancy.
1 , 1
H
t
w
Equation 16
In the Equation 16, H is the hull efficiency, t is the thrust deduction fraction, and w is the wake fraction.
Moreover, the Holtrop-Mennen method provides detailed formulas for estimating each coefficient and variables in the formulas above. However, the detailed formulas are omitted in this study.
Input for total resistance and propeller efficiency estimation
In this study, the total resistance and propeller efficiencies were estimated using the AIS and ship and engine data with the Holtrop-Mennen method. For using the Holtrop-Mennen method, a lot of inputs are required. For example, ship principal dimensions such as length, breadth, depth, and design draft, engine specification such as Maximum Continuous Rating (MCR) and engine revolution per second at MCR, ship operational condition such as actual draft are used. Almost of the inputs can be obtained from the AIS and ship and engine data.
However, there are some inputs that cannot be obtained from the data. Table 5 shows the inputs and data source.
Table 5 Input for total resistance and propeller efficiency estimation
Data Source Input
Common information g, sea, air, sea
AIS data Tactual
Ship and engine data LBP, B, Vdesign, Tdesign, D, DWT, MCR, nMCR
Missing information LWL, CB, CM, CWP, LCB, ABTt, AT
In the Table 5, air is the density of air, sea is the kinematic viscosity of sea water, Tactual is the actual draft of the ship, LBP is the Length Between Perpendiculars, B is the breadth, Tdesign is the design draft, D is the depth of the ship, DWT is the deadweight, nMCR
is the engine revolution per second, LWL is the Load Waterline Length, CB is the block coefficient, CM is the midship section coefficient, CWP is the water plane coefficient, and AM is the midship section area.
In the Table 5, the common information and the missing information cannot be obtained from the AIS and ship and engine data. Therefore, in this study, the common information was assumed to have constant value. The gravitational acceleration, g, is 9.8 m/s2, the density of the sea, sea, is 1.025 ton/m3, the density of the air, air, is 0.0012 ton/m3, and the kinematic viscosity, sea, is 0.00000118 m2/s.
Moreover, the missing information was estimated using AIS and ship and engine data, referring to related studies. The formulas used to estimate the missing information are explained below.
LWL
The Load Waterline Length, LWL, was estimated using LBP in the ship and engine data following Equation 17 (Smith et al, 2013).
/ 0.97
LWLLBP Equation 17
CB, CM, and CWP
The block coefficient, CB, was assumed to have a relationship with the Froude number as Equation 18 (Jensen, 1994).
4.22 27.8 39.1 46.6 3
CB Fr Fr Fr Equation 18
The midship section coefficient, CM, was assumed to be relevant to the block coefficient as Equation 19, (Benford, 1963)
0.977 0.085 ( 0.60)
M B
C C Equation 19
The water plane coefficient, CWP, was also assumed to have a relationship with the block coefficient as Equation 20, (Schneekluth, 1987)
(1.0 2.0 ) / 3.0
WP B
C C Equation 20
Abt, and At
The cross-sectional area at the fore perpendicular, ABT, was assumed to 8 percent of the midship section area, AM as Equation 21 (Charchalis, 2013).
BT 0.08 M
A A Equation 21
And, the transom area under the waterline, AT, was also assumed to relevant to the midship section area as Equation 22 (Rakke, 2016).
0.051
T M
A A Equation 22
Total resistance and propeller efficiency estimation for EEOI estimation
Figure 10 Procedure for total resistance and propeller efficiency estimation
Figure 10 shows the procedure for total resistance and propeller efficiency estimation which is described above. In this study, for the EEOI estimation, ship speed in ideal condition was assumed, and total resistance and propeller efficiencies were estimated
following the procedure. The estimated total resistance and propeller efficiencies were used in the DPM to be explained later.
Additional resistance estimation
In this study, additional resistance was estimated for the EEOI estimation. And, procedure for the estimation was performed following the ISO15016:2015. All inputs required for following the ISO10516:2015 were obtained from the AIS data, ship and engine data, and weather data. Moreover, the estimated information in the procedure for total resistance and propeller efficiency estimation was also used.
Additional resistance estimation following ISO15016
The ISO15016:2015 is a proposed international standard whose purpose is to estimate a ship performance within calm water. The ship performance can be estimated by excluding external effects caused by weather on measured performance in trial test. And, the ISO15016:2015 provides methods for estimating additional resistance to measure the effect of the weather.
In the ISO15016:2015, as Equation 23, additional resistance is divided into three components; resistance due to wind, resistance due to wave, and resistance due to water temperature and density.
AA AW AS
R R R R
Equation 23
In the Equation 23, R is the total increased amount of resistance, RAA is the resistance increase due to relative wind, RAW is the resistance increase due to wave, and RAS is the resistance increase due to water temperature and density.
Method and formulas for calculating each resistance are explained below. However, the resistance due to water temperature and density is omitted because of its small value.
Resistance due to wind
In the ISO15016:2015, the resistance due to wind is calculated by:
2 2
0.5 ( ) 0.5 (0)
AA air AA WRref XV WRef air AA XV G
R
C
A V
C A V Equation 24In the Equation 24, CAA is the wind resistance coefficient; CAA(0) means the wind resistance coefficient in head wind, WRef is the relative wind direction at the reference height, AXV is the transverse projected area above the waterline including superstructures, VWRef is the relative wind velocity at the reference height, and VG is the measured ship’s speed over ground.
In the ISO15016:2015, the data set of the wind resistance coefficient, CAA, is provided.
Figure 11 shows as an example for LNG carrier where CAA = -CX. Moreover, other inputs in the Equation 24 can be obtained from the public data.
Figure 11 Wind resistance coefficient for
Resistance due to wave
There are four methods for estimating resistance due to wave; STAWAVE-I, STAWAVE-II, theoretical method with simplified tank test with short waves, and seakeeping model tests. In this study, the resistance due to wind was estimated using the STAWAVE-I and STAWAVE-II. The STAWAVE-II was used basically, and the STAWAVE-I was used when restrictions of the STAWAVE-II were violated. The formulas and the restrictions are as follows;
STAWAVE-II
In the STAWAVE-II, as Equation 25, the resistance due to wave is divided into two components; motion induced resistance and mean resistance due to wave reflection.
AW AWML AWRL
R R R Equation 25
In the Equation 25, RAWML is the motion induced resistance, and RAWRL is the mean resistance due to wave reflection. And, the formulas for each component are as follow;
2
4 2 ( )
AWML sea A aw
R g B r
LBP
Equation 26
2 1
1 ( )
AWRL 2 sea A
R g B Equation 27
In the Equation 26 and Equation 27, A is the wave amplitude. raw( ) and 1( ) are the function of which are explained in detail in the ISO15016:2015.
Moreover, the STAWAVE-II is applicable to the mean resistance increase in long crested irregular head waves as Equation 28.
0 2
( ; )
2 AW G ( )
AWL
A
R V
R
S
d
Equation 28In the Equation 28, RAWL, is the mean resistance increase in long crested irregular waves, as substitute RAW, and S is the frequency spectrum for wind waves modified Pierson- Moskowitz type.
The STAWAVE-II is available under following conditions;
75( )m LBP Equation 29
4.0 LBP 9.0
B Equation 30
2.2 B 9.0
T Equation 31
0.1Fr0.3 Equation 32
0.5Cb 0.9 Equation 33
wave direction 45 Equation 34
In the Equation 34, wave direction is assumed to zero when wave comes from ahead to a ship. Moreover, wave direction has positive values on the starboard side of the ship and negative values on the port side.
In this study, the STAWAVE-II was used for estimating resistance due to wave basically, and the STAWAVE-I was used when the conditions of the Equation 29 to Equation 33 were violated. For the condition of the Equation 34, a factor calibrating the resistance due to wave was applied as Equation 35.
,
AWL corrected wave AWL
R factor R Equation 35
In the Equation 35, RAWL,corrected is the resistance due to wind corrected by the factor, and factorwave is the factor for calibrating the resistance due to wind.
The factor was created using actual data from a container ship of 4,600 Twenty-foot Equivalent Unit (TEU). And, the factor is a function of wave direction as Equation 36.
1.0148 0.0001 wave direction
factorwave Equation 36
STAWAVE-I
In the STAWAVE-I, the resistance due to wave is expressed as Equation 37.
2 1/3
1
AWL 16 sea
BWL
R gH B B
L
Equation 37
In the Equation 37, H1/3 is the significant wave height, and LBWL is the distance of the bow to 95 % of maximum breadth on the waterline.
And, the STAWAVE-I is available under following conditions;
1/3 2.25 /100
H LBP Equation 38
Vertical acceleration at bow 0.05g Equation 39
wave direction 45 Equation 40
In this study, if the STAWAVE-I was to be used, the conditions of the Equation 38 and Equation 39 were checked. And, EEOI estimation was not performed when the conditions were violated. For the condition of the Equation 40, the factor in the Equation 36 also applied to the resistance due to wave.
Input for additional resistance estimation
In this study, the additional resistance estimated following ISO15016:2015 using the public data and the estimated information in the total resistance and propeller efficiency estimation. For following the ISO10516:2015, a lot of inputs are required. For example, ship principal dimension such as length, breadth, depth, and design draft, ship operational condition such as speed over ground and design draft, weather information such as wind speed and direction are used. Table 6 shows the inputs and data source.
Table 6 Input for additional resistance estimation
Data Source Input
Common information g, sea, air, sea
AIS data VG, Tactual
Ship and engine data LBP, B, Vdesign, Tdesign, D, DWT
Weather data uwind, vwind, H1/3, Wave direction, Twave
Estimated information LWL, CB, CM
In the Table 6, uwind is the wind velocity to the East, vwind is the wind velocity to the North, and, Twave is the mean wave period.
Additional resistance estimation for EEOI estimation
Figure 12 Procedure for additional resistance estimation
Figure 12 shows the procedure for additional resistance estimation which is described above. In this study, additional resistance was estimated following the procedure for the EEOI estimation. The estimated additional resistance was used in the DPM to be explained later.
Actual engine power estimation
In this study, actual engine power was estimated for EEOI estimation. The DPM was modified and applied to estimate speed changed by the weather, and the Holtrop-Mennen method was applied to estimate actual engine power. Almost of the inputs required for the engine power estimation were obtained from the AIS data, and ship and engine data.
Moreover, the result of the total resistance, propeller efficiencies, and additional resistance estimation were also used.
Actual engine power estimation using modified DPM and Holtrop-Mennen method
In the ISO15016:2015, engine power in ideal condition is estimated using the DPM.
The DPM estimates the engine power in ideal condition by removing the effects of environment condition from the measured engine power following procedure shown in Figure 13.
Figure 13 Flow chart of evaluation based on Direct Power Method (ISO, 2015)
In the Figure 13, O is the propeller efficiency in open water, D is the propulsive efficiency, PD is the delivered power, KT is the thrust coefficient, KQ is the torque coefficient, n is the propeller revolution per second, VA is the speed of advance, J is the propeller advance ratio, P is the load factor, aT, bT, and cT are the factors for the thrust coefficient curve, aQ, bQ, and cQ are the factors for the thrust coefficient curve and ‘id’ and ‘ms’
subscripted below mean ideal condition and trial condition respectively.
However, in this study, there was no measured power data, and the purpose was to estimate actual engine power under the environment condition. Therefore, the procedure of the DPM was modified in reverse order and the Holtrop-Mennen method was applied to estimate actual engine power. In the estimation procedure, ship speed in ideal condition is assumed, and total resistance, propeller efficiencies, and additional resistance in ideal condition are used as inputs. Load factor is calculated by taking into consideration environment condition. Then, propeller advance ratio is calculated using the load factor.
And, corrected ship speed is calculated using the propeller efficiencies. Lastly, actual engine power is calculated following the Holtrop-Mennen method when the corrected ship speed is equal to the ship speed corrected by current.
To explain the procedure in detail, the propeller advance ratio in ideal condition is first obtained using Equation 41.
0
(1 )
id P
V w
J n D
Equation 41
In the Equation 41, Vid is the assumed ship speed in ideal condition, and J0 is the propeller advance ratio in ideal condition.
Then, factors for the thrust and torque coefficient curve are obtained by fitting to quadratic equations as Equation 42 and Equation 43.
2
,0 0 0
T T T T
K a J b J c Equation 42
2
,0 0 0
Q Q Q Q
K a J b J c Equation 43
In the Equation 42 and Equation 43, KT,0 is the torque coefficient for ideal condition, and KQ,0 is the torque coefficient for ideal condition.
The load factor for operating condition considering weather is estimated using Equation 44.
2 2 2
(1 )(1 )
T op
sea id P
R R
t w V D
Equation 44
In the Equation 44, op is the load factor for operating condition.
And, propeller advance coefficient for operating condition is calculated with the load factor and factors for the thrust and torque coefficient curve using Equation 45.