저작자표시-비영리-변경금지 2.0 대한민국 이용자는 아래의 조건을 따르는 경우에 한하여 자유롭게
l 이 저작물을 복제, 배포, 전송, 전시, 공연 및 방송할 수 있습니다. 다음과 같은 조건을 따라야 합니다:
l 귀하는, 이 저작물의 재이용이나 배포의 경우, 이 저작물에 적용된 이용허락조건 을 명확하게 나타내어야 합니다.
l 저작권자로부터 별도의 허가를 받으면 이러한 조건들은 적용되지 않습니다.
저작권법에 따른 이용자의 권리는 위의 내용에 의하여 영향을 받지 않습니다. 이것은 이용허락규약(Legal Code)을 이해하기 쉽게 요약한 것입니다.
Disclaimer
저작자표시. 귀하는 원저작자를 표시하여야 합니다.
비영리. 귀하는 이 저작물을 영리 목적으로 이용할 수 없습니다.
변경금지. 귀하는 이 저작물을 개작, 변형 또는 가공할 수 없습니다.
이학박사학위논문
Ecological and molecular biological responses of Aristolochia contorta to
herbivory stress
초식 스트레스에 대한 쥐방울덩굴의 생태학적∙분자생물학적 반응
2021년 2월
서울대학교 대학원 과학교육과 생물전공
남 보 은
Abstract
Aristolochia contorta (Aristolochiaceae) is herbal vine species, which has the distinctive secondary metabolites of family Aristolochiaceae and the specialist herbivore Sericinus montela (swallowtail butterfly). To enhance the sustainability of co-existence of A. contorta and S. montela, interaction between the two species should be studied. To assess the response of A. contorta to the herbivory, I studied the ecological and molecular-biological aspects of A. contorta under the herbivory stress.
First, I assessed genetic diversity of A. contorta populations to understand the long-term sustainability of A. contorta population. Genomic DNA samples of A.
contorta leaf were used for analysis from four populations (CJ, GP, PT, and YJ) where the vigorous growth was observed in the South Korea. Intra-population genetic diversity and inter-population genetic distance were assessed using randomly amplified polymorphic DNA (RAPD). Overall intra-population genetic diversity was lower, compared to the other riparian plant species (h: 0.0607 ~ 0.1401; I: 0.0819
~ 0.1759). Despite of the geographical distance, population GP showed the larger genetic distance from other populations. This result seemed to be caused by the fragmented habitat and lower sexual reproduction of A. controta.
Secondly, I performed the mesocosm experiment to assess the phenotypic plasticity of A. contorta under the herbivory stress. Physical damage on the young leaf or mature leaf was applied to one-year-old A. contorta seedlings under two light availability conditions (daylight and shade condition). Light availability significantly affected the most of the morphological characteristics. Leaf damage seemed to induce the emergence of branch and new leaf. Biomass production also increased under leaf damage treatment. Compensatory growth effect of leaf, shoot,
and biomass production seemed to be stronger when young leaves were damaged rather than mature leaves. The higher phenotypic plasticity to leaf damage was observed under the daylight treatment. These results indicate that A. contorta could show the vigorous growth under the moderate leaf damage stress with sufficient light.
Subsequently, I tried to assess the transcriptomic response of the A. contorta under herbivory stress by de novo transcriptome assembly. Transcriptome of the A.
contorta leaves under control, simple wounding (W+DW), and simulated herbivory with oral secretion of S. montela (W+OS) treatment were compared. In addition, systemic response was also assessed from the upper leaves (systemic leaf). Total 92,323 contigs were filtered, and 28,231 contigs could be annotated under Gene Ontology (GO) database. Over half of the total DEGs (1,875 of 3,177 contigs) differentially expressed only by W+OS treatment. Secondary cell wall seemed to be reinforced under both W+DW and W+OS treatments from the cell wall related terms and lignin biosynthesis pathway. Both W+DW and W+OS treatments seemed to trigger the reactive oxygen species (ROS), ethylene, and jasmonic acid related signaling pathway. Contigs which are predicted to be involved in general herbivory response such as polyphenol oxidase, chitinase, MYB transcription factors, and jasmonate O-methyltransferase were up-regulated under W+OS treatment.
Biosynthesis of some secondary metabolites including alkaloids were predicted to be induced by herbivory, which could affect the generalist herbivores rather than the specialist herbivores. However, specific secondary metabolite biosynthesis of Aristolochia such as aristolochic acids seemed to be not induced by herbivory. This results suggest the major defense mechanism against specialist herbivore of basal angiosperms could be similar to the previously studied eudicots.
From my study, A. contorta seemed to be able to co-exist with the specialist
herbivore S. montela even under the herbivory stress with the compensatory growth and defense mechanism. On the other hand, genetic diversity of A. contorta population was relatively low. To enhance the sustainability of the co-existence of S.
montela and A. contorta, proper environmental condition should be provided.
Results from this study could contribute to the integrative understanding of plant response to herbivory as well as the conservation of plant-herbivore interaction.
Keyword: Aristolochia contorta, compensatory growth, genetic diversity, secondary metabolites, Sericinus montela, specialist herbivore, transcriptome
Student Number: 2013-23382
This research was supported by the National Research Foundation of Korea (NRF) grant funded by the Korea government (MSIT) (NRF-2018R1A2B2002267;
PI: Jae Geun Kim) and the Next-Generation BioGreen 21 Program (PJ013134; PI:
Chung-Mo Park) provided by the Rural Development Administration of Korea.
Table of Contents
Abstract ··· i
LIST OF FIGURES ··· vii
LIST OF TABLES ··· x
Chapter 1. Introduction ··· 1
1.1. Study Background ··· 1
1.1.1. Plant-herbivore interaction and herbivory··· 1
1.1.2. Plant population under herbivory stress ··· 1
1.1.3. Plant defense to herbivory ··· 2
1.1.4. Secondary metabolites of basal angiosperms ··· 3
1.1.5. Aristolochia contorta and its specialist herbivore Sericinus montela ·· 3
1.2. Purpose of Research ··· 4
Chapter 2. An analysis of the genetic diversity of a riparian marginal species, Aristolochia contorta ··· 5
2.1. Introduction ··· 5
2.2. Methods ··· 7
2.2.1. Study site ··· 7
2.2.2. Analysis of genetic diversity ··· 7
2.3. Results and Discussion ··· 9
2.3.1. Intraspecific genetic diversity ··· 9
2.3.2. Genetic distance among populations ··· 11
2.3.3. Genetic diversity of A. contorta and implications to the conservation ··· 12
2.4. Conclusion ··· 14
Chapter 3. Different growth response to the leaf damage under different relative light intensity in herbal vine Aristolochia contorta ··· 15
3.1. Introduction ··· 15
3.2. Methods ··· 17
3.2.1. Growth condition and treatment ··· 17
3.2.2. Measurement of growth characteristics ··· 19
3.2.3. Phenotypic plasticity ··· 19
3.2.4. Statistical analysis ··· 20
3.3. Results ··· 20
3.3.1. Growth characteristics under different light condition and herbivory ··· 20
3.3.2. Phenotypic plasticity against leaf damage under different light condition ··· 26
3.4. Discussion ··· 30
3.4.1. Shade tolerance of Aristolochia contorta ··· 30
3.4.2. Daylight enhance the phenotypic plasticity against leaf damage ··· 30
3.4.3. Possible response of Aristolochia contorta against herbivory ··· 32
3.5. Conclusion ··· 33
Chapter 4. De novo transcriptome assembly of Aristolochia contorta reveals the defense strategy against its specific herbivore, Sericinus montela ··· 34
4.1. Introduction ··· 34
4.2. Methods ··· 37
4.2.1. Plant materials and treatment ··· 37
4.2.2. mRNA library construction ··· 39
4.2.3. De novo assembly and functional annotation ··· 39
4.2.4. Differentially expressed gene analysis ··· 40
4.2.5. Ordination of differentially expressed genes ··· 40
4.2.6. Validation of gene expression ··· 41
4.3. Results ··· 43
4.3.1. Overview of the A. contorta transcriptome ··· 43
4.3.2. Gene expression among experimental conditions ··· 44
4.3.3. Gene Ontology enrichment analysis ··· 48
4.3.4. Kyoto Encyclopedia of Genes and Genomes (KEGG) pathway enrichment analysis ··· 56
4.3.5. Difference in the expression profile on the herbivory defense ··· 61
4.3.6. Validation of gene expression by qRT-PCR ··· 77
4.4. Discussion ··· 83
4.4.1. Response to the special herbivory in the wounded leaf ··· 83
4.4.2. Systemic response against special herbivory ··· 86
4.4.3. Defense of the Aristolochia contorta against its specific herbivore·· 87
Chapter 5. General conclusion ··· 93
Reference ··· 95
Abstract in Korean ··· 104
Appendix A. Detailed methods for RNA extraction of Aristolochia contorta ··· 106
Appendix B. GO (gene ontology) barplot of enriched contigs under wounding or artificial herbivory treatment in A. contorta ··· 108
LIST OF FIGURES
Fig. 2-1. (a, b) Location of study sites; (c) Location of Aristolochia contorta population in each sites. ··· 8 Fig. 2-2. Genetic diversity (h: Nei's genetic diversity; I: Shannon's diversity
index) within each of four studied populations and whole individuals. ··· 10 Fig. 2-3. UPGMA dendrogram based on Nei's genetic diversity among four
studied populations. ··· 11 Fig. 2-4. 2-D plot of principal component analysis (PCA) of 54 A. contorta
individuals with the presence and absence of 14 polymorphic loci from RAPD. ··· 12 Fig. 3-1. Summary of experimental treatments on A. contorta. Young and
mature leaf damaged treatments were made by hole punch to 25% of the uppermost leaves and the lowermost leaves, respectively. ··· 18 Fig. 3-2. Variations in morphological traits among treatments in the mesocosm
experiment. (a) Stem length; (b) Internode length; (c) Number of primary branches; (d) Number of secondary branches; (e) Total leaf area; (f) Number of leaves; (g) Single leaf area; (h) petiole length; (i) Specific leaf area (SLA); (j) Chlorophyll content. ··· 22 Fig. 3-3. Variations in biomass allocation among treatments in the mesocosm
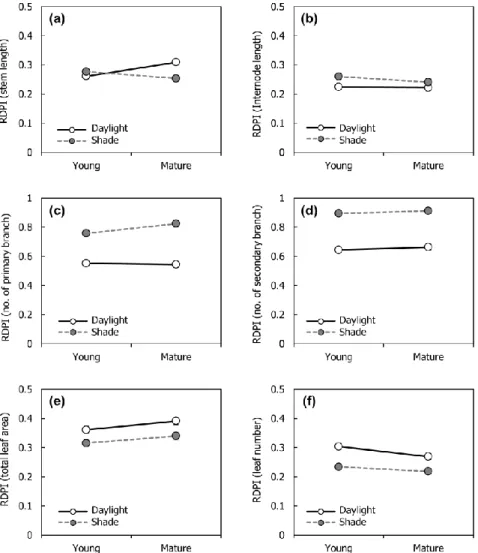
experiment. ··· 23 Fig. 3-4. Relative distance plasticity index (RDPI) of morphological traits
under different light availability treatments. (a) RDPI of stem length; (b) RDPI of internode length; (c) RDPI of number of primary branch; (d) RDPI of number of secondary branch; (e) RDPI of total leaf area; (f) RDPI of leaf number; (g) RDPI of single leaf area; (h) RDPI of petiole length; (i) RDPI of specific leaf area (SLA); (j) RDPI of chlorophyll content (SPAD).··· 27 Fig. 3-5. Relative distance plasticity index (RDPI) of biomass allocation under
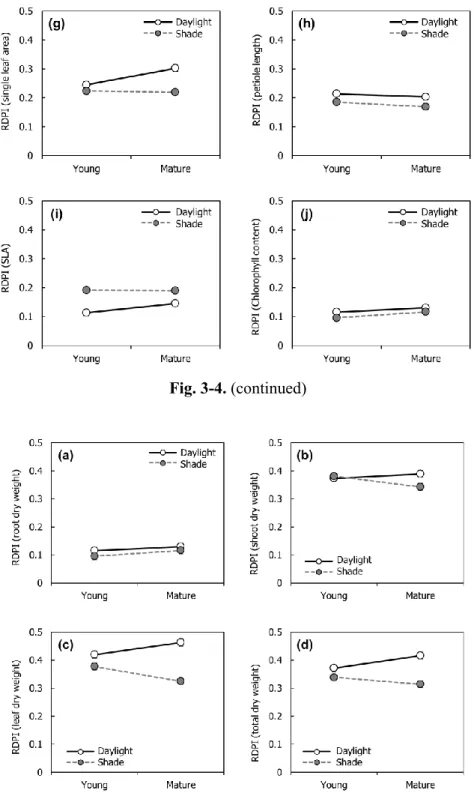
different light availability treatments. (a) RDPI of root dry weight; (b) RDPI of shoot dry weight; (c) RDPI of leaf dry weight; (d) RDPI of total dry weight ··· 28
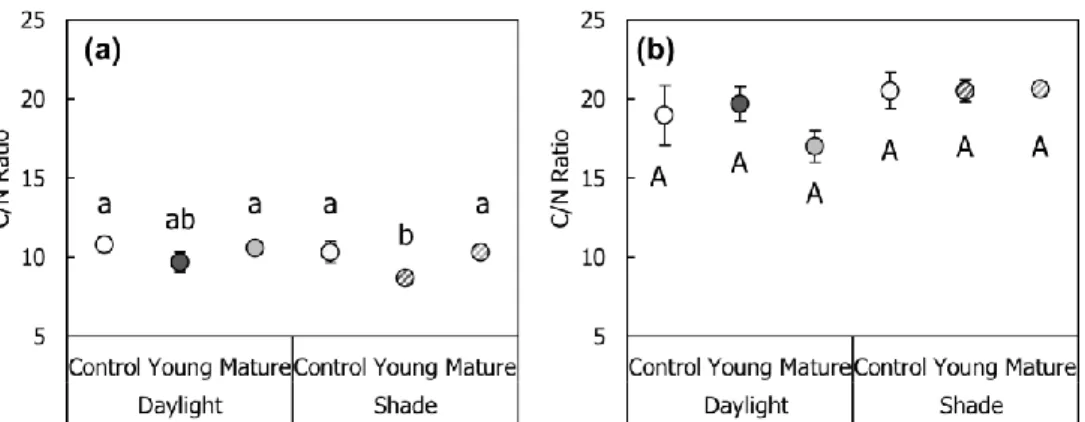
Fig. 3-6. Carbon: nitrogen ratio (C/N ratio) of leaf under experimental conditions. (a) 1st treatment (August); (b) 2nd treatment (September). ··· 29 Fig. 3-7. Summary of the leaf damage experiment under different light
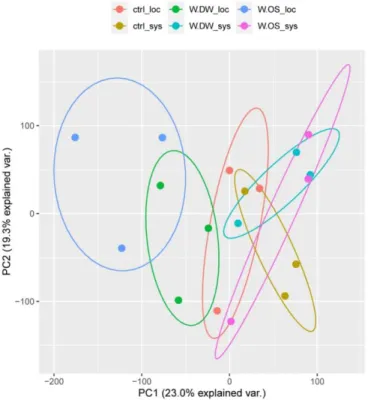
availability on A. contorta individual. ··· 33 Fig. 4-1. Schematic diagram of artificial herbivory treatment. ··· 38 Fig. 4-2. Principal component analysis (PCA) on the expression level (FPKM
values) of each contigs. ··· 44 Fig. 4-3. The number of DEGs in three comparison groups. (a) Venn diagram
of all DEGs (all up- and down-); (b) the number of up- and downregulated DEGs (compared to the control) of local and systemic leaf.
··· 47 Fig. 4-4. The result of Gene Ontology (GO) analysis by REVIGO (biological
process). (a) Control versus W+DW local leaf; (b) Control versus W+OS local leaf; (c) Control versus W+DW systemic leaf; (d) Control versus W+OS systemic leaf. ··· 49 Fig. 4-5. GO circle plot displaying gene annotation enrichment analysis. (a)
most-enriched DEGs in W+DW (versus control), local leaf; (b) most- enriched DEGs in W+OS (versus control), local leaf; (c) most-enriched DEGs in W+DW (versus control), systemic leaf; (d) most-enriched DEGs in W+OS (versus control), systemic leaf. ··· 54 Fig. 4-6. Top 20 enriched KEGG pathways among the annotated DEGs across
four comparisons. (a) Control versus W+DW local leaf; (b) Control versus W+OS local leaf; (c) Control versus W+DW systemic leaf; (d) Control versus W+OS systemic leaf. ··· 57 Fig. 4-7. Expression profile heatmap and clustering in some herbivory and
specific secondary metabolite related GO annotations under various treatments. Color represents the Z-score of the average expression level.
(a) GO:0006952 (defense response); (b) GO:0009611 (response to wounding); (c) GO:0044550 (secondary metabolite biosynthesis process);
(d) GO:0009821 (alkaloid biosynthetic process); (e) GO:0004837 (tyrosine decarboxylase activity). ··· 62 Fig. 4-8. The result of qRT-PCR for selected genes in GO term “defense
response” (GO:0006952). (a) c48813_g2_i1 (AcCht6); (b) c44532_g1_i1
(AcMYB34); (c) c91572_g1_i1 (AcNCS1); (d) c63371_g1_i1 (AcNCS2);
(e) c73635_g1_i1 (AcYLS9). ··· 78 Fig. 4-9. The result of qRT-PCR for selected genes in GO term “response to
wounding” (GO:0009611). (a) c51887_g1_i1 (Ac4CL2); (b) c36845_g1_i1 (AcACS); (c) c64728_g1_i3 (AcCNMT); (d) c51752_g2_i1 (AcJMT); (e) c60393_g2_i1 (AcPAL). ··· 79 Fig. 4-10. The result of qRT-PCR for selected genes in GO term “secondary
metabolite biosynthesis process” (GO:0044550). (a) c106305_g1_i1 (AcCYP73A5); (b) c67503_g1_i1 (AcCYP76B1); (c) c67391_g1_i1 (AcCYP76B6); (d) c50583_g1_i1 (AcCYP80B2); (e) c55025_g1_i2 (AcCYP82C4); (f) c64750_g2_i1 (AcNES); (g) c61823_g1_i3 (AcSCPL8). ··· 81 Fig. 4-11. The result of qRT-PCR for selected genes in GO term “alkaloid
biosynthetic process” (a, b; GO:0009821), GO term “tyrosine decarboxylase activity” (c, d; GO:0004837), DOPA mooxygenase activity (e; GO:0036263), and DOPA dioygenase activity (f;
GO:0046556). (a) c62822_g1_i2 (AcSSL10); (b) c64106_g1_i1 (Ac6OMT); (c) c66826_g5_i1 (AcTyrDC2); (d) c74598_g1_i1 (AcTyrDC3); (e) c8034_g1_i1 (AcDODA); (f) c64496_g1_i4 (AcPPO). ··· 82 Fig. 4-12. Secondary metabolite content in control (undamaged) and induced
(wounded and rubbed with the oral secretion of S. montela and sampled after 48 hours) in greenhouse experiment.··· 89 Fig. 4-13. Summary of the transcriptomic change of A. contorta under
artificial herbivory of S. montela. ··· 92 Fig. 5-1. Summary of the response of A. contorta to the herbivory stress. ··· 94 Fig. B-1. GO barplot displaying gene annotation enrichment analysis of DEGs
in W+DW versus control, local leaf of A. contorta. ··· 108 Fig. B-2. GO barplot displaying gene annotation enrichment analysis of DEGs
in W+OS versus control, local leaf of A. contorta. ··· 112 Fig. B-3. GO barplot displaying gene annotation enrichment analysis of DEGs
in W+DW versus control, systemic leaf of A. contorta. ··· 116 Fig. B-4. GO barplot displaying gene annotation enrichment analysis of DEGs
in W+OS versus control, systemic leaf of A. contorta. ··· 118
LIST OF TABLES
Table 2-1. Used random primer sequences and number of amplified RAPD fragments (*: number of polymorphic loci). ··· 8 Table 3-1. Two-way analysis of variance results for traits of A. contorta in the
mesocosm experiment; F statistics are shown. ··· 25 Table 4-1. Used primers in qRT-PCR. ··· 42 Table 4-2. Summary of annotations of the Aristolochia contorta transcriptome.
··· 43 Table 4-3. Contigs which showed the higher eigenvalues on principal
component analysis of FPKM values. PC = principal component. ··· 46 Table 4-4. Differentially expressed genes (DEGs) in the cluster of upregulated
genes under artificial herbivory of local leaf in defense response (GO:0006952). ··· 67 Table 4-5. Upregulated genes (log2fc>0.5) in the cluster of upregulated group
under artificial herbivory of systemic leaf in defense response (GO:0006952). ··· 69 Table 4-6. Differentially expressed genes (DEGs) in the cluster of upregulated
genes under artificial herbivory of local leaf in response to wounding (GO:0009611). ··· 71 Table 4-7. Differentially expressed genes (DEGs) in the cluster of upregulated
genes under artificial herbivory (W+OS) of local leaf in secondary metabolite biosynthesis process (GO:0044550). ··· 73 Table 4-8. Upregulated genes (log2fc>0.5) in the cluster of upregulated group
under artificial herbivory of systemic leaf in secondary metabolite biosynthesis process (GO:0044550). ··· 75 Table 4-9. Fold changes of contigs which are involved in (a) alkaloid
biosynthetic process (GO:0009821) and (b) tyrosine decarboxylase activity (GO:0004837). ··· 76 Table A-1. Average (±SD) quantity and quality of extracted RNA of A.
contorta by modified TRIzol method. ··· 107 Table B-1. List and enrichment score of enriched GO terms in the GO barplot
(Fig. B-1) of in W+DW versus control, local leaf of A. contorta. ··· 109
Table B-2. List and enrichment score of enriched GO terms in the GO barplot (Fig. B-2) of in W+OS versus control, local leaf of A. contorta. ··· 113 Table B-3. List and enrichment score of enriched GO terms in the GO barplot
(Fig. B-1) of in W+DW versus control, systemic leaf of A. contorta. ··· 117 Table B-4. List and enrichment score of enriched GO terms in the GO barplot
(Fig. B-4) of in W+OS versus control, systemic leaf of A. contorta. ··· 119
Chapter 1. Introduction 1.1. Study Background
1.1.1. Plant-herbivore interaction and herbivory
Land plants are always exposed to the risk of herbivory. Interaction between plant and herbivore has been regarded as the driver of the biodiversity of both plant and herbivore (Jander, 2014). Plant has been developed its own defense mechanism such as secondary metabolites, whereas many of phytophagous insects develop physiological mechanisms to cope with the plant defense simultaneously (Wu and Baldwin, 2010; de Castro et al., 2018). Therefore, specific “arms-race” between plant and herbivore could accelerate the adaptive co-evolution to each other (Jander, 2014; Kergoat, 2016; Endara et al., 2017). Survivorship of both plant and herbivore population has high dependence on the defense of the plant and adaptation of the herbivore to the plant defense (Endara et al., 2017).
1.1.2. Plant population under herbivory stress
Herbivory could affect the plant population both positively and negatively (McNaughton, 1979; Züst and Agrawal, 2017). Excessive herbivory by herbivore outbreak could even exploit the plant tissue, which cause the risk of extinction (Crawley, 1989). However, plant could compensate the moderate loss of plant tissue for rapid re-occupation of environmental resource (McNaughton, 1979). Some over- compensatory growth by herbivory make the more vigorous growth of plant rather than in the undamaged individuals (Jämeiro et al., 1996). While compensatory growth also differs among species and environment (Ballina-Gómez et al., 2010), understanding the phenotypic plasticity of the plant species against herbivory is necessary for the conservation of plant population and its herbivore.
1.1.3. Plant defense to herbivory
Plant primes the further herbivory by development of defense mechanism as well as the compensatory growth (Gatehouse, 2002). For example, inhibition of the herbivore metabolism by gene expression of inhibitory enzyme encoding genes is an example of defense mechanism (Gatehouse, 2002). Reinforcement of plant structure could be accompanied such as biosynthesis of secondary cell wall (e.g.
lignin), which also could lead to decrease of food quality (Xie et al., 2018). In addition, biosynthesis of secondary metabolites could role as diverse way to prevent the further herbivory. They could cope with herbivore directly or indirectly. Some toxic compounds could directly inhibit the metabolism of herbivore, whereas the other compounds attract predator or parasite of the herbivore in indirect way (Wu and Baldwin, 2010).
Plant recognize the herbivory with diverse signal, such as physical damage, herbivore elicitor, and reactive oxygen species (Gatehouse, 2002; Schuman and Baldwin, 2016). Plant defense mechanism is a product of the complex signaling cascades and enzyme reaction, thus the plant defense is affected by the complex regulation of gene expression (Schuman and Baldwin, 2016). Therefore, assessment of the differentially gene expression under herbivory from transcriptome analysis could enhance the understanding on the defense of plant species (Reymond et al., 2004). Even in the same species, genetically heterogeneous group such as ecotype could show the different response to herbivory (Ogran et al., 2019). In addition, genetic diversity of plant population could contribute the defense and resilience to the herbivory stress (Kotowska et al., 2010; Gloss et al., 2013).
1.1.4. Secondary metabolites of basal angiosperms
As a result of the diversification of plant defense mechanism and herbivores’
response, many phytophagous insects are classified as “special” herbivore with the narrow host plant range (Ali and Agrawal, 2012). Larvae of butterfly species (order Lepidoptera) also has its own host range (Enrlich and Raven, 1964; Edger et al., 2015). Swallowtail butterflies (Papilionidae) are one of the diverse butterfly group which species have the narrow host plant range (Enrlich and Raven, 1964; Miller, 1987). Many of swallowtail butterfly species use basal angiosperm species as host plant, which has the ancestral property of angiosperms (Miller, 1987). Basal angiosperm showed some distinct secondary metabolites, which are different from the products of major monocots or eudicots (Bliss et al., 2013).
1.1.5. Aristolochia contorta and its specialist herbivore Sericinus montela Family Aristolochiaceae (Piperales) is a member of Magnoliids and basal angiosperms. There are many host plant species of the swallowtail butterfly larvae (Miller, 1987). Species of this family produces distinctive secondary metabolites such as aristolochic acids and aristololactams, which have the mortality to the generalist phytophagous insects (Bliss et al., 2013). Some specific swallow butterfly species could sequester or detoxify the aristolochic acid (Nishida, 1994; Priestap et al., 2012). Aristolochia contorta Bunge is herbal vine species as the member of family Aristolochiaceae. In addition, dragon swallowtail butterfly Sericinus montela (Papilionidae) exclusively consume only A. contorta (Hong et al., 2014). These two species inhabit in narrow geographical range (Russian Far East, Korea, China, and Japan; GBIF Secretariat, 2020).
1.2. Purpose of Research
From the exclusively specific herbivore and narrow distribution range, A.
contorta seems to have distinct responses to herbivory stress as Aristolochiaceae and basal angiosperms. However, both the ecological and physiological characteristics of A. contorta has been poorly understood yet (Park et al., 2019). I tried to understand the response of A. contorta to herbivory in ecological and molecular biological perspective. Research question of this study are followed:
1) What about the genetic diversity of A. contorta population?
2) How growth response of A. contorta differ under herbivory stress?
3) How gene expression pattern differs in A. contorta under herbivory stress?
4) Which mechanism could maintain the co-existence of A. contorta and its specific herbivore S. montela?
To figure out the above research questions, I conducted field experiment and laboratory experiment of A. contorta about herbivory stress. In Chapter 2, genetic diversity of A. contorta population was examined. In Chapter 3, a field experiment was applied to compare the growth under leaf damage treatment.
Difference in phenotypic plasticity to leaf damage among different light availability was also assessed. In Chapter 4, transcriptome of A. contorta under simulated herbivory was compared to undamaged or simply wounded individuals. I tried to assess the effect of herbivore-elicitor of S. montela on the additional defense response of A. contorta. In addition, systemic response to prime the herbivory in undamaged tissue was assessed. From these results, I tried to understand and summarize the multi-layer response of A. contorta to herbivory of its specialist herbivore S. montela.
Chapter 2. An analysis of the genetic diversity of a riparian marginal species, Aristolochia contorta
12.1. Introduction
Vegetation structure of riparian ecosystem is determined by the ecological gradient as the transition zone between aquatic ecosystem and terrestrial ecosystem (Naiman et al., 2005; Park and Kim, 2020). Upper riparian zone is affected by relative weaker impact of flooding from river or stream and increased canopy of the terrestrial plants (Vidon and Hill, 2004; Soykan et al., 2012). Therefore, vegetation of upper riparian zone seems to have specific ecological niche, while it also affects the biodiversity of neighbored aquatic and terrestrial ecosystem. For the conservation of biodiversity of the riparian vegetation, biodiversity of the upper riparian zone should be also considered.
Vine species at upper riparian zone could contribute the plant biodiversity and nutrient cycle (Hegarty et al., 1989). Vine species could enhance the biodiversity with its unique ecological niche, unless it shows invasiveness. Aristolochia contorta Bunge (Aristolochiaceae) is one of the perennial herbal vine species which inhabits near the river and valley. Its distribution range is known as Eastern China, Eastern Russia, Japan and Republic of Korea (Global Biodiversity Information Facility, 2020). Aristolochia contorta could twine up the diverse host plant such as tree, shrub, and herb, it could even twine up the artificial structure such as fence (Park et al., 2019). Also, A. contorta is a species-level specific host of the larvae of Sericinus
1 Published in Journal of Wetlands Research, Vol. 22, No. 2, pp. 100-105 (May 2020; in Korean with English abstract)
montela Gray (swallowtail butterfly), which is designated as the vulnerable species (VU) in Red List of Republic of Korea. Construction of the artificial habitat for S.
montela and A. contorta has been tried in Republic of Korea, which. However, there are difficulties in amplification of A. contorta individuals, since the seed dormancy period is long and the dormancy-breaking method is unknown (Voronkova et al., 2018).
For conservation of plant population in long-term perspective, enhancement of the genetic diversity should be also considered as well as the amplification of the individuals (Wimp et al., 2004; Gamfeldt and Källström, 2007).
For conservation of the genetic diversity, genetic diversity of the natural population should be assessed in advance. Former study of Nakonechnaya et al. (2012) revealed that A. contorta population in Eastern Russia had the low genetic diversity from allozyme analysis (Nakonechnaya et al., 2012). Chloroplast genome of A. contorta had been sequenced (Zhou et al., 2017). However, nuclear genome of A. contorta is still unknown. Therefore, universal marker should be applied for assessment of the genetic diversity of A. contorta.
This study aims to assess the genetic diversity of A. contorta population in Republic of Korea using randomly amplified polymorphic DNA method, which could be applied without the genomic information with high intra-population resolution (Williams et al., 1990). I assessed the genetic diversity of A. contorta populations, which showed the vigorous growth in Republic of Korea. Also I tried to discuss about the implication for conservation of genetic diversity in A. contorta population.
2.2. Methods
2.2.1. Study site
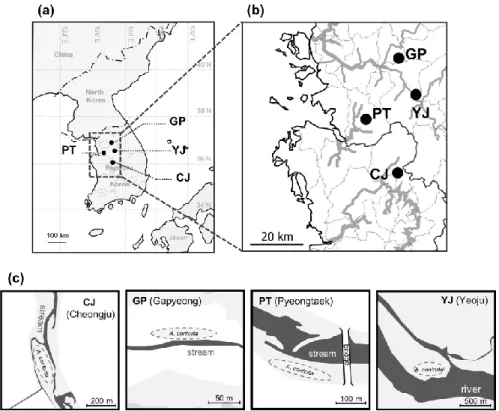
Four study sites were selected among the A. contorta population, which have showed the vigorous growth and population density in Republic of Korea (Park et al., 2019). Population GP (n = 11) has been located at the neighbor of the valley in Gapyeong, Gyeonggi Province. Population PT (n = 16) in Pyeongtaek, Gyeonggi Province and population CJ (n = 13) in Cheongju, Chungbuk Province have been located at the upper riparian zone neighbor of the stream. Population YJ (n = 14) has been located in the upper side of the river island (Fig. 2-1). Individuals of A. contorta in population GP and YJ twined up diverse plant species including herbal species, shrub, and tree. Host types of population CJ were herbs, trees, and fence, whereas of population PT were herbs and fence (Park et al., 2019). Leaf samples were collected from the individuals with 2 m interval to prevent the sampling from clone. Collected leaf samples were frozen and stored at -80 ℃ before DNA extraction.
2.2.2. Analysis of genetic diversity
Total genomic DNA were extracted from frozen samples using DNeasy Plant Mini Kit (Qiagen, Hilden, Germany) after grinding. Concentration and purity of extracted DNA samples were quantified using Nanodrop OneC (Thermo Fischer Scientific, Waltham, MA) and diluted to 50 ng/μl with deionized water. Polymerase chain reaction of RAPD were conducted with the mixture of 1 μl of template DNA (50 ng/μl), 2 μl of dNTP mix (2.5 mM each), 2 μl of 10x PCR buffer, 1 μl of random primer (10 pmol/μl), 13.8 μl of DNAse-free deionized water, and 0.2 μl of Taq DNA polymerase (5 U/μl of BS eTaq DNA polymerase; Biosesang, Seongnam, the Republic of Korea). Polymerase chain reaction was conducted with 95℃, 5 min of
initial denaturation, 28 cycles of [95℃, 45 sec of denaturation]-[Tm (Table 2-1), 45 sec of annealing]-[72℃, 95 sec of elongation], and 72℃, 2 min of final extension.
Total five random oligomers were used from eleven primers which showed the polymorphic loci (Table 2-1).
Fig. 2-1. (a, b) Location of study sites; (c) Location of Aristolochia contorta population in each sites.
Table 2-1. Used random primer sequences and number of amplified RAPD fragments (*: number of polymorphic loci).
Primer name Sequence (5’→3’) Tm (℃) No. of observed bands
N-8002 CAATCGCCGT 32 4 (2*)
N-8005 GAAACGGGTG 32 3 (2*)
N-8041 ATCGGGTCCG 34 7 (5*)
N-8045 CAAACGTCGG 32 6 (3*)
N-8072 CTTAGGGCAC 32 5 (2*)
Amplified DNA fragments were observed by electrophoresis of 1% agarose gel stained with GelRedTM (Biotium, Heyward, CA). Presence and/or absence of amplified band at polymorphic loci were scored within binary matrix (0=absence;
1=presence) under gel documentation system.
From the binary matrix, intra-population genetic diversity (h: Nei's genetic diversity; I: Shannon's diversity index) and inter-population genetic diversity (Nei's genetic distance and UPGMA dendrogram) were calculated using the software Popgen32 (Nei, 1973; Yeh and Boyle, 1997). Principal component analysis from the band presence/absence of polymorphic loci were conducted using package “vegan”
(Oksanen et al., 2013) in R version 3.6.1 (R core team, 2020).
2.3. Results and Discussion
2.3.1. Intraspecific genetic diversity
Total 25 band loci were observed from the RAPD-PCR of five primers, while 14 loci (56%) showed polymorphism. Total genetic diversity was 0.1552 in Nei's genetic diversity (h) and 0.2370 in Shannon's diversity index (I). Intraspecific genetic diversity was ranged in 0.0607 ~ 0.1491 (h) and 0.0819 ~ 0.1759 (I) (Fig. 2- 2). Population GP showed the highest intraspecific genetic diversity (h = 0.1491; I = 0.1759), while CJ showed the lowest intraspecific genetic diversity.
Intraspecific genetic diversity of A. contorta population was relatively lower than the intraspecific genetic diversity of the other wetland plants which had used RAPD marker. Genetic diversity of A. contorta population was relatively lower than the annual plant Polygonum thunbergii (h: 0.2381 ~ 0.2761; I: 0.3592 ~ 0.4100;
Nam et al., 2016), which could propagate only by seed dispersal. Also, it was in the
lower range of the genetic diversity of Typha angustifolia (h: 0.0962 ~ 0.2392; I:
0.1419 ~ 0.3512), which could propagate both by seed dispersal and rhizome propagation (Min et al., 2012). Therefore, low genetic diversity of A. contorta seemed to be caused by contribution of the clonal propagation of A. contorta. Former study of Nakonechnaya et al. (2012) pointed the clonal growth of root sprout and apomixis, which refer the clonal seed formation without fertilization, as the cause of the lower genetic diversity of A. contorta population (Nakonechnaya et al., 2012).
Therefore, intra-population genetic diversity of A. contorta population is predicted to decrease in long-term perspective.
Fig. 2-2. Genetic diversity (h: Nei's genetic diversity; I: Shannon's diversity index) within each of four studied populations and whole individuals. CJ (Cheongju; n = 13); GP (Gapyeong; n = 11); PT (Pyeongtaek; n = 16); YJ (Yeoju; n = 14).
2.3.2. Genetic distance among populations
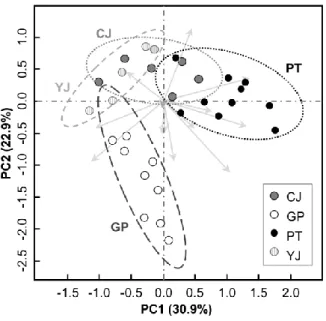
Inter-population genetic distance (Nei's genetic distance) was ranged from 0.0495 to 0.1699. Population YJ and CJ showed the shortest genetic distance (0.0495). Population GP showed the highest genetic distance between the other populations (e.g. PT ~ GP: 0.1699; Fig. 2-3). Principal component analysis by polymorphic bands also showed the relatively separated population structure of population GP from the other three populations (Fig. 2-4).
Fig. 2-3. UPGMA dendrogram based on Nei's genetic diversity among four studied populations. CJ (Cheongju; n = 13); GP (Gapyeong; n = 11); PT (Pyeongtaek; n = 16); YJ (Yeoju; n = 14).
2.3.3. Genetic diversity of A. contorta and implications to the conservation Populations of A. contorta showed the overall low genetic diversity rather than the other riparian plant species. This could be considered as the result of the clonal propagation rather than the seed dispersal (Nakonechnaya et al., 2012). To increase the intra-population genetic diversity, optimal growth condition such as physical support could be provided at artificial habitat for inflorescence (Park et al., 2019). Lower total genetic diversity could be caused by the limited study sites. Total genetic diversity could be compensated by the further survey on the other sites.
Fig. 2-4. 2-D plot of principal component analysis (PCA) of 54 A. contorta individuals with the presence and absence of 14 polymorphic loci from RAPD.
Values in parenthesis indicate the relative eigenvalue of each axis. Dotted ellipses indicate the 95% range of standard deviation of each population. CJ (Cheongju; n = 13); GP (Gapyeong; n = 11); PT (Pyeongtaek; n = 16); YJ (Yeoju; n = 14).
Individuals of population GP, which showed the highest intra-specific genetic diversity, were distributed at diverse host types such as herbs, shrubs, and trees (Park et al., 2019). Proper host diameter varies by the age or status of the vine species, thus vine species could not twine up the relatively thick host than vine shoot (DeWalt et al., 2000). Juvenile A. contorta could twine up the herbal species and transfer to the neighbored shrubs and trees as increase of the age and shoot diameter.
Diverse host types could provide the environment to A. contorta for settlement, which could enhance the intra-population genetic diversity. Therefore, diverse host plant and/or artificial physical support should be provided to A. contorta for transfer of the host within the growth stage.
Genetic distance among populations was independent from the geological distance (Fig. 2-3). In particular, population GP was relatively separated from the other populations. These result could be caused by habitat fragmentation from narrow ecological niche and high proportion of the clonal propagation. For ex-situ species conservation, plantation of mixed individuals from various source population could enhance the genetic diversity (Lesica and Allendorf, 1999). In addition, proper growth condition should be also provided for vegetative growth of A. contorta for providing food and habitat to vulnerable butterfly S. montela as well as the enhancement of genetic diversity.
2.4. Conclusion
Intra-population genetic diversity of A. contorta was lower than other riparian plant species. This result should be considered for conservation of A.
contorta. Various shape and diameter of physical supports should be provided for enhance vegetative growth and genetic diversity, as well as abiotic growth condition.
Also, some population was seemed to be separated from the other populations, regardless of the geological distance. From this result, mixed planting from various populations could be applied for ex-situ conservation with various genetic distance.
Successful settlement of A. contorta would contribute the conservation of the vulnerable butterfly S. montela, as well as the connectivity of the riparian vegetation between the aquatic and terrestrial ecosystem.
Chapter 3. Different growth response to the leaf damage under different relative light intensity in herbal vine Aristolochia contorta
3.1. Introduction
Herbivory is one of the major plant-herbivore interaction, which could contribute the biodiversity as a result of co-evolutionary adaptation of each other (Jander, 2014). Plants are exposed to the herbivore stress in their life cycle.
Herbivory stress is commonly known to affect the plant growth negatively (Züst and Agrawal, 2017). Defense mechanism of plant against herbivory which make plant able to prime the further herbivory commonly accompanies the trade-off between vegetative growth (Xie et al., 2018).
Leaf damage is one of the main phenomenon caused by herbivory, which leads to the loss of the plant tissue. Plant has its own phenotypic plasticity in response to changes in biotic and abiotic environmental change including leaf damage (Schlichting, 1986). Phenotypic plasticity under the herbivory stress could be assessed to understand the compensatory growth response (Barton, 2008). Moderate leaf damage by herbivory stress could stimulate the compensatory growth, which could enhance the vigorous growth of plant individual rather than the undamaged individual (McNaughton, 1979). Compensatory growth could be affected by the resource availability, yet the relationship between resource availability and compensatory growth response is unclear (Ballina-Gómez et al., 2010).
Light is one of a major limiting factor to plant resource acquisition and allocation (Ågren, 1985). In addition, herbivory stress is commonly known to suppress the photosynthesis (Nabity et al., 2009). Response to herbivory stress of plant is also affected by light availability (Lentz and Cipollini Jr., 1998; Hough- Goldstein and LaCross, 2012). Therefore, effect of the herbivory on the plant growth also might vary under different light availability environment.
Family Aristolochiaceae is one of the group which have distinct secondary metabolites, which allows only a few specialist herbivore species (Miller, 1987).
Aristolochia contorta is one of the angiosperm species which have the species-level specialist herbivore butterfly species, Sericinus montela (dragon swallowtail; Hong et al., 2014). Because of species-level dependence of S. montela, population and individuals of A. contorta should be maintained for co-existence with S. montela.
However, the growth response of the A. contorta under leaf damage stress has been poorly understood.
In this study, a mesocosm experiment of different light availability and leaf damage was conducted. I tried to reveal the difference in phenotypic plasticity to the leaf damage stress among light availability to understand the growth response of A.
contorta under leaf damage stress. In addition, for assessment of the effect of herbivore preference on the young leaf, leaf damage treatment was subdivided into two treatments: mature leaf damaged and young leaf damaged. Phenotypic plasticity indices were calculated for each growth parameters to compare the compensatory growth among different light availability. Result of this study could enhance the fundamental understanding of the response to the leaf damage stress of A. contorta.
3.2. Methods
3.2.1. Growth condition and treatment
Aristolochia contorta seeds were collected from a population which located in Gapyeong, Gyeonggi Province, Republic of Korea at December 2017. Seeds were delivered to laboratory and germinated in greenhouse located at Seoul National University at May 2018. At June 2018, total 120 seedlings with about 5 cm of shoot height were individually transplanted in the pots (15 cm diameter × 20 cm depth) filled with mix of sand and topsoil (2:1 in v/v). Physical support of plastic stake (0.3 cm diameter × 1.3 m height) was added in each pot.
One week after transplanting (early July), two relative light availability treatments (relative light intensity, RLI; daylight = 100% of RLI to outside; shade = 50% of RLI) were applied to 60 individuals for each. Half level of RLI (shade treatment) was provided by layered black mesh 2.5 m above the steel structure, which have shown as the half level of the light intensity at outside (Park et al., 2019). Average light intensity under daylight and shade treatments were 1303.3 μmol m-2 s-1 and 653.8 μmol m-2 s-1 at noon, respectively. Individuals of A. contorta were acclimated under each light intensity treatment in one month and used to leaf damage treatment.
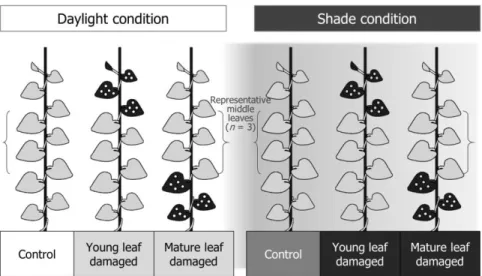
In each light availability treatment, leaf damage treatments were applied two times (15th August and 15th September) to mimic the temporal emergence of the larvae of Sericinus montela (Kim and Kwon, 2010). Three treatments were applied for each light availability treatment as follow: control (undamaged), mature leaves damaged, and young leaves damaged. In treatment “mature leaves damaged”, loss of 50%
in leaf area by damage using hole puncher was applied to the 25% of the lowermost leaves in each individual. The treatment "young leaves damaged” was applied as same
as "mature leaves damaged” to the uppermost leaves (25% of total leaves; Fig. 3-1).
Individuals were additionally grown for four weeks after the second treatment.
Fig. 3-1. Summary of experimental treatments on A. contorta. Young and mature leaf damaged treatments were made by hole punch to 25% of the uppermost leaves and the lowermost leaves, respectively.
3.2.2. Measurement of growth characteristics
Plant were harvested at four weeks after the second leaf damage treatment (October). Following characteristics were measured: number of primary and secondary branches, number of leaves, total leaf area, internode and petiole lengths, stem length, and dry weight of stem, leaf, and root. Total leaves area of each individual was measured using portable leaf area meter (LI-3000C, LI-COR Bioscience, Lincoln, NE). Internode and petiole lengths were measured as the average of three replicates at the midshoot using digital vernier caliper (Mitutoyo, Kanagawa, Japan). Chlorophyll contents were quantified from the average of the three leaf replicates at the midshoot in each individual using chlorophyll meter (SPAD-502, Konica Minolta, Tokyo, Japan). Total dry weight was calculated as the sum of the dry weight of stem, leaves, and root. Specific leaf area (SLA) was calculated from the ratio of average single leaf area (total leaf area / number of leaves) and average single leaf dry weight (leaf dry weight / number of leaves).
Punched plant leaf tissues were collected and dried. In control treatment, two leaves were collected near the midshoot and dried. Carbon: nitrogen ratio (C/N ratio) of dried plant leaf tissue samples was analyzed from total carbon and total nitrogen contents using elemental analyzer (Flash EA 1112, Thermo Fisher Scientific, Waltham, MA).
3.2.3. Phenotypic plasticity
For comparison of phenotypic plasticity to the leaf damage between two light availability treatments, a relative distance plasticity indices (RDPI) of each growth parameter were calculated (Valladares et al., 2006). Because of the discontinuity of the leaf damage treatment, relative distances under two treatments
of each light availability treatments (mature leaves damaged and young leaves damaged) from control treatment were calculated as below:
𝑅𝐷𝑃𝐼 = (∑ 𝑑𝑐𝑡𝑟𝑙,𝑖→𝑡𝑟𝑒𝑎𝑡𝑚𝑒𝑛𝑡,𝑗 𝑥𝑐𝑡𝑟𝑙,𝑖+𝑥𝑡𝑟𝑒𝑎𝑡𝑚𝑒𝑛𝑡,𝑗) 𝑛⁄ Where n is the total number of distances.
3.2.4. Statistical analysis
Significances of light availability, leaf damage, and interaction between the light availability and leaf damage were examined by two-way analysis of variance (ANOVA) using R version 4.0.2 (R core team, 2020). Significance of the differences between group means was determined by Duncan’s post-hoc test using R package
“agricolae” (Mendiburu, 2020).
3.3. Results
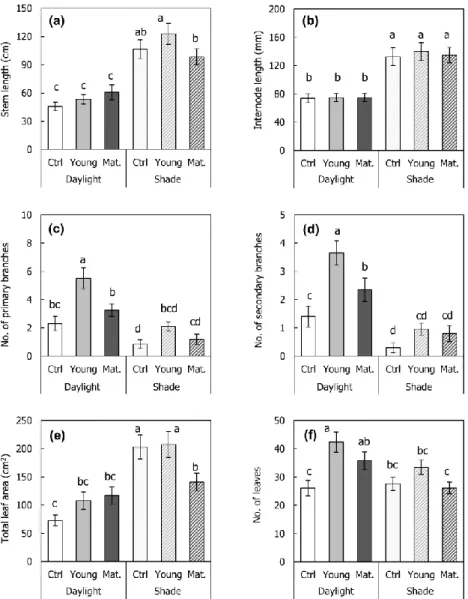
3.3.1. Growth characteristics under different light condition and herbivory Both stem and internode length were higher under the shade treatment, rather than the daylight treatment (Fig. 3-2a, b). Number of branches and leaves were higher under the daylight treatment rather than the shade (Fig. 3-2c, d, f). On the other hand, total leaf area and average single leaf area were higher under the shade treatment rather than the daylight (Fig. 3-2e, g). Petiole length and specific leaf area were also higher under the shade rather than the daylight (Fig. 3-2h, i). Chlorophyll content did not show the significant difference under two light availability treatments (Fig. 3-2j). Dry weight of aboveground parts (leaf and shoot) was higher under the shade treatment rather than the daylight treatment, whereas the root dry weight did not show the difference under two light availability treatments (Fig. 3-3).
Some of the growth characteristics were affected by the leaf damage treatment. Number of branches and leaves seemed to increase under the leaf damage treatment, young leaf damaged treatment in particular (Fig. 3-2c, d, f). Dry weight of root, shoot, and leaf were also higher under the leaf damage treatment (Fig. 3-3).
Morphological traits significantly differed by the light availability and leaf damage treatment, mainly by light availability (Table 3-1). Light availability treatment significantly affected the overall growth traits, such as stem and internode length, number of primary and secondary branches, total leaf area, number of leaves, average single leaf area, petiole length, SLA, shoot dry weight, and leaf dry weight (p < 0.05). Leaf damage treatment affected number of primary and secondary branches, number of leaves, SLA, root dry weight, shoot dry weight, and total dry weight (p < 0.05).
There were some significant interactions between light availability and leaf damage treatment in number of secondary branches, total leaf area, chlorophyll content, and leaf dry weight. Under the daylight treatment, number of secondary branches was the highest with young leaf damaged rather than the mature leaf damaged (Daylight/Control = 1.4 ± 0.4; Daylight/Young.= 3.7 ± 0.4;
Daylight/Mature. = 2.4 ± 0.4). On the other hand, leaf damaged treatment showed the increase of the secondary branches under the shade treatment, yet damaged leaf part did not affect (Shade/Control = 0.3 ± 0.2; Shade/Young.= 1.0 ± 0.2;
Shade/Mature. = 0.8 ± 0.3).
Fig. 3-2. Variations in morphological traits among treatments in the mesocosm experiment. (a) Stem length; (b) Internode length; (c) Number of primary branches;
(d) Number of secondary branches; (e) Total leaf area; (f) Number of leaves; (g) Single leaf area; (h) petiole length; (i) Specific leaf area (SLA); (j) Chlorophyll content. Lower case alphabets on graph represent statistically different groups by Duncan post-hoc test (< 0.05 level). Daylight = 100% of relative light intensity (RLI);
Shade = 50% of RLI; Ctrl. = control; Young = young leaf damaged; Mat. = mature leaf damaged.
Fig. 3-2. (continued)
Fig. 3-3. Variations in biomass allocation among treatments in the mesocosm experiment. Alphabets on graph represent statistically different groups by Duncan post-hoc test (< 0.05 level). Daylight = 100% of relative light intensity (RLI); Shade
= 50% of RLI; Ctrl. = control; Young = young leaf damaged; Mature = mature leaf damaged.
Total leaf area was increased under leaf damage treatment in the daylight.
On the other hand, damage of mature leaves lead to decrease of the total leaf area under the shade (Shade/Control = 203.1 ± 21.7 cm2; Shade/Young.= 207.1 ± 23.0 cm2; Shade/Mature. = 140.8 ± 15.9 cm2). Chlorophyll content under the daylight showed the increase by the leaf damage (Daylight/Control = 27.6 ± 1.3 in SPAD;
Daylight/Young.= 30.5 ± 1.1; Daylight/Mature. = 33.7 ± 1.2), yet leaf damage lead to the decrease of chlorophyll content under the shade (Shade/Control = 31.3 ± 0.9;
Shade/Young.= 30.3 ± 1.3; Shade/Mature. = 26.6 ± 1.1). Root dry weight with young leaf damaged treatment was higher rather than mature leaf damaged treatment under the daylight (Daylight/Control = 0.50 ± 0.06 g; Daylight/Young.= 0.80 ± 0.11 g;
Daylight/Mature. = 0.75 ± 0.10 g). Meanwhile, root dry weight with mature leaf damaged treatment was slightly higher rather than young leaf damaged treatment under the shade (Shade/Control = 0.64 ± 0.08 g; Shade/Young.= 0.74 ± 0.09 g;
Shade/Mature. = 0.81 ± 0.09 g).
Table 3-1. Two-way analysis of variance results for traits of A. contorta in the mesocosm experiment; F statistics are shown. The two treatments were light availability (daylight and shade) and leaf damage (control, mature leaf damaged, and young leaf damaged). df = 1, 2, 114 for traits. Significant effects are shown in boldface (* p < 0.05, ** p < 0.01, *** p < 0.001).
Light Damage Light × Damage
Stem length (cm) 69.521*** 1.111 1.985
Internode length (cm) 61.478*** 0.102 0.061 No. of primary branches 36.147*** 11.926*** 2.272 No. of secondary branches 44.169*** 9.733*** 3.152*
Total leaf area (cm2) 35.476*** 1.422 4.948**
No. of leaves 6.274* 8.168*** 2.553
Single leaf area (cm2) 104.625*** 2.233 4.374*
Petiole length (mm) 58.085*** 0.063 2.836
Specific leaf area (SLA) 10.996** 3.151* 1.163 Chlorophyll content (SPAD) 1.637 0.358 11.175***
Root dry weight (g) 0.451 3.387* 0.606
Shoot dry weight (g) 23.991*** 3.329* 1.834 Leaf dry weight (g) 11.876*** 2.792 3.521*
Total dry weight (g) 6.546* 3.299* 1.014
3.3.2. Phenotypic plasticity against leaf damage under different light condition Relative distance plasticity index (RDPI) showed the difference in phenotypic plasticity to the leaf damage among two light availability treatments (Figs. 3-4 and 3-5). Total leaf area, leaf number, single leaf area, petiole length and chlorophyll content showed the higher plasticity under the daylight treatment rather than the shade treatment (Fig. 3-4e, f, g, h, j). Internode length, number of primary and secondary branch, SLA showed the higher plasticity under the shade treatment rather than the shade treatment (Fig 3-4. b, c, d, i).
Total leaf area and chlorophyll content showed the higher plasticity with mature leaf damaged treatment rather than young leaf damaged treatment (Fig. 3-4e, j). Leaf number showed the higher phenotypic plasticity to young leaf damaged treatment rather than mature leaf damaged treatment (Fig. 3-4f). The higher light availability induced the higher RDPI of stem length and single leaf area with mature leaf damaged treatment, yet not with young leaf damaged treatment (Fig. 3-4a, g).
Phenotypic plasticity of biomass allocation was higher under the daylight treatment rather than the shade treatment, especially with mature leaf damaged treatment rather than young leaf damaged treatment (Fig. 3-5).
Fig. 3-4. Relative distance plasticity index (RDPI) of morphological traits under different light availability treatments. (a) RDPI of stem length; (b) RDPI of internode length; (c) RDPI of number of primary branch; (d) RDPI of number of secondary branch; (e) RDPI of total leaf area; (f) RDPI of leaf number; (g) RDPI of single leaf area; (h) RDPI of petiole length; (i) RDPI of specific leaf area (SLA); (j) RDPI of chlorophyll content (SPAD). Daylight = 100% of relative light intensity (RLI); Shade
= 50% of RLI; Young = young leaf damaged; Mature = mature leaf damaged.
Fig. 3-4. (continued)
Fig. 3-5. Relative distance plasticity index (RDPI) of biomass allocation under different light availability treatments. (a) RDPI of root dry weight; (b) RDPI of shoot dry weight; (c) RDPI of leaf dry weight; (d) RDPI of total dry weight; Daylight = 100% of relative light intensity (RLI); Shade = 50% of RLI; Young = young leaf damaged; Mature = mature leaf damaged.
Carbon: nitrogen ratio (C/N ratio) at initial treatment showed that the significantly lower C/N ratio in the young leaves rather than the mature lower leaves and middle leaves (control treatment; Fig. 3-6a). Damage on the mature leaf lead to the decrease of C/N ratio under the daylight condition, while it did not show the statistical significance (Fig. 3-6b). Overall C/N ratio increased at the secondary treatment of September (17.00 ~20.63) rather than the first treatment of August (8.66 ~ 10.79).
Fig. 3-6. Carbon: nitrogen ratio (C/N ratio) of leaf under experimental conditions.
(a) 1st treatment (August); (b) 2nd treatment (September). Alphabets on graph represent statistically different groups by Duncan post-hoc test (< 0.05 level).
Daylight = 100% of relative light intensity (RLI); Shade = 50% of RLI; Young = young leaf damaged; Mature = mature leaf damaged.
3.4. Discussion
3.4.1. Shade tolerance of Aristolochia contorta
In the former mesocosm experiment study, 3-year-old Aristolochia contorta individuals showed the relatively vigorous growth under shade with the larger leaf and the longer stem rather than full sunlight (Park et al., 2019). Similar to the 3-year- old A. contorta individuals, 1-year-old A. contorta individuals in the present study also showed the longer stem, larger leaf area, and larger biomass production under the shade treatment. On the other hand, number of leaf and branch were higher under the daylight treatment. Although light is a necessary and limiting resource for photosynthesis, excessive solar radiation could cause heat, dehydration and UV irradiation, which could inhibit the plant growth (Valladares and Niinemets, 2008).
In case of vine species, light availability is mainly determined by host plant species.
Aristolochia contorta showed the higher shoot growth and the larger leaf area under the tree host, rather than the shrub and herb host plant (Park et al., 2019). From the result of the present study, shade tolerance of one-year-old A. contorta individual seemed to be similar to the three-year-old individual or other individuals in the natural populations.
3.4.2. Daylight enhance the phenotypic plasticity against leaf damage
Many of growth characteristics showed the increase under the leaf damage treatment. Damage of young leaf further affected the growth characteristic parameters rather than the damage of mature leaf. Newly emerging leaves are considered to have the higher food quality the higher photosynthesis rate and nitrogen concentrations (Field and Mooney, 1983). Therefore, phytophagous insects
commonly prefer the new leaves rather than the mature leaves (Cranshaw and Radcliffe, 1980; Bazzaz et al., 1987). Damage of newly emerging leaves could make the apical dominance weaker, which trigger the emergence of new leaf or shoot (Aarssen, 1995). In the present study, damage of young leaves more induced the emergence of new leaves and branches, therefore more new leaves could re-emerge.
Compensatory response to herbivory stress in plants has been studied in diverse plant species (Trumble et al., 1993; Strauss and Agrawal, 1999). Vine plant species with climbing life-form also have compensatory response to herbivory (Rausher et al., 1993; Schierenbeck et al., 1994; Gianoli et al., 2007). In the present study, A. contorta showed the higher primary production under the leaf damage treatment rather than the un-damaged treatment. In some cases, plant could
“overcompensate” the damage to cope with the competition for resource availability (Jämeiro et al., 1996). Aristolochia contorta also showed the some overcompensatory traits under moderate level of leaf damage, which could be inferred as the rapid recovery and occupation of resource.
Herbivory is known to suppress the photosynthesis indirectly (Nabity et al., 2009). Therefore, light could role as a limiting factor for compensatory growth (Lentz and Cipollini Jr., 1998; Hough-Goldstein and LaCross, 2012). Vine species could respond to the leaf damage differently by the light availability (Gianoli et al., 2007). Despite of that A. contorta showed the higher growth under the shade treatment, not all of the phenotypic plasticity under leaf damage stress were higher in the shade treatment rather than the daylight treatment (Figs. 3-4 and 3-5).
Especially, some phenotypic plasticity indices on the biomass were higher under the daylight treatment rather than the shade treatment. Thus, compensatory growth of each parameter seemed to be affected from the environmental condition differentially.
3.4.3. Possible response of Aristolochia contorta against herbivory
From the result of the present study, moderate level leaf damage (25% of total leaves) seemed to induce the further growth of A. contorta. Therefore, proper density of herbivore could enhance the growth and maintenance of the A. contorta population. In addition, some alkaloids including aristolochic acids are known to be accumulated in Aristolochiaceae species, which contains the nitrogen bond (Shamma and Guinaudeau, 1985). Regardless of the statistical significance, leaf tissue of individuals with mature leaf damaged treatment under the daylight showed the lower C/N ratio rather than the other experimental treatment at September (Fig. 3-6b).
Biosynthesis and accumulation of secondary metabolites is one of the core defense mechanism against herbivory both in “constitutive” and “induced” perspective (Wu and Baldwin, 2010). This result could be inferred as the induced accumulation of the secondary metabolites to prime the further herbivory when mature leaves were damaged. Accumulation of secondary metabolite involves the trade-off with the vegetative growth, thus it could be affected by both light intensity and leaf damage (Gianoli et al., 2007). This perspective could be assessed by the quantification on the secondary metabolites of A. contorta in future studies.
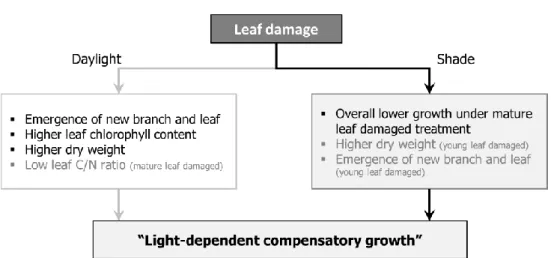
3.5. Conclusion
Most of the growth characteristics of A. contorta showed that leaf damage induced the compensatory growth. Phenotypic plasticity under leaf damage differed by light availability (Fig. 3-7). This results indicate that proper environmental condition could make growth and maintenance of A. contorta population under the herbivory stress. Furthermore, leaf C/N ratio after leaf damage treatment implied the possibility of induced secondary metabolite biosynthesis to prime the further herbivory under sufficient daylight. To understand the response of A. contorta to herbivore stress deeply, further research about the defense mechanism of A. contorta against herbivory should be studied.
Fig. 3-7. Summary of the leaf damage experiment under different light availability on A. contorta individual.
Chapter 4. De novo transcriptome assembly of Aristolochia contorta reveals the defense strategy against its specific herbivore, Sericinus montela
4.1. Introduction
Interactions between plant and insect have been affected the biodiversity of each other (Jander, 2014). In particular, herbivory has been affected both plant and insect as “arms-race” perspective, which refers the development of the defense mechanism against each other (Jander, 2014; Kergoat, 2016; Endara et al., 2017).
Plants respond and prime the herbivore attack in diverse ways. Biosynthesis of various secondary metabolites is one of the core mechanism in plant to prevent and resist to the herbivory (Wu and Baldwin, 2010). On the other hand, herbivores also adapt to the defense mechanism. For example, herbivore can sequester and/or detoxify the plant secondary metabolites (Petschenka and Agrawal, 2016). Specific herbivore could have additional specific detoxification of specific secondary metabolites (de Castro et al., 2018). As a consequence of the diversity of plant secondary metabolites and the other defense mechanisms, many herbivorous species have the narrow range of the host plant species (Bernays, 1989).
Biosynthesis of the secondary metabolites should consume and convert the primary metabolites, therefore there have been trade-off between plant growth and defense (Gatehouse, 2002). Thus, plant primes the herbivory with both “constitutive”
defense and “induced” defense (Gatehouse, 2002; Wu and Baldwin, 2010). Induced defense refers the defense mechanism which are triggered by the wounding and