저작자표시-비영리-변경금지 2.0 대한민국 이용자는 아래의 조건을 따르는 경우에 한하여 자유롭게
l 이 저작물을 복제, 배포, 전송, 전시, 공연 및 방송할 수 있습니다. 다음과 같은 조건을 따라야 합니다:
l 귀하는, 이 저작물의 재이용이나 배포의 경우, 이 저작물에 적용된 이용허락조건 을 명확하게 나타내어야 합니다.
l 저작권자로부터 별도의 허가를 받으면 이러한 조건들은 적용되지 않습니다.
저작권법에 따른 이용자의 권리는 위의 내용에 의하여 영향을 받지 않습니다. 이것은 이용허락규약(Legal Code)을 이해하기 쉽게 요약한 것입니다.
Disclaimer
저작자표시. 귀하는 원저작자를 표시하여야 합니다.
비영리. 귀하는 이 저작물을 영리 목적으로 이용할 수 없습니다.
변경금지. 귀하는 이 저작물을 개작, 변형 또는 가공할 수 없습니다.
약학석사 학위논문
관동화 유래 세스퀴테르펜 화합물의 MDA-MB-231 유방암 세포에 대한 항암 활성 연구
A sesquiterpenoid from the Farfarae Flos induces apoptosis of MDA-MB-231 human
breast cancer cells through inhibition of JAK-STAT3 signaling
2019년 8월
서울대학교 대학원 약학과 천연물과학 전공
장 혜 리
ABSTRACT
A sesquiterpenoid from Farfarae Flos induces apoptosis of MDA-MB-231
human breast cancer cells through inhibition of JAK-STAT3 signaling
Hyeri Jang Natural Products Science College of Pharmacy Master Course in the Graduate School Seoul National University
Triple-negative breast cancers (TNBCs) are hard-to-treat breast tumors with poor prognosis, which need to be treated by chemotherapy. Signal transducer and activator
promising compounds with metabolism that suppress phosphorylation or transcription of STAT3 in TNBC cells is important. Farfarae Flos is well known as a traditional medicine for treating inflammation. However, few studies have shown that sesquiterpenoids from Farfarae Flos have an anticancer effect. In this study, efficient separation methods and MTT assay were conducted to isolate an anticancer compound from Farfarae Flos against TNBC MDA-MB-231 cells. 7β-(3-Ethyl-cis- crotonoyloxy)-1α-(2-methylbutyryloxy)-3,14-dehydro-Z-notonipetranone (ECN), a compound isolated from Farfarae Flos showed a potent cytotoxic effect on MDA- MB-231 cells. ECN inhibited JAK–STAT3 signaling and suppressed the expression of STAT3 target proteins. It decreased expression of STAT3 downstream proteins including Bcl-2, Cyclin D1, and COX-2. In addition, ECN induced apoptosis through both extrinsic and intrinsic pathways. Furthermore, we investigated that ECN inhibited the growth of tumors by intraperitoneal administration in mice injected with MDA-MB-231 cells. Taken together, these results suggest that ECN isolated from Farfarae Flos can be an effective chemotherapeutic agent for breast cancer treatment.
Keyworkds: Farfarae Flos, sesquiterpenoid, anticancer, STAT3, Triple-negative breast cancers (TNBCs), MDA-MB-231 cells
Student Number: 2017-27649
CONTENTS
ABSTRACT ……… ……… Ⅰ CONTENTS ……… ………. Ⅲ LIST OF FIGURES … ……….. Ⅶ LIST OF TABLES ……….…Ⅹ LIST OF ABBREVIATION ……… ………. Ⅺ
Ⅰ. INTRODUCTION ………. 1
1. Triple-negative breast cancer (TNBC) ………...1
2. Signal transducer and activator of transcription 3 (STAT3) …2
3. Farfarae Flos………4
Ⅱ. MATERIALS & METHODS ……… 5
1. MATERIALS……….5
1.2 Chemicals and reagents………..5
1.3 Instruments……….6
1.4 Cell culture……….……….7
1.5 Animals………7
1.6 Antibodies………8
2. METHODS……….9
2.1 Extraction of Farfarae Flos………9
2.2 Sesquiterpenoids of Farfarae Flos using countercurrent chromatography (CCC) ……….9
2.3 Isolation via preparative-HPLC………..10
2.4 HPLC analysis ………..10
2.5 Identification of isolated compounds ………..10
2.6 Cell viability assay……….11
2.7 Luciferase reporter assay……….11
2.8 Observation of cell morphology………...12
2.9 Annexin V/PI staining ………..12
2.10 Western blot analysis………..13
2.11 Tumor xenograft study………...14
2.12 Statistical analysis ………..15
Ⅲ. RESULTS ………. 16
1. Isolation of sesquiterpenoids from Farfarae Flos……….16
2. Isolation and screening fractions from Farfarae Flos…………..18
3. Isolation of 7β-(3-Ethyl-cis-crotonoyloxy)-1α-(2- methylbutyryloxy)-3,14-dehydro-Z-notonipetranone (ECN) from Farfarae Flos ………23
4. Elucidation and determination of ECN………27
5. Effect of ECN on the cell viability in MDA-MB-231 cells………36
6. Inhibitory effect of ECN on STAT3 activity ……….37
7. Effect of ECN on STAT3 upstream signaling pathways…...……40
8. Effect of ECN on PI3K/AKT/mTOR signaling pathway……….42
9. Effect of ECN on STAT3 associated proteins………44
10. Effect of ECN on STAT3 downstream signaling………...46
13. Effect of ECN on induction of apoptosis in cancer cells………...51
14. Growth inhibition of MDA-MB-231 breast cancer xenografts by ECN in nude mice………...54
Ⅳ. DISCUSSION ………. 58
Ⅴ. CONCLUSION ………... 61
REFERENCES ……….. 62
ABSTRACT IN KOREAN ………. 67
LIST OF FIGURES
Figure 1. Signaling pathway of JAK
–STAT3 Figure 2. Pictures of Farfarae Flos
Figure 3. CCC-UV chromatogram of sesquiterpenoids fraction Figure 4. Preparative-HPLC chromatogram of
sesquiterpenoids fraction
Figure 5. HPLC-UV chromatogram of sesquiterpenoids fraction
Figure 6. Preparative-HPLC chromatogram of P18 Figure 7. HPLC-UV chromatogram of P18-2
Figure 8. Chemical structure of ECN
Figure 9. LC-ESI/MS chromatogram of P18-2 (ECN)
Figure 10.
1H NMR spectrum of P18-2 (ECN)
Figure 12. HSQC spectrum of P18-2 (ECN) Figure 13. HMBC spectrum of P18-2 (ECN) Figure 14. ROESY spectrum of P18-2 (ECN)
Figure 15. Cytotoxicity effect on ECN in MDA-MB-231 cells Figure 16. Effect of ECN on STAT3 activation in MDA-MB- 231 cells
Figure 17. Effect of ECN on STAT3 upstream signaling in MDA-MB-231 cells
Figure 18. Effect of ECN on PI3K/Akt/mTOR pathway in MDA-MB-231 cells
Figure 19. Effect of ECN on STAT3 associated proteins in MDA-MB-231 cells
Figure 20. Effect of ECN on downstream signal in MDA-MB- 231 cells
Figure 21. Induction of caspase-mediated apoptosis by ECN in
MDA-MB-231 cells
Figure 22. Cell proliferation effect on ECN in MDA-MB-231 cells
Figure 23. Effect of ECN on changes in cell morphology Figure 24. Effect of ECN on Annexin V and PI staining in MDA-MB-231 cells
Figure 25. Effect of ECN on tumor growth in xenografted nude mice
Figure 26. Protein expressions in tumor tissues
Figure 27. Proposed mechanism of anticancer effect of ECN
by mediating STAT3 signaling
LIST OF TABLES
Table 1. Inhibitory effect of fractions on the proliferation in MDA-MB-231 cells
Table 2. Inhibitory effect of P18 fraction on the proliferation in MDA-MB-231 cells
Table 3.
1H and
13C NMR assignment of P18-2 (ECN)
LIST OF ABBREVIATIONS
CCC Countercurrent chromatography COSY Correlation spectroscopy
DMEM Dulbecco’s modified Eagle’s medium
d Doublet
DPBS Dulbecco’s Phosphate buffered saline
DMSO Dimethyl sufoxide
EtOH Ethyl alcohol
ELSD Evaporative light scattering detector
ECN
7β-(3-Ethyl-cis-crotonoyloxy)-1α- (2-methylbutyryloxy)-3,14-dehydro-Z-
notonipetranone
FBS Fetal bovine serum
HER2 Human epidermal growth factor receptor type 2
HEPES
N-2-Hydroxyethylpiperazine-N-2-ethane
sulfonic acid
HSQC Heteronuclear single quantum coherence HMBC Heteronuclear multiple bond coherence
MeOH Methyl alcohol
MTT 2-(4,5-dimethylthiazol-2-yl)-2,5- diphenyltetrazoliumbromide NMR Nuclear magnetic resonance
s Singlet
t Triplet
ROESY
Rotating-frame nuclear overhauser effect spectroscopy
SD Standard deviation
SEM Standard error of the mean
STAT3
Signal transducer
and activator of transcription 3
TNBC Triple-negative breast cancer
Ⅰ. INTRODUCTION
1. Triple-negative breast cancer (TNBC)
Breast cancer is a cancer that forms in cells of the breast. It is the most common cancer and the leading cause of cancer-related death among women [1]. Researchers have identified hormonal, lifestyle, and environmental factors that may increase risk of breast cancer. However, it is not clear to define causes developing cancer [2, 3].
Although further improvements in cancer biology have allowed the development of systemic treatments, hormonal therapies, and target drugs, better understanding of breast cancer is needed to refine disease mechanisms and molecular characteristics to improve drug development and treatment approaches [4].
Breast cancer is a heterogeneous disease. Gene expression analysis identified breast cancer subtypes, including basal-like, human epidermal growth factor receptor type 2 (HER2) positive/estrogen receptor negative, luminal A, and luminal B [5]. Triple-negative breast cancer (TNBC) is defined as tumors that lack expression of estrogen receptor, progesterone receptor, and HER2. It appears in 12%
to 17% of women with breast cancer who cannot be treated with endocrine therapy or therapies targeted to HER2 [6]. In addition, the mortality rates appear to be increased for 5 years after diagnosis. Hence, it needs to have more studies on TNBC
2. Signal transducer and activator of transcription 3 (STAT3)
Signal transducers and activators of transcription (STAT) proteins were identified as transcription factors that were critical in mediating virtually all cytokine driven signaling. These proteins are latent in the cytoplasm and become activated through tyrosine phosphorylation which typically occurs through cytokine receptor associated kinases, Janus kinase (JAK), and growth factor receptor tyrosine kinases [8]. Phosphorylated STATs form homo- or heterodimers, enter the nucleus working coordinately with other transcription factors, and lead to increased transcriptional initiation [9, 10]. The STAT proteins especially STAT1, 3, and 5 are persistently tyrosine phosphorylated and activated that play an important role in controlling cell cycle progression and apoptosis [11, 12].
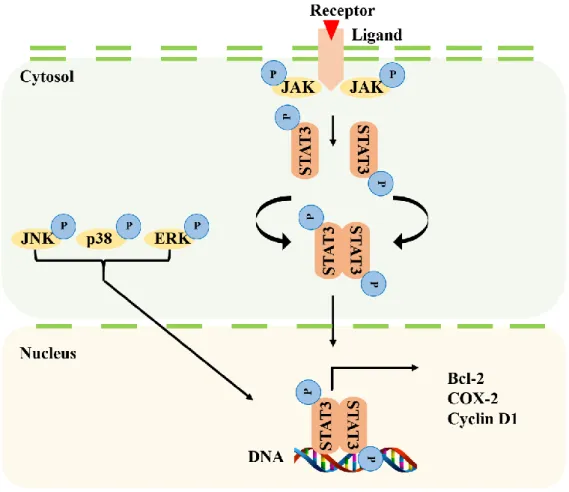
STAT3 is a crucial mediator of oncogenic signaling [13]. It is involved in a variety of biological functions, including cell growth, induction of apoptosis, and cell motility [14, 15]. In addition, studies have shown that the JAKs phosphorylate STAT3 in response to stimulation by cytokines or growth factor [16]. Therefore, JAK–STAT3 is a novel molecular target signaling for the development of cancer therapeutics [17].
Figure 1. Signaling pathway of JAK–STAT3
3. Farfarae Flos
Farfarae Flos is a perennial medicinal plant that belongs to the Asteraceae family. It is distributed in Korea, China, Asia, North Africa, and Europe. Dried flower buds of Tussilago farfara (Farfarae Flos) are well known as traditional medicine for treating severe cough, bronchitis, and asthma [18]. In addition, it is reported that Farfarae Flos contains sesquiterpenoids, terpenoids, steroids, and flavonoids [19-22]. In particular, sesquiterpenoids showed anti-inflammation, antioxidant, and neuroprotective activities [23-25].
Figure 2. Pictures of Farfarae Flos
Ⅱ. MATERIALS & METHODS
1. MATERIALS
1.1 Plant materials
Farfarae Flos was purchased from Omniherb (Yeongchun, Korea).
1.2 Chemicals and reagents
Chemical reagents used for extraction, countercurrent chromatography (CCC) and column chromatograph were of analytical grade. Acetonitrile (ACN), distilled water (DW) and methanol (MeOH) were purchased from Dae Jung Science (Seoul, Korea).
The HPLC-grade acetonitrile was supplied by J.T. Baker (Phillipsburg, NJ, USA).
Distilled water (NANO pure Diamond, Barnstead, USA) was used for all solutions and dilutions.
For cell culture, Dulbecco’s modified Eagles’ medium (DMEM), fetal bovine serum (FBS), penicillin-streptomycin solution, and HEPES buffer solution were purchased from GenDEPOT (Baker, TX, USA). Dulbecco’s phosphate buffered saline (DPBS), 3-(4,5-dimethylthiazol-2-yl)-2,5-diphenyltetrazolium
Sigma-Aldrich Co. (St. Louis, MO, USA). DMSO (purity >99.9%) for dissolving certain substrates for the cell culture were purchased from Sigma-Aldrich Co. (St.
Louis, MO, USA). DMSO (purity >99%) for MTT assay was obtained from Duksan Pharmaceutical Co. (Ansa, Korea).
1.3 Instruments
CCC were carried out with a model TBE-1000A (Tauto Biotech., Shanghai, China), including a six-port injection valve, a 60 mL sample loop, a Hitachi L-6200 pump and a Hitachi UV detector L-7400 (Hitachi, Tokyo, Japan). The CCC had three multilayer coil separation columns connected in series (3.0 inside diameter (ID) of tube, each volume of three coils: 330 mL, total volume: 1000 mL). The rotation speed of the apparatus ranged from 0 to 500 rpm.
HPLC analyses were carried out on a Hitachi L-6200 instrument equipped with Hitachi L-4000 UV detector (Hitachi, Tokyo, Japan) and SIL-9A auto injector (Shimadzu, Kyoto, Japan). A YMC-Triart C18 column for analyzing samples (4.6 mm x 150 mm ID, 5 μm particle size) was purchased from YMC Co. Ltd (Seongnam,
Korea). Preparative-HPLC separation was performed using a Hitachi L-7100 equipped with Hitachi L-4000 UV detector (Hitachi, Tokyo, Japan). A YMC-Triart C18 column for preparative-HPLC (100 mm x 250 mm ID, 10 μm particle size) was purchased from YMC Co. Ltd (Seongnam, Korea). The mass spectrometry (MS) analyses were performed using a Finniga LCQ ion trap mass spectrometer from
Thermo Finnigan (San Jose, CA, USA) equipped with an electrospray ionization (ESI) source. The nuclear magnetic resonance (NMR) analyses were recorded on Bruker Advance 600 spectrometers.
1.4 Cell culture
MDA-MB-231 human breast cancer cells were obtained from the Korea Cell Bank (Seoul, Korea). MDA-MB-231 cells were maintained in DMEM supplemented with 10% FBS and antibiotics (penicillin 100 μg/mL and streptomycin 100 μg/mL) at 37 ℃ in 5% CO2 incubator.
1.5 Animals
Animal care experimental procedures were conducted in accordance with the procedures and guidelines approved by the Daegu-Gyeongbuk Medical Innovation Foundation Institutional Animal Care and Use committee [DGMIF-18010902-00].
Female BALB/c nude mice at the age of 7 weeks were purchased from the Central Animal Laboratory Inc. (Seoul, Korea).
1.6 Antibodies
The primary antibodies for cleaved caspase 3, p-STAT3 (Tyr 705), p-EGRF, p-JAK1, JAK2, p-Akt, p-mTOR and mTOR were from Abcam (Cambridge, MA, USA). The primary antibodies for pro caspase 3, pro caspase 8, STAT3, β-actin, EGFR, Akt, p- JNK, JNK, p-Erk, Erk, p-p38, p38, COX-2 and goat secondary antibodies were from Santa Cruz Biotechnology (Santa Cruz, CA, USA). The primary antibodies for p- STAT3 (Ser 727), cleaved caspase 8, p-JAK2, p-Src, Src, Bcl-2, p-pi3k and pi3k were from Cell Signaling Technology (Beverly, MA, USA). The primary antibodies for PARP, JAK1, SHP1, SHP2, Cyclin D1, PCNA, rabbit and mouse secondary antibodies were from GeneTex (Irvine, CA, USA).
2. METHODS
2.1 Extraction of Farfarae Flos
Dried and chopped Farfarae Flos (2.4 kg) was extracted with 55% acetonitrile (3 x 5
L) by ultrasonication at room temperature for 12 h. After filtration, the extract was stored in a refrigerator (4 ℃) for the subsequent CCC separation.
2.2 Sesquiterpenoids of Farfarae Flos using countercurrent chromatography (CCC)
CCC was filled with n-Hex as the upper phase (the stationary phase). The extract of Farfarae Flos as lower phase (the mobile phase) was pumped into the system at a flow rate of 15 mL/min while the columns were rotating at a speed of 455 rpm. The UV detection system was performed at 235 nm and 2.5 absorbance units. After the extract was injected, 55% acetonitrile was pumped into the system at the same flow rate. When the UV signal decreased, 100% acetonitrile was pumped into the column.
The sesquiterpenoids fraction was collected according to the elution profile and analyzed by HPLC-UV. The fraction was evaporated under reduced pressure and the dried fraction was stored in a refrigerator (4 ℃) for the further separation.
2.3 Isolation via preparative-HPLC
A YMC-Triart C18 column for analyzing samples (4.6 mm x 150 mm ID, 5 μm particle size) was used to isolate and purify the compound. The sesquiterpenoids fraction was dissolved in MeOH and injected into the preparative-HPLC to separate 18 fractions (P1–P18-3). The preparative-HPLC conditions were as follows: distilled water (A) and acetonitrile (B), gradient: 0–35 min (60–95% B); 35–36 min (95–100%
B) and then washed with 100% B for 4 min at a flow rate of 4 mL/min. The UV detection was conducted at 235 nm.
2.4 HPLC analysis
A YMC Triart C18 column (4.6 mm x 150 mm ID, 5 μm particle size) was used to analyze the extract, sesquiterpenoids fraction (CCC), sub-fractions (Preparative- HPLC), and compounds at the last separation step. The injection volume was 20 μL.
For analysis of each separation step, the mobile phase was optimized with distilled water (A) and acetonitrile (B). The HPLC condition was as follows: 0–25 min (45–
95% B); 25–27.5 min (95–100% B) and then equilibrated with 100% B for 5 min at a flow rate of 1.25 mL/min. The column was at room temperature and the UV detection was conducted at 220 nm.
2.5 Identification of an isolated compound
An isolated compound was analyzed with HPLC coupled with electrospray ionization source (ESI-MS) for molecular weight. In addition, structures in the compound dissolved in CDCl3 were identified by comparing 1H, 13C, and two- dimensional NMR spectra with references (Bruker Advance 600-MHz, National Center for Interuniversity Research Facilities at Seoul National University, Seoul, Korea).
2.6 Cell viability assay
Cell viability was measured by MTT assay. The cells were seeded into 96-well plates at a density of 104 cells/well and maintained at 37 ℃ in a humidified 5% CO2
incubator for 24 h. The compounds were added to each well and the cells were incubated for 0–48 h. The MTT solution (0.5 mg/mL) was added to each well and then incubated for 2 h. Following removal of media, the formazan crystals were dissolved in 100 μL DMSO. The cell viability was assessed by measuring the absorbance at 595 nm wavelength using an Emax microplate reader (Molecular Devices, CA, USA). The relative cell viability was calculated and compared with the absorbance of the untreated control group. All experiments were performed in triplicate.
2.7 Luciferase reporter assay
The cells were plated in 24-well plates at a density of 1105 cells/well and incubated at 37 ℃ in a humidified 5% CO2 incubator. After 24 h, the cells were transiently transfected with pstat3-Luc reporter vector in the presence of pCMV- Luc vector using transfection reagent (Intron Biotechnology, Seoul, Korea). At 24 h post-transfection, the cells were treated with ECN for 24 h. Luciferase assay was performed using the dual luciferase reporter assay system (Promega, Madison, WI, USA). The luminescence signal was measured using a luminometer (MicroLumat Plus, Berthold Technologies, Dortmund, Germany).
2.8 Observation of cell morphology
The cells were plated in 12-well plates at a density of 5105 cells/welland incubated at 37 ℃ in a humidified 5% CO2 incubator for 24 h. The cells were treated with the compounds for 24 h in different doses and washed with DPBS before being fixed with 70% ethanol for 15 min. The cells were rewashed with DPBS. Then, the cells were viewed with a CKX41 fluorescence microscope (Olympus, Tokyo, Japan) at a magnification of 200 x.
2.9 Annexin V/PI staining
Apoptotic cells were differentiated from viable or necrotic cells using a combined staining of Annexin V and propidium iodide (PI). To examine the apoptosis inducing potential of compounds, flow cytometry based Annexin V staining was performed to
detect the externalization of phosphatidylserine. The cells were seeded into plate 6- well plates at a density of 106 cells/well and maintained at 37 ℃ in a humidified 5%
CO2 incubator for 24 h. After treatment with the compounds 24h in different doses, adherent and floating cells were collected, washed with DPBS, and subsequently centrifuged. The cells were suspended in 1 x binding buffer and stained with Annexin
V and PI according to the manufacturer’s directions (BD Biosciences, San Diego, CA, USA). After incubation for 15 min at room temperature in the dark, the cells were analyzed with flow cytometry using Becton Dickinson FACS Calibur (BD Biosciences, San Diego, CA, USA) to estimate the population of apoptotic cells.
2.10 Western blot analysis
The cells were seeded at a density of 106 cells/well in 6-well plates and treated with the compounds for the indicated times and doses. After incubation, the adherent and floating cells were collected, washed with DPBS, and centrifuged. Whole cell lysates were prepared using a lysis buffer [20 mM HEPES (pH 7.6), 350 mM NaCl, 20%
glycerol, 0.5 mM EDTA, 0.1 mM EGTA, 1% NP-40, 50 mM NaF, 0.1 mM DTT, 0.1 mM PMSF and protease inhibitor cocktail] for 30 min on ice. The lysates were centrifuged at 15,000 rpm for 10 min. Nuclear extracts were prepared using a lysis buffer [10 mM HEPES (pH 7.9), 10 mM KCl, 0.1 mM EDTA, 0.1 mM EGTA, 1 mM DTT, 1 mM PMSF and protease inhibitor cocktail] for 15 min on ice. Then, 10%
NaCl, 1 mM EDTA, 1 mM EGTA, 1 mM DTT, 1 mM PMSF and protease inhibitor cocktail] and centrifuged at 15,000 rpm for 10 min. The tumor was homogenized and lysed in T-PER tissue protein extraction reagent (Thermo Fisher Scientific Inc., Rockford, IL, USA). The extract was centrifuged at 15,000 rpm for 10 min at 4 ℃.
The protein concentration was estimated using a Bradford reagent (Bio-Rad Laboratories Inc., CA, USA). An equal amount (20-30 μg) of protein was loaded on 8–12% SDS-polyacrylamide gels and transferred using wet method to nitrocellulose membrane. After being blocked with 5% skim milk, the membrane was incubated at 4 ℃ overnight with specific primary antibodies. The membrane was washed and incubated at room temperature for 1 h with secondary antibodies conjugated with horseradish peroxidase. Finally, the blot was developed using a chemiluminescence kit (Ab Frontier, Seoul, Korea) and the immunoreactive band on the blot were visualized using a LAS-1000 image analyzer (Fuji Photo Film Co., Ltd., Tokyo, Japan). Densitometry was performed using ImageJ analysis software (Version 1.52, NIH, Bethesda, MD, USA).
2.11 Tumor xenograft study
MDA-MB-231 cells were subcutaneously injected into the right flanks of the mice.
When the tumor volume reached around 100 mm3, mice were randomly divided into treatment and control groups (n = 10/group). The animals were intraperitoneally treated with ECN (1 mg/kg) every 2 days, whereas control animals were treated with an equal volume of DPBS. The body weight and tumor size were measured every 2
days. The tumor volume was determined by caliper measurements and calculated using the following formula: {length x (width)2}/2. After 21 days of treatment, the mice were sacrificed, the tumors were removed and weighed. Then, the tumors were immediately frozen in liquid nitrogen for further protein isolation.
2.12 Statistical analysis
In vitro data were presented as the mean ± the standard deviation (SD) from three different experiments. In vivo data were presented as the mean ± the standard error of the mean (SEM). An analysis of variance (ANOVA) procedures were used for the statistical analysis of multiple comparisons. P values were considered statistically significant [*P < 0.05; **P < 0.01; ***P < 0.001].
Ⅲ. RESULTS
1. Isolation of sesquiterpenoids from Farfarae Flos
The dried and chopped Farfarae Flos (2.4 kg) were extracted with 55% acetonitrile (3 x 5 L) by ultrasonication at room temperature for 12h [26]. After filtering the extract, CCC was filled with n-hexane as the upper phase (the stationary phase). The extract was used as lower phase (the mobile phase) and pumped into the system at a flow rate of 15 mL/min while the columns were rotating at a speed of 455 rpm. The UV system detection was performed at 235 nm and 2.5 absorbance units. After the extract was injected, 55% acetonitrile was pumped into the system at the same flow rate. When UV signal decreased, 100% acetonitrile was pumped into the column.
The sesquiterpenoids fraction was collected according to the elution profile and analyzed by HPLC-UV. The fraction was evaporated under reduced pressure (9.45 g, 0.4% yield). The dried fraction was stored in a refrigerator (4 ℃) for the further separation.
Figure 3. CCC-UV chromatogram of sesquiterpenoids fraction
The n-hexane-acetonitrile-distilled water solvent system was separately pumped into the CCC column; stationary phase: n-hexane; mobile phase: distilled water and acetonitrile. The flow rate was 15 mL/min and the rotation speed was 455 rpm monitored with UV detection at 235 nm. (A)The sesquiterpenoids fraction was obtained from 55% acetonitrile extract.
2. Isolation and screening fractions from Farfarae Flos
The sesquiterpenoids fraction (9.45 g) was dissolved in MeOH and injected into the preparative-HPLC to separate 18 fractions (P1–P18). The preparative-HPLC condition was described in method section. The representative preparative-HPLC chromatogram is shown in figure. 4.
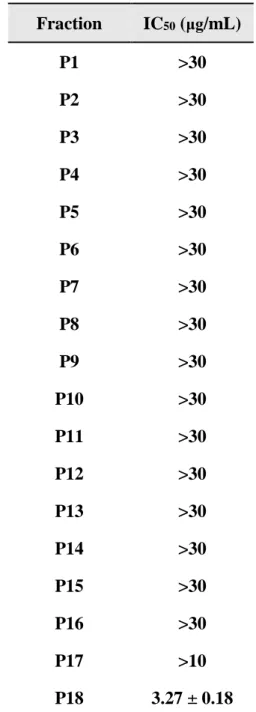
The fractions obtained from preparative-HPLC were tested with MTT assay to screen cell viability in MDA-MB-231 cells. All fractions were tested with various concentrations and compared with a control (Table 1). The P18 sub-fraction showed the most potent anticancer effects that IC50 value was 3.27 ± 0.18 μg/mL. Hence, further separation was performed on P18 fraction to separate and purify the compounds.
Figure 4. Preparative-HPLC chromatogram of sesquiterpenoids fraction The sesquiterpenoids fraction was analyzed using preparative- HPLC column.
The stationary phase was distilled water. The mobile phase was acetonitrile. The flow rate was 4 mL/min employed YMC-Triart C18 column (100 mm x 250 mm ID, 10 μm particle size) and monitored with UV detection at 235 nm. The gradient system was illustrated in method section.
Figure 5. HPLC-UV chromatogram of sesquiterpenoids fraction
The sesquiterpenoids fraction was analyzed using HPLC column. The stationary phase was distilled water. The mobile phase was acetonitrile. The flow rate was 1.25 mL/min YMC-Triart C18 column (4.6 mm x 150 mm ID, 5 μm particle size) and monitored with UV detection at 220 nm. The gradient system was illustrated in method section.
Table 1. Inhibitory effect of fractions on the proliferation in MDA-MB-231 cells
Fraction IC
50(
μg/mL)
P1 >30
P2 >30
P3 >30
P4 >30
P5 >30
P6 >30
P7 >30
P8 >30
P9 >30
P10 >30
P11 >30
P12 >30
P13 >30
P14 >30
P15 >30
P16 >30
P17 >10
P18 3.27 ± 0.18
The cells were pretreated with the different doses of all the fractions. Cell viability was determined by MTT assay after 24 h samples treatment. Data were derived from three independent experiments and expressed as mean ± SD.
3. Isolation of 7β-(3-Ethyl-cis-crotonoyloxy)-1α-(2- methylbutyryloxy)-3,14-dehydro-Z-notonipetranone (ECN) from Farfarae Flos
The P18 sub-fraction (66 mg) was dissolved in MeOH and injected into the preparative-HPLC to purify compound. The fraction was separated into 3 fractions (P18-1–P18-3). The preparative-HPLC conditions was described in method section.
The representative preparative-HPLC chromatogram is shown in figure. 5.
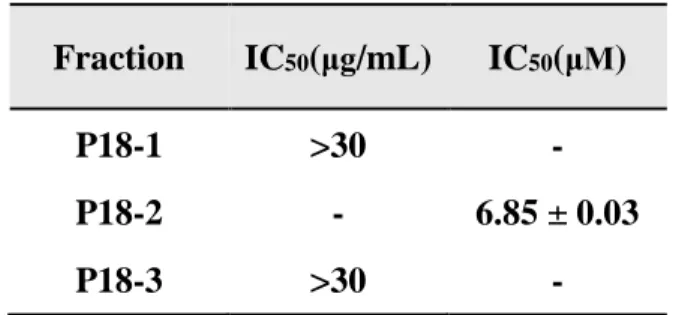
The fractions obtained from preparative-HPLC were tested with the MTT assay to screen cell viability in MDA-MB-231 cells. P18-1 and P18-3 were tested with various doses. P18-2 was tested with 1, 2.5, 5, and 10 μM compared with a control (Table 2). The results indicated that P18-2 showed the most valuable anticancer effect with IC50 value 6.85 ± 0.03 μM.
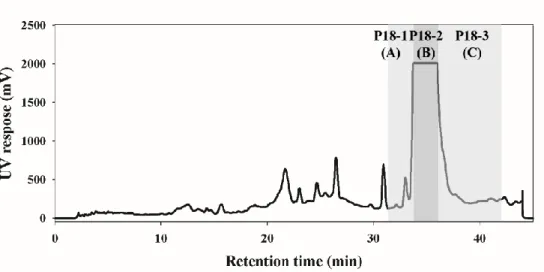
Figure 6. Preparative-HPLC chromatogram of P18
The sub-fraction P18 was purified using preparative-HPLC column. (A) Designated as P18-1 was collected from 31 to 32 min. (B) Designated as P18-2 was collected from 33 to 35 min. This fraction was selected as the most potential compound. (C) Designated as P18-3 was collected from 36 to 42 min. The stationary phase was distilled water. The mobile phase was acetonitrile. The flow rate was 4 mL/min employed YMC-Triart C18 column (100 mm x 250 mm ID, 10 μm particle size) and monitored with UV detection at 235 nm. The gradient system was illustrated in method section.
Figure 7. HPLC-UV chromatogram of P18-2
The compound 18-2 was analyzed using HPLC column. The stationary phase was distilled water. The mobile phase was acetonitrile. The flow rate was 1.25 mL/min YMC-Triart C18 column (4.6 mm x 150 mm ID, 5 μm particle size) and monitored with UV detection at 220 nm. The gradient system was illustrated in method section.
Table 2. Inhibitory effect of P18 fraction on the proliferation in MDA-MB-231 cells
Fraction IC
50(
μg/mL) IC
50(
μM) P18-1 >30 - P18-2 - 6.85 ± 0.03 P18-3 >30 -
The cells were pretreated with the different doses of all the fractions. The cell viability was determined by MTT assay after 24 h samples treatment. Data were derived from three independent experiments and expressed as mean ± SD.
4. Elucidation and determination of ECN
The compound, P18-2, was analyzed by HPLC-UV and HPLC-MS. In addition, the chemical structure in the compound was determined based on the 1D/2D NMR data.
P18-2 obtained as colorless oil. Its molecular formula was determined to be C26H38O5 based on ESI-MS at m/z 453.3 [M+Na]+ and NMR analyses (Fig. 9).
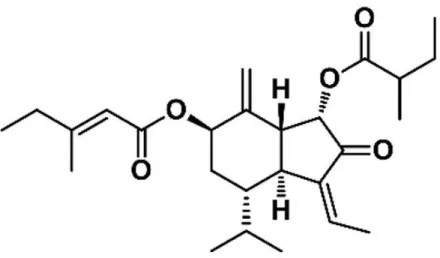
According to the 1H NMR (CDCl3, 600 MHz), the compound showed signal at δ 5.52 (1H, d, J= 4.0 Hz), δ 2.79 (1H, m), δ 2.03 (1H, m), δ 1.55 (1H, m), δ 2.31 (1H, m), δ 5.51 (1H, d, 3.3), δ 2.70 (1H, m), δ 6.17 (1H, s), δ 4.81 (1H, s), δ 2.02 (1H, m), δ 0.98 (3H, d, 6.2), δ 0.88 (3H, d, 7.2), δ 6.39 (1H, q, 7.2), δ 2.18 (3H, d, 7.2), δ 5.63 (1H, s), δ 2.18 (2H, m), δ 1.07 (3H, t, 7.2), δ 2.15 (3H, s), δ 2.40 (1H, m), δ 1.65 (2H, m), δ 0.90 (3H, t, 7.2), δ 1.13 (3H, d, 7.2) ppm (Fig. 10 and Table 3). The 13C NMR spectrum of compound showed signals at δ 72.5 (C-1α), δ 200.3 (C-2), δ 139.3 (C- 13β), δ 44.9 (C-4α), δ 41.1 (C-5β), δ 29.9 (C-6α), δ 73.5 (C-7α), δ 141 (C-8), δ 46 (C-9β), δ 112.8 (C-10), δ 27.7 (C-11), δ 27 (C-12), δ 15.7 (C-13), δ 137 (C-14), δ 15.3 (C-15), δ 166.1 (C-1’), δ 114.7 (C-2’), δ 162.3 (C-3’), δ 34 (C-4’), δ 12.1 (C- 5’), δ 19.1 (C-6’), δ 175.7 (C-1’’), δ 40.6 (C-2’’), δ 11.6 (C-3’’), δ 16.7 (C-4’’), δ 21.5 (C-5’’) ppm (Fig. 11 and Table 3). The correlation with H and C was determined by HMBC spectrum (Fig. 13). The relative configuration was determined by the ROESY spectrum (Fig. 14). Comparing NMR data with the literature, the chemical structure of P18-2 was defined as 7β-(3-Ethyl-cis-crotonoyloxy)-1α-(2-
Figure 8. Chemical structure of ECN
The isolated compound was determined by 1D/2D NMR and MS spectra.
P 18-2 was called ECN.
Figure 9. LC-ESI/MS chromatogram of P18-2 (ECN)
P 18-2 (ECN) generated the protonated ions [M+Na]+ at m/z 453.3 in positive ion mode. The compound has maximum UV absorption at 220 nm.
[M+Na]
+
=453.3
Table 3. 1H and 13C NMR assignment of P18-2 (ECN) (δ in ppm, J in Hz, 600 and 150 MHz in CDCl3)
Position
δH(J in Hz)
δC1α 72.5
1β 5.52 (1H, d, 4.0)
2 200.3
3β 139.3
4α 2.79 (1H, m) 44.9
5β 2.03 (1H, m) 41.1
6α 1.55 m (1H, m) 29.9
6β 2.31 m (1H, m)
7α 5.51 (1H, d, 3.3) 73.5
8 141
9β 2.70 (1H, m) 46
10 6.17 (1H, s) 112.8
10' 4.81 (1H, s)
11 2.02 (1H, m) 27.7
12 0.98 (3H, d, 6.2) 27 13 0.88 (3H, d, 7.2) 15.7 14 6.39 (1H, q, 7.2) 137 15 2.18 (3H, d, 7.2) 15.3
1' 166.1
2' 5.63 (1H, s) 114.7
3' 162.3
4' 2.18 (2H, m) 34
5' 1.07 (3H, t, 7.2) 12.1
6' 2.15 (3H, s) 19.1
1" 175.7
2" 2.40 (1H, m) 40.6
3" 1.65 (2H, m) 11.6
4" 0.90 (3H, t, 7.2) 16.7
5" 1.13 (3H, d, 7.2) 21.5
Figure 10. 1H NMR spectrum of P18-2 (ECN)
Figure 11. 13C NMR spectrum of P18-2 (ECN)
Figure 12. HSQC spectrum of P18-2 (ECN)
Figure 13. HMBC spectrum of P18-2 (ECN)
Figure 14. ROESY spectrum of P18-2 (ECN)
5. Effect of ECN on the cell viability in MDA-MB-231 cells
MDA-MB-231 cells were exposed to various concentration of ECN (0–15 μM) for 24 h and the cell viability was evaluated using the MTT assay. This result indicated that ECN significantly inhibited cell viability in a dose-dependent manner (Fig. 15).
Figure 15. Cytotoxicity effect on ECN in MDA-MB-231 cells
The cells were pretreated with the indicated doses of ECN for 24 h. Cell viability was determined by MTT assay. Data were derived from three independent experiments and expressed as mean ± SD. Significant difference compared with the control groups [*P < 0.05; **P < 0.01; ***P < 0.001].
6. Inhibitory effect of ECN on STAT3 activity
To determine the effect of ECN on STAT3 activation, whole MDA-MB-231 cells lysates and nucleus lysates were extracted and evaluated by western blot analyses.
The protein level of phosphorylation of STAT3 at serine and total STAT3 did not reduce. However, ECN significantly inhibited phosphorylation of STAT3 at tyrosine 705 in MDA-MB-231 cells in a dose and time-dependent manner (Fig. 16A).
Phosphorylation of tyrosine 705 promotes STAT3 dimerization and translocation to the nucleus and is critical for STAT3 activation. As shown in Fig. 16B, ECN inhibited STAT3 translocation to the nucleus. These results suggested that ECN suppressed activation of STAT3 in cytoplasm and the nucleus of MDA-MB-231 cells.
In addition, luciferase reporter gene assay was performed to detect STAT3 transcriptional activity. This result indicated that ECN suppressed STAT3 transcriptional activity in MDA-MB-231 cells (Fig. 16C).
A
B C
Figure 16. Effect of ECN on STAT3 activation in MDA-MB-231 cells
The cells were treated with the indicated concentrations (right panel) and times (left panel) of ECN. (A) The cell lysates were western blotted to determine p-STAT3 and STAT3 protein levels. (B) The nuclear extracts were western blotted to determine p- STAT3 and STAT3 protein levels.
(C) Cells were transfected with the pstat3-Luc reporter vector and treated with ECN for 24 h. The luciferase assay was performed using the dual luciferase reporter assay system. Data were derived from three independent experiments and expressed as mean ± SD. Significant difference compared with the control groups [*P < 0.05; **P
< 0.01; ***P < 0.001].
7. Effect of ECN on STAT3 upstream signaling pathways
To determine whether inhibitory effect of ECN on STAT3 phosphorylation is associated with the suppression of upstream signaling pathways, the expression levels of phosphorylation EGFR and JAKs proteins in MDA-MB-231 cells were examined. As shown in Fig. 17A, ECN did not reduce the protein levels of phospho- EGFR. However, ECN decreased the phosphorylation of JAK1, JAK2, and Src. In addition, the effect of ECN on various protein tyrosine phosphatases (PTPs), related to regulation of the JAK and STAT3 signaling was observed. The expression of PTPs, SHP-1, and SHP-2 protein was not affected by ECN (Fig. 17B). These results suggest that ECN inhibited activation of JAK–STAT3 signaling.
A B
Figure 17. Effect of ECN on STAT3 upstream signaling in MDA-MB-231 cells (A) The cells were treated with indicated concentrations of ECN for 8 h and the inhibitory effect of ECN on phosphorylation of EGFR and STAT3 was evaluated by western blot analysis. (B) The inhibitory effect of ECN on phosphorylation of JAKs and PTPs was assessed by western blot analysis.
8. Effect of ECN on PI3K/AKT/mTOR signaling pathway
Inhibitory effect of ECN on PI3K, Akt, and mTOR by ECN was investigated in MDA-MB-231 cells. Phosphorylation levels of PI3K, Akt, and mTOR were suppressed by ECN in a dose-dependent manner (Fig. 18). These results suggested that ECN inhibited the activity of PI3K/AKT/mTOR signaling and suppressed cell proliferation in MDA-MB-231 cells.
Figure 18. Effect of ECN on PI3K/Akt/mTOR pathway in MDA-MB-231 cells The cells were treated with indicated concentrations of ECN for 8 h and the inhibitory effect of ECN on phosphorylation of PI3K, Akt, and mTOR was evaluated by western blot analysis.
9. Effect of ECN on STAT3 associated proteins
STAT3 associated proteins, including JNK, ERK, and p38 were important regulatory proteins involved in cell growth and apoptosis. To determine the effect of ECN on the activation of STAT3 associated proteins, p-JNK, JNK, p-Erk, Erk, p-p38, and p- p38 were investigated in MDA-MB-231 cells. The phosphorylation levels of JNK, Erk, and p38 were increased dose-dependently at 8 h treatment with ECN (Fig. 19).
These results suggested that ECN was involved in MAPK signaling pathways that induced cell death.
Figure 19. Effect of ECN on STAT3 associated proteins in MDA-MB-231 cells The cells were treated with indicated concentrations of ECN for 8 h and the inhibitory effect of ECN on phosphorylation of JNK, Erk, and p38 was evaluated by western blot analysis.
10. Effect of ECN on STAT3 downstream signaling
STAT3 activation has been reported to regulate the expression of various gene involved in cell proliferation, survival, angiogenesis, cell cycle progression and programmed cell death. Therefore, the effect of ECN on STAT3 target genes in MDA-MB-231 cells were assessed. The result suggested that protein levels of Bcl-2 associated with the anti-apoptotic protein, COX-2 involved in metastasis, and cell cycle regular Cyclin D1 were reduced by treatment of ECN (Fig. 20).
Figure 20. Effect of ECN on downstream signal in MDA-MB-231 cells
The cells were treated with indicated concentrations of ECN for 24 h and the inhibitory effect of ECN on phosphorylation of Bcl-2, COX-2 and Cyclin D1 was evaluated by western blot analysis.
11. Effect of ECN on induction of caspase-mediated apoptosis
To demonstrate anti-proliferative effect of ECN, proteins implicated in apoptosis were evaluated using western blotting. The activation levels of cleaved caspase 3, cleaved caspase 8, and cleaved PARP were increased in a dose-dependent manner after 24 h of ECN treatment (Fig. 21). These results suggested that ECN induced apoptosis through both extrinsic pathways mediated by caspase 8 activation and intrinsic pathways mediated by caspase 3 and PARP in MDA-MB-231 cells.
Figure 21. Induction of caspase-mediated apoptosis by ECN in MDA-MB-231 cells
The cells were treated with indicated concentrations of ECN for 24 h and the inhibitory effect of ECN on caspase 3, caspase 8, and PARP was evaluated by western blot analysis.
12. Effect of ECN on cell proliferation
MDA-MB-231 cells were exposed to various concentrations of ECN (0–10 μM) for 6, 12, 24, and 48 h and cell proliferation was evaluated using MTT assay. ECN significantly inhibited cell proliferation and induced cytotoxic effect in a dose and time-dependent manner (Fig. 22).
Figure 22. Cell proliferation effect on ECN in MDA-MB-231 cells
The cells were pretreated with the indicated doses of ECN different times. The cell proliferation was determined using MTT assay. Data were derived from three independent experiments and expressed as mean ± SD. Significant difference compared with the control groups [*P < 0.05; **P < 0.01; ***P < 0.001].
12. Effect of ECN on changes in cell morphology
Morphological changes of apoptosis and cytotoxic effect induced by ECN were observed by microscope. When apoptosis occurs in cells, the cells undergo cell rounding, cytoplasmic condensation, and cell fragmentation (Fig. 23).
Figure 23. Effect of ECN on changes in cell morphology
The cells were treated with indicated concentrations of ECN for 24 h. The cells were washed with DPBS before being fixed with 70% ethanol for 15 min and rewashed with DPBS. The cells were observed with a microscope at a magnification of 200 x.
13. Effect of ECN on induction of apoptosis in cancer cells
For the quantitative investigation of ECN on apoptosis, MDA-MB-231 cells were incubated with ECN for 24 h and the cells were analyzed by means of flow cytometry with Annexin V and propidium iodide (PI) staining (Fig. 24A). The quantification of Annexin V binding to the cell membrane is a useful tool in detecting apoptotic cells. PI is a fluorescent dye binding to DNA used for identifying dead cells.
Comparing with the control group, ECN triggered early apoptosis in MDA-MB-231 cells in a dose-dependent manner (Fig. 24B). In addition, the rates of dead cells including early and late apoptosis increased markedly. The values of dead cell were 13.8%, 26.0%, 44.8%, and 50.1% (Fig. 24C).
A
B C
Figure 24. Effect of ECN on Annexin V and PI staining in MDA-MB-231 cells (A) The cells were treated with the indicated concentrations of ECN for 24 h and analyzed by flow cytometry assay in which 1,000 events were counted per sample.
The lower right quadrant represented early apoptosis and the upper right quadrant represented late apoptosis. (B) The percentage of live, early apoptotic, late apoptotic, and necrotic cells was calculated. (C) The values of dead cells included early and late apoptosis. Data were derived from three independent experiments and expressed as mean ± SD. Significant difference compared with the control groups [*P < 0.05; **P < 0.01; ***P < 0.001].
14. Growth inhibition of MDA-MB-231 breast cancer xenografts by ECN in nude mice
To confirm the anti-tumor effect of ECN in vivo, a xenograft assay of MDA-MB- 231 cells was performed in mice (n = 10/group). BALB/c nude mice were injected with MDA-MB-231 cells and intraperitoneally administered 1 mg/kg ECN for 21 days. The average tumor size of mice treated with 1 mg/kg ECN was lower than control mice (Fig. 25A). In addition, mice treated with 1 mg/kg ECN resulted in a reduction in the tumor weight (0.39 ± 0.07 g) compared with the control mice tumor weight (0.67 ± 0.08 g) (Fig. 25C). However, the administration of ECN did not have an effect on the overall body weight during the experimental period (Fig. 25B).
These results indicated the administration of ECN inhibited the growth of MDA- MB-231 breast cancer xenograft tumors. Additionally, western blot was performed using specific antibodies against p-STAT3 and STAT3 in tumor tissues. The administration of ECN resulted in decrease in the expression of p-STAT3 consistent with the in vitro assay (Fig. 26). These results suggested that ECN suppressed tumor growth and inhibited STAT3 activation in MDA-MB-231 breast cancer xenograft tumors.
A B
C
Figure 25. Effect of ECN on tumor growth in xenografted nude mice
(A) The BALB/c nude mice were injected with MDA-MB-231 cells and intraperitoneally administered with 1 mg/kg of ECN for 21 days (every 2 days).
Tumor sizes were measured with a caliper every 2 days. (B) The body weight changes were monitored during the test period. (C) The tumor weights were measured. Data were presented as mean ± the standard error of the mean (SEM).
Significant difference compared with the control groups [*P < 0.05; **P < 0.01;
***P < 0.001].
Figure 26. Protein expressions in tumor tissues
Tumor cell lysates were western blotted with antibodies against p-STAT3 and STAT3.
Figure 27. Proposed mechanism of anticancer effect of ECN by mediating STAT3 signaling
Ⅳ. DISCUSSION
Breast cancer is a leading cause of cancer death among females [1]. Its clinical progression is difficult to predict using the current prognostic factors and its treatment is therefore not as effective as it should be [27]. TNBC, which defines the absence of staining for the estrogen receptor, progesterone receptor, and HER2, is an aggressive cancer with poor survival rate regardless of stage [28, 29]. However, studies have shown that patients who receive chemotherapy were healed of TNBC [30].
STAT3 is a transcription factor which has been implicated as a constitutively active oncogene in TNBC. Studies have revealed that STAT3 has a key role in regulating invasion and metastasis [31]. Therefore, therapies targeting STAT3 are important and required for preventing TNBC metastasis [32]. In this study, the anticancer effect of sesquiterpenoid from Farfarae Flos in TNBC, MDA-MB-231 cells, was invested.
Activity-guided fractionation and purification processes were employed to identify the anticancer compound from Farfarae Flos. Dried and chopped Farfarae Flos was extracted with 55% acetonitrile and separated with various chromatographic techniques. The extract was fractionated into sesquiterpenoids
using preparative-HPLC. An isolated compound, P18-2, was identified by comparing spectra data (HPLC-UV, NMR, and MS) with literature to be 7β-(3-ethyl- cis-crotonoyloxy)-1α-(2-methylbutyryloxy)-3,14-dehydro-Z-notonipetranone (ECN).
ECN is an active sesquiterpenoid constituent of Farfarae Flos. Several studies revealed the biological activities of ECN. It has been reported that ECN exhibited neuroprotective effects against oxidative stress induced cell damage and dopaminergic neurodegeneration in mice [33]. ECN also demonstrated a significant inhibitory activity on NO production [34]. In addition, it inhibited against microsomal DGA1 derived from rat liver and human hepatocellular carcinoma HepG2 cell [35]. Numerous studies have shown inflammatory effects, however, there are no reports that ECN induced cell death and apoptosis in breast cancer cells.
Thus, we investigated the effect of ECN on cell death in MDA-MB-231 human breast cancer cells both in vitro and in vivo.
The results indicated that ECN suppressed STAT3 tyrosine phosphorylation.
ECN blocked nuclear translocation of STAT3, inducing cell death. Several upstream kinases, such as JAKs, Src, and EGFR are known to regulate STAT3 activation [36].
Thus, the inhibitory effect of ECN on activation of EGFR, JAK1, JAK2, and Src was investigated. ECN did not affect the protein levels of EGFR. However, phosphorylation of JAK1, JAK2 and Src proteins were affected by ECN. Moreover, ECN decreased expression of STAT3 downstream target genes, including Bcl-2, Cyclin D1, and COX-2 [37]. These results suggested that ECN inhibited JAK phosphorylation and STAT3 activation.
Furthermore, treatment of ECN resulted in the inhibition of cell proliferation and induction of apoptosis via cleaved caspase 3, cleaved caspase 8, and cleaved PARP activation, which means that ECN induced apoptosis in MDA- MB-231 cells through extrinsic and intrinsic apoptosis pathways. To confirm activation of apoptosis, cell morphology observation and a flow cytometry assay were employed. The phase of apoptosis was characterized by changes in cell morphology such as cell concentration and membrane blebbing [38]. After treatment of ECN, cells were observed as round, isolated, and membrane blebbing. In addition, the rates of dead cells including early apoptotic and late apoptotic cells were increased in flow cytometry analysis. Finally, an inhibitory effect of ECN on tumor growth in a breast xenograft model was evaluated. It was shown that the treatment of ECN decreased tumor sizes and tumor weights compared with the control group and ECN inhibited STAT3 activation in tumor tissues.
In conclusion, we separated ECN from Farfarae Flos. We demonstrated that ECN inhibited the JAK–STAT3 signaling pathway inducing apoptosis of TNBC MDA-MB-231 cells. These results suggested that ECN could be a therapeutic cancer candidate against MDA-MB-231 human breast cancer cells.
Ⅴ. CONCLUSION
In this study, efficient separation methods and an MTT assay were conducted to isolate an anticancer compound from Farfarae Flos. A compound–ECN–identified showed potent cytotoxic effect against MDA-MB-231 human breast cancer cells.
The study revealed that ECN inhibited JAK–STAT3 signaling and suppressed the expression of STAT3 target genes. In addition, ECN inducing apoptosis through both extrinsic and intrinsic pathways. Cell morphology and flow cytometry analysis results suggested that ECN caused an apoptotic effect dose- dependently against MDA-MB-231 cells.
Based on these results, ECN was intraperitoneally administered in mice injected with MDA-MB-231cells. It was demonstrated that ECN suppressed activation of STAT3 and inhibited the growth of tumors. Therefore, ECN can be an effective chemotherapeutic agent for breast cancer treatment.
REFERENCES
1. Torre L A, Bray F, Siegel R L, Ferlay J, et al., Global cancer statistics, 2012.
CA Cancer J. Clin., 2015. 65(2): p. 87-108.
2. Sasco A J, Kaaks R, and Little R E, Breast cancer: occurrence, risk factors and hormone metabolism. Expert Rev. Anticancer Ther., 2003. 3(4): p. 546- 562.
3. Madigan M P, Ziegler R G, Benichou J, Byrne C, et al., Proportion of breast cancer cases in the United States explained by well-established risk factors.
JNCI: Journal of the National Cancer Institute, 1995. 87(22): p. 1681-1685.
4. Ades F, Tryfonidis K, and Zardavas D, The past and future of breast cancer treatment from the papyrus to individualised treatment approaches.
ecancermedicalscience, 2017. 11: p. 746.
5. Carey L A, Perou C M, Livasy C A, Dressler L G, et al., Race, breast cancer subtypes, and survival in the Carolina Breast Cancer Study. JAMA, 2006.
295(21): p. 2492-2502.
6. Foulkes W D, Smith I E, and Reis-Filho J S, Triple-negative breast cancer.
N. Engl. J. Med., 2010. 363(20): p. 1938-1948.
7. Boyle P, Triple-negative breast cancer: epidemiological considerations and recommendations. Annals of oncology, 2012. 23(suppl_6): p. vi7-vi12.
2473.
9. Marrero M B, Schieffer B, Paxton W G, Heerdt L, et al., Direct stimulation of Jak/STAT pathway by the angiotensin II AT1 receptor. Nature, 1995.
375(6528): p. 247-250.
10. Vila-Coro A J, Rodríguez-frade J M, Martin De Ana A, MORENO-ORTÍZ M C, et al., The chemokine SDF-1α triggers CXCR4 receptor dimerization and activates the JAK/STAT pathway. The FASEB Journal, 1999. 13(13):
p. 1699-1710.
11. Yang E, Wen Z, Haspel R L, Zhang J J, et al., The linker domain of Stat1 is required for gamma interferon-driven transcription. Mol. Cell. Biol., 1999.
19(7): p. 5106-5112.
12. Yu C-L, Meyer D J, Campbell G S, Larner A C, et al., Enhanced DNA- binding activity of a Stat3-related protein in cells transformed by the Src oncoprotein. Science, 1995. 269(5220): p. 81-83.
13. Jing N and Tweardy D J, Targeting Stat3 in cancer therapy. Anticancer Drugs, 2005. 16(6): p. 601-607.
14. Song H, Wang R, Wang S, and Lin J, A low-molecular-weight compound discovered through virtual database screening inhibits Stat3 function in breast cancer cells. Proceedings of the National Academy of Sciences, 2005.
102(13): p. 4700-4705.
15. Pathak A K, Bhutani M, Nair A S, Ahn K S, et al., Ursolic acid inhibits STAT3 activation pathway leading to suppression of proliferation and chemosensitization of human multiple myeloma cells. Mol. Cancer Res.,
2007. 5(9): p. 943-955.
16. Liu L, Nam S, Tian Y, Yang F, et al., 6-Bromoindirubin-3′-oxime inhibits JAK/STAT3 signaling and induces apoptosis of human melanoma cells.
Cancer Res., 2011. 71(11): p. 3972-3979.
17. Zhao M, Jiang B, and Gao F-H, Small molecule inhibitors of STAT3 for cancer therapy. Curr. Med. Chem., 2011. 18(26): p. 4012-4018.
18. Zhao Z, Xiao P, Asteraceae. Encyclopedia of Medicinal Plants, World Publishing Corporation, 2009. Vol 3: p. 492-493
19. Zhao J, Evangelopoulos D, Bhakta S, Gray A I, et al., Antitubercular activity of Arctium lappa and Tussilago farfara extracts and constituents. J.
Ethnopharmacol., 2014. 155(1): p. 796-800.
20. KIKUCHI M and Suzuki N, Studies on the constituents of Tussilago farfara L. II. Structures of new sesquiterpenoids isolated from the flower buds.
Chem. Pharm. Bull. (Tokyo), 1992. 40(10): p. 2753-2755.
21. Wu D, Zhang M, Zhang C, and Wang Z, Flavonoids and phenolic acid derivatives from Flos Farfarae. China journal of Chinese materia medica, 2010. 35(9): p. 1142-1144.
22. Yaoita Y, Kamazawa H, and Kikuchi M, Structures of new oplopane-type sesquiterpenoids from the flower buds of Tussilago farfara L. Chem.
Pharm. Bull. (Tokyo), 1999. 47(5): p. 705-707.
23. Li W, Huang X, and Yang X-W, New sesquiterpenoids from the dried
24. Cho J, Kim H M, Ryu J-H, Jeong Y S, et al., Neuroprotective and antioxidant effects of the ethyl acetate fraction prepared from Tussilago farfara L. Biol. Pharm. Bull., 2005. 28(3): p. 455-460.
25. Lee K M, Kwon T Y, Kang U, Seo E K, et al., Tussilagonone-induced Nrf2 pathway activation protects HepG2 cells from oxidative injury. Food Chem.
Toxicol., 2017. 108: p. 120-127.
26. Song K, Lee K J, and Kim Y S, Development of an efficient fractionation method for the preparative separation of sesquiterpenoids from Tussilago farfara by counter-current chromatography. J. Chromatogr. A, 2017. 1489:
p. 107-114.
27. Bertucci F and Birnbaum D, Reasons for breast cancer heterogeneity. J.
Biol., 2008. 7 (6).
28. Irvin Jr W J and Carey L A, What is triple-negative breast cancer? Eur. J.
Cancer, 2008. 44(18): p. 2799-2805.
29. Bauer K R, Brown M, Cress R D, Parise C A, et al., Descriptive analysis of estrogen receptor (ER)‐negative, progesterone receptor (PR)‐negative, and HER2‐negative invasive breast cancer, the so‐called triple‐negative phenotype: a population‐based study from the California cancer Registry.
Cancer, 2007. 109(9): p. 1721-1728.
30. Gluz O, Nitz U, Harbeck N, Ting E, et al., Triple-negative high-risk breast cancer derives particular benefit from dose intensification of adjuvant chemotherapy: results of WSG AM-01 trial. Ann. Oncol., 2008. 19(5): p.
861-870.
31. Sansone P and Bromberg J, Targeting the interleukin-6/Jak/stat pathway in human malignancies. J. Clin. Oncol., 2012. 30(9): p. 1005-1014.
32. McDaniel J M, Varley K E, Gertz J, Savic D S, et al., Genomic regulation of invasion by STAT3 in triple negative breast cancer. Oncotarget, 2017.
8(5): p. 8226-8238.
33. Lee J, Song K, Huh E, Oh M S, et al., Neuroprotection against 6-OHDA toxicity in PC12 cells and mice through the Nrf2 pathway by a sesquiterpenoid from Tussilago farfara. Redox biology, 2018. 18: p. 6-15.
34. Jang H, Lee J W, Lee C, Jin Q, et al., Sesquiterpenoids from Tussilago farfara inhibit LPS-induced nitric oxide production in macrophage RAW 264.7 cells. Arch. Pharm. Res., 2016. 39(1): p. 127-132.
35. Park H R, Yoo M Y, Seo J H, Kim I S, et al., Sesquiterpenoids isolated from the flower buds of Tussilago farfara L. inhibit diacylglycerol acyltransferase. J. Agric. Food Chem., 2008. 56(22): p. 10493-10497.
36. Kundu J, Choi B Y, Jeong C-H, Kundu J K, et al., Thymoquinone induces apoptosis in human colon cancer HCT116 cells through inactivation of STAT3 by blocking JAK2-and Src‑mediated phosphorylation of EGF receptor tyrosine kinase. Oncol. Rep., 2014. 32(2): p. 821-828.
37. Carpenter R and Lo H-W, STAT3 target genes relevant to human cancers.
Cancers (Basel), 2014. 6(2): p. 897-925.
38. Coleman M L, Sahai E A, Yeo M, Bosch M, et al., Membrane blebbing
ABSTRACT IN KOREAN (국문 초록)
유방암은 여성에게 가장 많이 발생하고 치사율이 높은 암이다. 삼중 음성 유방암은 유방암의 한 종류로, 에스트로겐과 프로게스테론 수용체 가 음성이고 인간상피 성장인자 수용체 2형 유전자가 과 발현되지 않 는다. 이는 재발이 빠르고 치료가 어려워 항암화학요법 치료가 요구된 다. STAT3는 삼중 음성 유방암 세포에서 많이 발현되는 전사조절인자 로 종양형성, 암세포 침윤 및 전이에 관여한다고 알려져 있다. 따라서 삼중 유방암 세포 내 STAT3의 전사활성 및 인산화를 저해하는 화합 물 탐색과 생리기능 활성 연구는 중요하다.
관동은 국화과에 속하며, 유럽, 아시아 북아프리카에 널리 분포한다.
예로부터 관동의 꽃봉오리(관동화)는 약재로 사용되었으며 기침, 기관 지염, 천식치료에 처방되었다. 관동화는 sesquiterpenoids, terpenoids, steroids, flavonoids 와 같은 다양한 화합물을 많이 함유하고 있다. 그 중 sesquiterpenoid 계열의 화합물은 항산화, 항균, 신경보호의 효능 연구가 보고되어 있다. 그러나 관동화 화합물의 삼중 음성 유방 암세포 성장억제 효과에 관한 연구는 아직 보고된 바가 없다.
본 연구는 관동화 유래 sesquiterpenoid 화합물의 MDA-MB-231 유방암 세포에 대한 사멸 효과를 밝혔다. 관동화로부터 항암 효과를 갖 는 활성 물질을 발굴하고, 해당 활성 화합물의 암세포 성장 억제 효과 를 세포실험과 동물실험으로 입증하였다.
건조, 분쇄한 관동화를 55% 아세토나이트릴로 추출하고 향류 분배 크로마토그래피로 sesquiterpenoids 분획물을 얻었다. 이를
preparative-HPLC를 이용하여 18개로 분획하고 가장 세포독성이 높
은 분획물을 단일 화합물로 분리 정제하였다. 화합물의 NMR 및 MS 데이터를 문헌 값과 비교하여 7β-(3-Ethyl-cis-crotonoyloxy)-1 α-(2-methylbutyryloxy)-3,14-dehydro-Z-notonipetranone (ECN)임을 확인하였다.
ECN은 삼중 음성 유방암 MDA-MB-231 세포에 대해 항암 효과를 나타냈다. ECN은 유방암 MDA-MB-232 세포 내 JAK-STAT3 신호 전달을 억제하여 세포 성장 억제 및 사멸을 유도하였다. 또한, 암세포 가 이종 이식된 면역 결핍 생쥐에 ECN을 복강 투여하여 종양 성장 및 STAT 활성화 억제 효과를 확인하였다.
본 연구 결과를 종합하면, 관동화 유래 세스퀴테르펜 화합물 ECN은 삼중 음성 유방암 세포의 JAK-STAT3 신호 전달 기전을 억제하여 항암 치료제 성분으로 활용 가능성을 기대 할 수 있다.
주 요 어: 관동화, 세스퀴테르펜, 항암, STAT3, 삼중 음성 유방암,
MDA-MB-231 세포