ARTICLE
Int J Thyroidol 2019 May 12(1): 35-43 https://doi.org/10.11106/ijt.2019.12.1.35Received September 20, 2018 / Revised January 31, 2019 / Accepted May 14, 2019
Correspondence: Hoon Sung Choi, MD, PhD, Department of Internal Medicine, Kangwon National University School of Medicine, 1 Gangwondaehak-gil, Chuncheon 24341, Korea
Tel: 82-33-258-9217, Fax: 82-33-258-2404, E-mail: [email protected]
Copyright ⓒ 2019, the Korean Thyroid Association. All rights reserved.
This is an open-access article distributed under the terms of the Creative Commons Attribution Non-Commercial License (http://creative- commons.org/licenses/by-nc/4.0/), which permits unrestricted non-commercial use, distribution, and reproduction in any medium, provided the original work is properly cited.
Ultrasonographic Characteristics of the Hyperfunctioning Thyroid Nodule and Predictive Factors for Thyroid Stimulating Hormone Suppression
Won Sang Yoo
1and Hoon Sung Choi
2Department of Internal Medicine, Dankook University College of Medicine1, Cheonan, Department of Internal Medicine, Kangwon National University School of Medicine2, Chuncheon, Korea
Background and Objectives: Thyroid scan is a good tool for diagnosis of hyperfunctioning thyroid nodules (HNs), however it has been limited in use in a primary clinical practice, because of its inconvenience and low accessibility. This study aimed to analyze ultrasonographic (US) characteristics of HNs and to predict HNs by US. Materials and Methods: We included 114 patients who exhibited results of ‘hot’ nodule in the thyroid scan from 2008 to 2017. Analysis for US characteristics included 73 patients without unclear US images and other inevitable reasons. We compared US characteristics of HNs with cold nodules that showed “cold” in the thyroid scan. Additionally, we compared US characteristics of HNs between suppressed thyroid-stimulating hormone (TSH) (<0.25 uIU/mL) or normal TSH, and analysis receiver operating characteristics (ROC) curve for prediction of suppressed TSH among HNs. Results: The HNs showed more partially cystic nodule, isoechoic echogenicity, hypervascularity and presence of halo in the US finding than the cold nodule. In subgroup analysis of nodules with TSH suppression among HNs, the TSH suppression nodules was lager in max size and volume than the normal TSH nodules. In ROC analyses for prediction of the TSH suppression among HNs, area under receiver operating characteristics curves was 0.736 in max size, 0.761 in volume. Conclusion: HNs showed more frequently partially cystic contents, isoechoic echogenicity, hypervascularity, and peripheral halo sign in US finding. Thyroid nodule size and volume were associated with suppressed TSH level of HNs, and optimal cutoff levels for prediction of TSH suppression among HNs were 2.6 cm and 1.13 cm3, respectively.
Key Words: Hyperfunctioning nodule, Ultrasonography, Thyrotropin
Introduction
Hyperfunctioning thyroid nodules (HNs) are defined as nodules that grow and produce thyroid hormone independently of thyroid-stimulating hormone (TSH).1-3) HNs can only be diagnosed on thyroid scan and ap- pear as “hot spots” that can be differentiated from surrounding normal thyroid tissue.4) However, physi-
cians in primary clinics cannot diagnose HNs easily because thyroid scans are inconvenient to perform and are limited in access.
Thyroid ultrasonography (US) is widely available, has high accessibility, poses no radiation hazards, and can clearly differentiate thyroid nodules.5) Therefore, thyroid US is most frequently used to diagnose thyroid nodules.1-3) If the ultrasonographic characteristics of HNs can be clarified to enable prediction of HNs, US
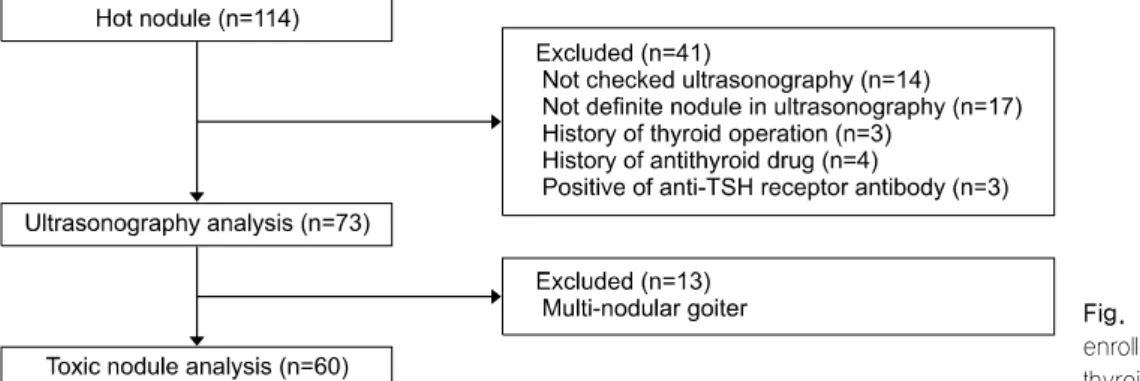
Fig. 1. Flowchart of patient enrollment in hyperfunctioning thyroid nodules.
would be useful in diagnosing and managing thyroid nodule with TSH suppression, especially in primary care settings where thyroid scan is not available.
However, a few studies have accurate analyzed US characteristics of HNs.6,7) For this reason, it was nec- essary to identify the US characteristics of HNs and to analyze the characteristics of the nodule with TSH suppression.
We examined the differences in clinical and sono- graphical characteristics between HNs and cold nod- ules on thyroid scan. And the clinical and US charac- teristics associated with TSH suppression were ana- lyzed, among patients with HNs. As a results, we aimed to describe the usefulness of US in the diag- nosis for HNs.
Materials and Methods
Subjects
Among 114 patients with HNs who exhibited “hot”
and “hyperfunction” results on thyroid scan imaging between 2008 and 2017, 73 were included in the analysis. Forty-one patients were excluded for the fol- lowing reasons: no thyroid US was conducted within 3 months before or after the scan; the location of the nodule seen on the scan and the US did not agree (left/right and upper/mid/low); when multiple nodules did not have clear boundaries, or when the nodule was not clear on US; a history of thyroid surgeries;
and patients taking anti-thyroid drugs or positive for anti-TSH receptor antibody. Additionally, 13 patients with multi-nodular goiter were excluded in a further analysis investigating the effect of TSH suppression,
because multiple nodules can influence TSH levels (Fig. 1). As a control group, 188 patients with “cold”
nodules on thyroid scan imaging were included in the analysis to compare differences in clinical and US findings. Electronic medical records and US findings were retrospectively reviewed. Institutional Review Board approval was obtained for this study (2018- 04-009).
Thyroid Scan and the Definition of HN
Using a single-head gamma camera (LEM Plus, Siemens, Erlangen, Germany) equipped with a pinhole collimator, thyroid scans in the anterior view were ac- quired 20 min after intravenous administration of 185 MBq of Tc-99m-pertechnetate. For imaging, patients were placed in the supine position with their neck ex- tended; marking sources for size measurements were located on both lateral sides of the neck. HNs were defined as nodules that demonstrated greater tracer uptake than the surrounding normal thyroid tissue, and could be differentiated from the thyroid parenchyma. In cases of multi-nodular goiter on scanning, repre- sentative nodules with the clearest boundary were selected and analyzed using US.
Thyroid US and Classification of Thyroid Nodules
In all cases, the sonographic images included both transverse and longitudinal real-time imaging of thy- roid nodules using PACS (Picture Archiving Communications System, TechHeim, Seoul, Korea). All US images were obtained using an HDI 5000 system (Philips Medical Systems, Bothell, WA, USA) equipped with 7.5 to 12 or 8 to 15 MHz linear transducers. One endocrinologist, with 10 years’ experience in thyroid
US, reviewed thyroid nodule characteristics including location, size, volume (width×length×height×0.52), shape, margin, content, echogenicity, calcification, presence of halo, and vascularity according to pre- vious recommended terminology.8) Depending on the nodule contents, the nodules were classified as solid, predominantly solid (>50% solid for a mixed nodule), predominantly cyst (>50% cyst for a mixed nodule), and pure cyst. Nodular shapes were classified as ovoid, round, TDW (when the anteroposterior diameter of the nodule was longer than its transverse diameter on a transverse or longitudinal plane), or irregular (when a nodule was neither ovoid to round nor TDW).
Nodular margins were categorized as smooth, spicu- lated (obviously discernible, but not-smooth edge showing speculation, microlobulation), ill-defined mar- gin (poorly demarcated margin which cannot be ob- viously differentiated form adjacent thyroid tissue).
Echogenicity of the nodules was classified as hypo- echoic (hypoechoic relative to thyroid parenchyma), isoechoic (same echogenicity as that of thyroid pa- renchyma), or hyperechoic (hyperechoic relative to thyroid parenchyma). Each nodule was also classified as showing microcalcification (echogenic foci of 1 mm or less), macrocalcification (when punctuate echo- genic foci were larger than 1 mm in size), or rim calci- fication (peripheral curvilinear echogenic rim). Nodular echotexture was determined to be homogeneous or heterogeneous. Nodular vascularity was classified as none (absence of intranodular or perinodular vascu- larity), internal (intranodular vascularity without peri- nodular vascularity), peripheral (presence of circum- ferential vascularity at margin of nodule), or both (intranodular vascularity with perinodular vascularity) by assessed Doppler. The presence of a halo (thin or thick hypoechoic rim surrounding nodule) was also noted.8)
The malignancy risk for each thyroid nodule was classified according to the malignancy risk criteria published by the American Thyroid Association (ATA).1) When fine-needle aspiration (FNA) or surgeries were performed, the results of aspiration and the final surgi- cal outcomes were verified.
Thyroid Function and TSH Receptor Antibody Tests
Serum TSH concentrations (reference range, 0.25-4 uIU/mL [lower detection limit, 0.03 uIU/mL]) were measured using an immunoradiometric assay (RIA-gnost rhTSH, cisbio bioassays, France). TSH suppression was defined as HNs with lower TSH lev- els than the low-normal reference level (TSH <0.25 mIU/mL). The serum levels of free T4 (normal range, 0.78-1.94 ng/dL) were measured using an fT4 ra- dioimmunoassay (RIA) kit (fT4-CTX, DiaSorin S.p.A.).
The serum levels of total T3 (reference range, 80-100 ng/dL) were measured using an RIA kit (T3-CTK, DiaSorin S.p.A.). TSH receptor antibody levels were determined using the B.R.A.H.M.S. TRAK human RIA kit (B.R.A.H.M.S. GmbH, Hennigsdorf/Berlin, Germany) according to manufacturer’s instructions. TSH receptor antibody levels ≥1.5 IU/L were considered to indicate positive results.
Subgroup Analysis According to TSH Suppression among HNs
For subgroup analysis according to TSH sup- pression, two group were classified based on TSH
<0.25 mIU/mL. We compared US finding, age, sex, thyroid function test between the two groups. On the assumption that TSH decreases as the size of nodule increases in HNs, receiver operating characteristic (ROC) curve analysis was performed to measure the cut-off values for the size and volume of nodules to predict TSH suppressed HNs.
Statistical Analysis
All statistical analyses were performed using SPSS version 16.0 (IBM Corporation, Chicago, IL, USA) for Windows (Microsoft Corporation, Redmond, WA, USA).
The Student’s t test was used for comparisons involv- ing continuous variables, and chi-squared tests and Fisher’s exact tests were performed for categorical variables. For subgroup analysis according to TSH suppression, the Student’s t-test was used for com- parison of continuous variable, and chi-squared test for categorical variables between groups. p<0.05 was considered to be statistically significant. ROC
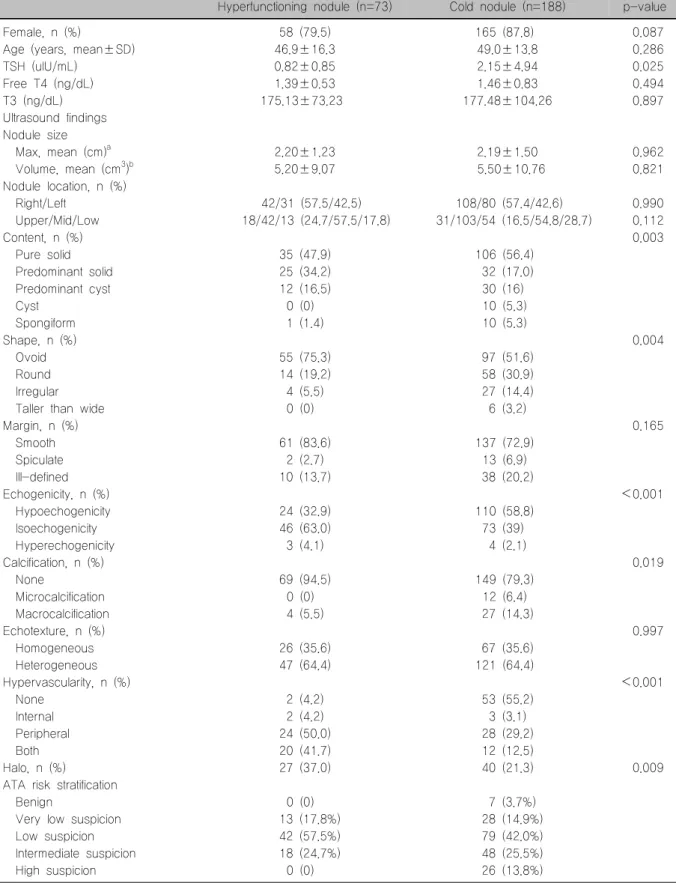
Table 1. Comparison of clinical characteristics and ultrasound findings between hyperfunctioning nodules and cold nodules Hyperfunctioning nodule (n=73) Cold nodule (n=188) p-value
Female, n (%) 58 (79.5) 165 (87.8) 0.087
Age (years, mean±SD) 46.9±16.3 49.0±13.8 0.286
TSH (uIU/mL) 0.82±0.85 2.15±4.94 0.025
Free T4 (ng/dL) 1.39±0.53 1.46±0.83 0.494
T3 (ng/dL) 175.13±73.23 177.48±104.26 0.897
Ultrasound findings Nodule size
Max, mean (cm)a 2.20±1.23 2.19±1.50 0.962
Volume, mean (cm3)b 5.20±9.07 5.50±10.76 0.821
Nodule location, n (%)
Right/Left 42/31 (57.5/42.5) 108/80 (57.4/42.6) 0.990
Upper/Mid/Low 18/42/13 (24.7/57.5/17.8) 31/103/54 (16.5/54.8/28.7) 0.112
Content, n (%) 0.003
Pure solid 35 (47.9) 106 (56.4)
Predominant solid 25 (34.2) 32 (17.0)
Predominant cyst 12 (16.5) 30 (16)
Cyst 0 (0) 10 (5.3)
Spongiform 1 (1.4) 10 (5.3)
Shape, n (%) 0.004
Ovoid 55 (75.3) 97 (51.6)
Round 14 (19.2) 58 (30.9)
Irregular 4 (5.5) 27 (14.4)
Taller than wide 0 (0) 6 (3.2)
Margin, n (%) 0.165
Smooth 61 (83.6) 137 (72.9)
Spiculate 2 (2.7) 13 (6.9)
Ill-defined 10 (13.7) 38 (20.2)
Echogenicity, n (%) <0.001
Hypoechogenicity 24 (32.9) 110 (58.8)
Isoechogenicity 46 (63.0) 73 (39)
Hyperechogenicity 3 (4.1) 4 (2.1)
Calcification, n (%) 0.019
None 69 (94.5) 149 (79.3)
Microcalcification 0 (0) 12 (6.4)
Macrocalcification 4 (5.5) 27 (14.3)
Echotexture, n (%) 0.997
Homogeneous 26 (35.6) 67 (35.6)
Heterogeneous 47 (64.4) 121 (64.4)
Hypervascularity, n (%) <0.001
None 2 (4.2) 53 (55.2)
Internal 2 (4.2) 3 (3.1)
Peripheral 24 (50.0) 28 (29.2)
Both 20 (41.7) 12 (12.5)
Halo, n (%) 27 (37.0) 40 (21.3) 0.009
ATA risk stratification
Benign 0 (0) 7 (3.7%)
Very low suspicion 13 (17.8%) 28 (14.9%)
Low suspicion 42 (57.5%) 79 (42.0%)
Intermediate suspicion 18 (24.7%) 48 (25.5%)
High suspicion 0 (0) 26 (13.8%)
aNodule size is the maxim width, length, height.
bVolume is calculated by multiplying width, length, height×0.52.
ATA: American Thyroid Association, SD: standard deviation, TSH: thyroid stimulating hormone
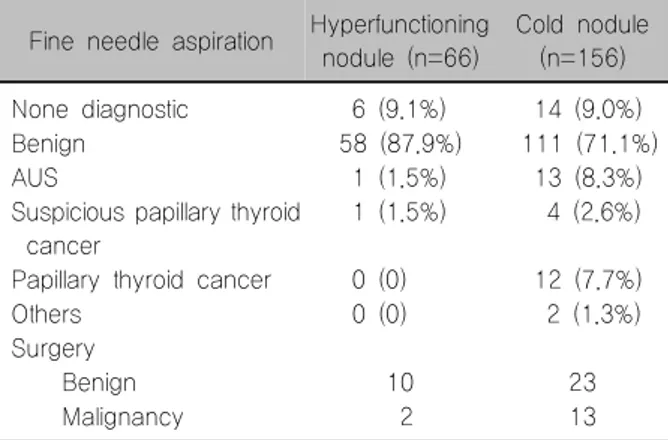
Table 2. Comparison of fine needle aspiration results or surgery between hyperfunctioning nodules and cold nodules
Fine needle aspiration Hyperfunctioning nodule (n=66)
Cold nodule (n=156)
None diagnostic 6 (9.1%) 14 (9.0%)
Benign 58 (87.9%) 111 (71.1%)
AUS 1 (1.5%) 13 (8.3%)
Suspicious papillary thyroid cancer
1 (1.5%) 4 (2.6%)
Papillary thyroid cancer 0 (0) 12 (7.7%)
Others 0 (0) 2 (1.3%)
Surgery
Benign 10 23
Malignancy 2 13
AUS: atypia of undetermined significance curve was drawn to measure the cut-off values for
the size and volume of nodules to predict TSH sup- pressed among HNs.
Results
Comparison of Clinical Characteristics between HNs and Cold Nodules
There were no significant differences in age and fe- male proportion between patients with HNs and those with cold nodules (Table 1). The mean TSH level was lower in patients with HNs than in those with cold nodules (0.82±0.85 uIU/mL vs. 2.15±4.94 uIU/mL, respectively; p=0.025). However, there were no dif- ferences in free T4 and total T3 levels between the groups.
Comparison of US Features between HNs and Cold Nodules
Both nodule size and volume were not different be- tween the two groups; there were also no differences in the location of thyroid nodules (Table 1). HNs ex- hibited partially solid or cystic features more frequently than cold nodules (50.7% vs. 33.0%, respectively; p=
0.004). Suspicious features, including nodule shape,
“irregular,” and “taller than wide” were more fre- quently observed in cold nodules than in HNs (17.6%
vs. 5.5%, respectively; p=0.010). In particular, the
“taller than wide” shape was not observed in HNs.
The proportion of nodules with hypo-echogenicity (p<
0.001) and internal calcification (p=0.019) were higher in cold nodules than in HNs, with a difference that was statistically significant. Internal or peripheral hyper- vascularity was observed in 95.8% of HNs compared to 44.8% of cold nodules (p<0.001). Peripheral halo was observed more frequently in HNs than in cold nodules (37.0% vs. 21.3%, respectively; p=0.009).
However, there were no significant differences in nod- ule margin and echotexture between the groups.
According to the malignancy risk stratification from the ATA guideline, cold nodules exhibited a higher fre- quency of cases with “highly suspicious” or “interme- diate suspicious” categories than HNs. In particular,
there were no cases of the “highly suspicious” cat- egory in HNs.
Comparison of FNA Results or Surgery between HNs and Cold Nodules
FNA was performed in 66 of 73 HNs, and eval- uated according to the Bethesda classification.9) Of the 66 HNs that underwent FNA, 6 (9.2%) were non- diagnostic or unsatisfactory, 58 (87.9%) were benign, 1 (1.5%) was atypia of undetermined significance (AUS) or follicular lesion of undetermined significance (FLUS), and 1 (1.5%) was suspicious for malignancy (Table 2). After subsequent FNA, 11 nodules under- went surgery in the authors’ hospital. After surgery, 10 benign (3 follicular adenoma and 7 nodular hyper- plasia) and 1 malignant (papillary thyroid carcinoma) were confirmed. One nodule was diagnosed as mini- mally invasive follicular carcinoma by surgery without FNA.
FNA was performed in 156 of the 188 cold nod- ules; of these, 14 (9.0%) were nondiagnostic or un- satisfactory, 111 (71.2%) were benign, 13 (8.3%) were AUS or FLUS, 4 (2.6%) were suspicious for malig- nancy, and 12 (7.7%) were malignant. The other two nodules were lymphoma and anaplastic carcinoma.
After subsequent FNA, 36 nodules underwent surgery in the authors’ hospital. After surgery, 23 benign and 13 malignant nodules were confirmed. The 5 subjects who were diagnosed with suspicious for malignancy
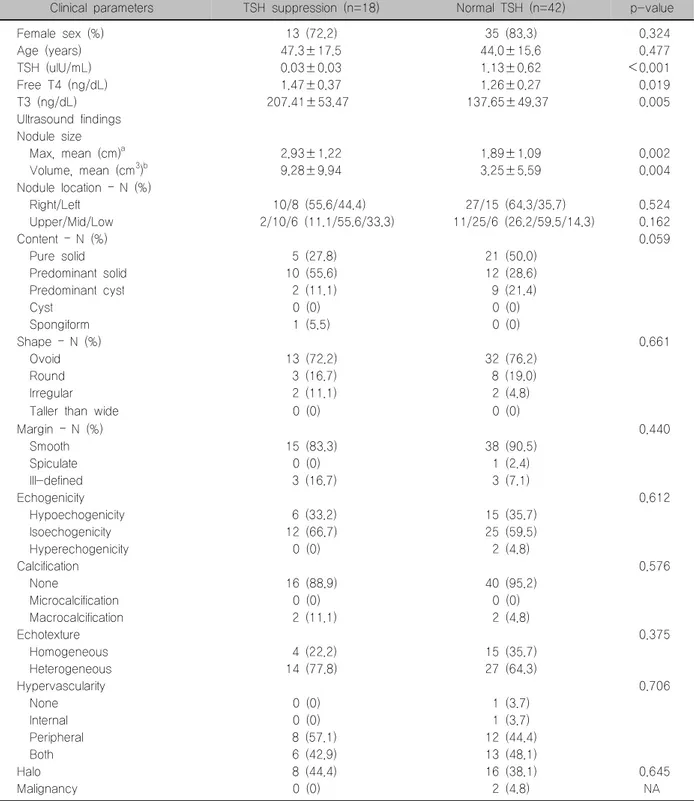
Table 3. Comparison of ultrasound findings between TSH suppression and normal TSH in hyperfunctioning nodules
Clinical parameters TSH suppression (n=18) Normal TSH (n=42) p-value
Female sex (%) 13 (72.2) 35 (83.3) 0.324
Age (years) 47.3±17.5 44.0±15.6 0.477
TSH (uIU/mL) 0.03±0.03 1.13±0.62 <0.001
Free T4 (ng/dL) 1.47±0.37 1.26±0.27 0.019
T3 (ng/dL) 207.41±53.47 137.65±49.37 0.005
Ultrasound findings Nodule size
Max, mean (cm)a 2.93±1.22 1.89±1.09 0.002
Volume, mean (cm3)b 9.28±9.94 3.25±5.59 0.004
Nodule location – N (%)
Right/Left 10/8 (55.6/44.4) 27/15 (64.3/35.7) 0.524
Upper/Mid/Low 2/10/6 (11.1/55.6/33.3) 11/25/6 (26.2/59.5/14.3) 0.162
Content – N (%) 0.059
Pure solid 5 (27.8) 21 (50.0)
Predominant solid 10 (55.6) 12 (28.6)
Predominant cyst 2 (11.1) 9 (21.4)
Cyst 0 (0) 0 (0)
Spongiform 1 (5.5) 0 (0)
Shape – N (%) 0.661
Ovoid 13 (72.2) 32 (76.2)
Round 3 (16.7) 8 (19.0)
Irregular 2 (11.1) 2 (4.8)
Taller than wide 0 (0) 0 (0)
Margin – N (%) 0.440
Smooth 15 (83.3) 38 (90.5)
Spiculate 0 (0) 1 (2.4)
Ill-defined 3 (16.7) 3 (7.1)
Echogenicity 0.612
Hypoechogenicity 6 (33.2) 15 (35.7)
Isoechogenicity 12 (66.7) 25 (59.5)
Hyperechogenicity 0 (0) 2 (4.8)
Calcification 0.576
None 16 (88.9) 40 (95.2)
Microcalcification 0 (0) 0 (0)
Macrocalcification 2 (11.1) 2 (4.8)
Echotexture 0.375
Homogeneous 4 (22.2) 15 (35.7)
Heterogeneous 14 (77.8) 27 (64.3)
Hypervascularity 0.706
None 0 (0) 1 (3.7)
Internal 0 (0) 1 (3.7)
Peripheral 8 (57.1) 12 (44.4)
Both 6 (42.9) 13 (48.1)
Halo 8 (44.4) 16 (38.1) 0.645
Malignancy 0 (0) 2 (4.8) NA
aNodule size is the maxim width, length, height×0.52.
bVolume is calculated by multiplying width, length, height.
NA: not available, TSH: thyroid stimulating hormone
or malignant in the FNA result wished to transfer to another hospital for thyroid surgery.
The number of patients with malignant thyroid nod-
ules was 2 (2.7%) in the HN group, and 18 (9.6%) in the cold nodule group.
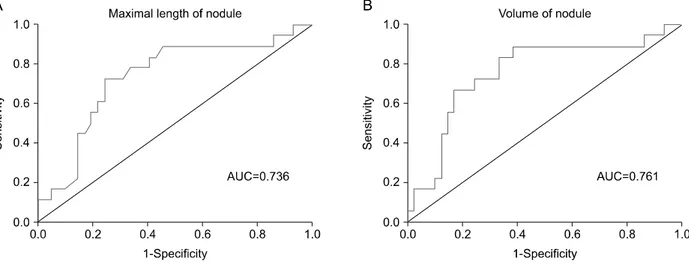
Fig. 2. Area under receiver operating curve (ROC) of max size and volume to predict thyroid stimulating hormone suppression in hyperfunctioning thyroid nodules were 0.736 (95% CI=0.664-0.879, p<0.001) and 0.761 (95% CI=0.698-0.906, p<0.001), respectively.
Comparison of Clinical and US Characteristics of HNs between Patients with Suppressed versus Normal Levels of TSH
Data from a total of 60 subjects, excluding 13 sub- jects with multiple nodular goiters, are shown in Table 3. According to the definition of TSH suppression (TSH
<0.25 mIU/mL), 18 (30%) patients exhibited sup- pressed TSH levels. TSH suppressed nodules dem- onstrated significantly lower TSH levels, and sig- nificantly higher levels of free T4 and total T3. There were no differences in age and female proportion be- tween the groups. TSH suppressed nodules were significantly larger (2.93±1.22 vs. 1.89±1.09 cm;
p=0.002) and had a higher volume than normal nod- ules accompanied by normal TSH levels (9.28±9.94 vs 3.25±5.59 cm3; p=0.004) in HNs. However, there were no differences in location, content, shape, mar- gin, echogenicity, and vascularity between HNs ac- companied by suppressed or normal TSH levels.
Cut-off Values for the Size and Volume of HNs to Predict TSH Suppression
The area under the ROC curve, according to size and volume, were 0.736 (95% CI=0.664-0.879, p<
0.001) and 0.761 (95% CI=0.698-0.906, p<0.001), respectively (Fig. 2). To predict TSH suppressed HNs, the optimal cut-off value for nodule size was 2.6 cm,
with sensitivity of 72.2%, specificity of 76.2%, 56.5% of positive predictive values (PPV) and 86.5 of negative predictive value (NPV). The optimal volume to predict TSH suppressed HNs was 1.13 cm3, with sensitivity of 88.9%, specificity 61.9%, 50.0% of PPV and 92.9%
of NPV.
Discussion
Thyroid nodules are commonly encountered in the clinic, and US is regarded to be the most important diagnostic tool for diagnosis and management of these entities. If HNs are suspected, thyroid scans are nec- essary to make definitive diagnosis.1-3) However, thy- roid scans are limited in that they cannot be easily performed in primary care settings. Our study showed that US images of HNs demonstrated higher pro- portions of partially cystic nodule, isoechoic echoge- nicity, increased vascularity, and the presence of a halo than cold nodules. Ianni et al.6) reported that HNs showed isoechoic echogenicity and the others also reported that HNs showed partially cystic contend in thyroid US.10,11) Previous studies have attempted to identify HNs with other diagnostic tool, such as US-elastography12) and computed tomography (CT).13)
Guidelines recommend that patients with sup- pressed TSH level should be examined by thyroid scan for the differential diagnosis of HNs.2) Our results
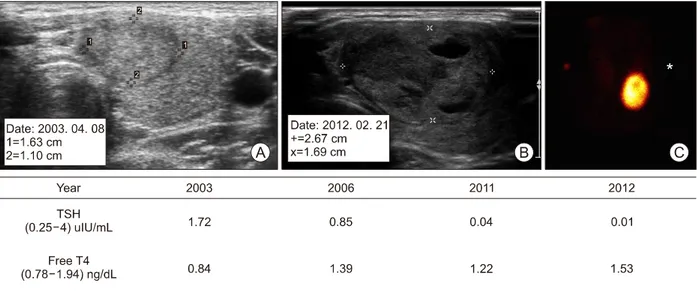
Fig. 3. A case of hyperfunctioning thyroid nodule which showed TSH suppressed as size increased. In 2003, TSH of the patient with 1.63 cm isoechoic nodule on thyroid ultrasound (A) was 1.72 uIU/ml in the normal range. In 2012, the size was increased to 2.67 cm mixed isoechoic nodule on ultrasound (B), and the thyroid scan showed hyperfunctioning thyroid nodule (C) and TSH decreased to 0.01 uIU/ml.
suggests the thyroid US as a tool to identify the HNs in the primary care setting, in which thyroid scan often is not available. According to our results, thyroid scan could be recommend in patients with US findings pre- ferring to HNs, such as partially cystic, isoechoic, in- creased vascularity, and presence of halo.
Our study showed that HNs with suppressed TSH were significantly larger than HNs with normal TSH, corresponding to previous studies. Burch et al.14) re- ported that the nodule size of patients with thyrotox- icosis (3.2 cm) was greater than that of non-thyrotox- icosis patients (2.2 cm) and that six patients had ex- perienced newly developed thyrotoxicosis during fol- low-up period of average 5.7 years. Additionally, a Japanese study investigating 104 patients with HNs also reported that the nodule size of patients with TSH suppression (2.4 cm) were larger than that of patients with normal TSH levels (2.3 cm).15) The close associa- tion between nodule size and degree of TSH sup- pression was observed well in a representative case, that a 30-year old women with a HN had showed normal TSH level for nine years, then TSH level grad- ually decreased as the nodule size increased (Fig. 3).
We showed optimal size and volume of HNs to predict the status of suppressed TSH, using a ROC curve analysis.
In our study, according to the ATA estimated malig- nancy classification criteria, US images of HNs were mainly classified as “very low suspicious” or “low suspicious” categories, compared to cold nodules (75.3% and 56.9%, respectively). Interestingly, there were no HNs in high suspicion category; whereas 13.8% of cold nodules were classified into high suspi- cion category. Low rates of suspicious nodules in HNs are consistent with previous studies that reported very low rates of malignancy.16,17) However, we found two malignancy cases (minimally invasive follicular carci- noma and papillary thyroid carcinoma) in patients with HNs. Including three patients who had incidental PTC, there were 5 (6.8%) malignancy cases in patients with HNs, corresponding to a previous study that reported malignancy rate of 6.5% of HNs.7) Because of these non-negligible proportion of malignancy of HNs, US examination might be useful in patients with HNs.
Our study has several limitations. Firstly, this study was designed as a retrospective study in a single hospital, which can lead to selection bias. Secondly, thyroid scan had low interobserver agreement rates, resulting from potential imbalance in radioiodine uptake.18) However, in our study, thyroid scan images were analyzed by one nuclear medicine specialist, which could have mitigated interobserver issues.
Additionally, to mitigate this limitation, we excluded pa- tients who have TSH receptor auto-antibodies or mul- ti-nodular characteristics.
In conclusion, US could be a useful diagnostic for HNs in primary care settings where thyroid scan is not available. HNs are most likely to have isoechoic char- acteristic with mixed-type content and to show hyper- vascularity on US. TSH suppression is likely to be ob- served in large HNs larger than 2.6 cm in size or greater 1.13 cm3.
Acknowledgments
This study was supported by research fund of Kangwon Branch of Korean Endocrine Society (2017).
Conflict of Interest
The authors have nothing to disclose.
References
1) Haugen BR, Alexander EK, Bible KC, Doherty GM, Mandel SJ, Nikiforov YE, et al. 2015 American Thyroid Association management guidelines for adult patients with thyroid nodules and differentiated thyroid cancer: The American Thyroid Association guidelines task force on thyroid nodules and differentiated thyroid cancer. Thyroid 2016;26(1):1-133.
2) Yi KH, Lee EK, Kang HC, Koh Y, Kim SW, Kim IJ, et al. 2016 revised Korean Thyroid Association management guidelines for patients with thyroid nodules and thyroid cancer.
Int J Thyroidol 2016;9(2):59-126.
3) Perros P, Boelaert K, Colley S, Evans C, Evans RM, Gerrard Ba G, et al. Guidelines for the management of thyroid cancer.
Clin Endocrinol (Oxf) 2014;81 Suppl 1:1-122.
4) Gharib H, Papini E. Thyroid nodules: clinical importance, assessment, and treatment. Endocrinol Metab Clin North Am 2007;36(3):707-35, vi.
5) Kim WJ, Kim JH, Park DW, Lee CB, Park YS, Kim DS, et al. Prevalence of thyroid nodules detected by ultrasonography in adults for health check-ups and analysis of fine needle aspiration cytology. J Korean Endocr Soc 2008;23(6):413-9.
6) Ianni F, Perotti G, Prete A, Paragliola RM, Ricciato MP,
Carrozza C, et al. Thyroid scintigraphy: An old tool is still the gold standard for an effective diagnosis of autonomously functioning thyroid nodules. J Endocrinol Invest 2013;36(4):
233-6.
7) Lee ES, Kim JH, Na DG, Paeng JC, Min HS, Choi SH, et al. Hyperfunction thyroid nodules: Their risk for becoming or being associated with thyroid cancers. Korean J Radiol 2013;14(4):643-52.
8) Shin JH, Baek JH, Chung J, Ha EJ, Kim JH, Lee YH, et al. Ultrasonography diagnosis and imaging-based management of thyroid nodules: Revised Korean Society of Thyroid Radiology consensus statement and recommendations. Korean J Radiol 2016;17(3):370-95.
9) Cibas ES, Ali SZ. The Bethesda system for reporting thyroid cytopathology. Thyroid 2009;19(11):1159-65.
10) Moon WJ, Kwag HJ, Na DG. Are there any specific ultrasound findings of nodular hyperplasia ("leave me alone" lesion) to differentiate it from follicular adenoma? Acta Radiol 2009;
50(4):383-8.
11) Mizukami Y, Michigishi T, Nonomura A, Yokoyama K, Noguchi M, Hashimoto T, et al. Autonomously functioning (hot) nodule of the thyroid gland. A clinical and histopathologic study of 17 cases. Am J Clin Pathol 1994;101(1):29-35.
12) Ruhlmann M, Stebner V, Gorges R, Farahati J, Simon D, Bockisch A, et al. Diagnosis of hyperfunctional thyroid nodules:
impact of US-elastography. Nuklearmedizin 2014;53(5):173-7.
13) Zandieh S, Muin D, Bernt R, Hittmair K, Haller J, Hergan K. Characteristics of incidentally found thyroid nodules in computed tomography: comparison with thyroid scintigraphy.
BMC Med Imaging 2017;17(1):8.
14) Burch HB, Shakir F, Fitzsimmons TR, Jaques DP, Shriver CD. Diagnosis and management of the autonomously functioning thyroid nodule: the Walter Reed Army Medical Center experience, 1975-1996. Thyroid 1998;8(10):871-80.
15) Iwata M, Kasagi K, Hatabu H, Misaki T, Iida Y, Fujita T, et al. Causes of appearance of scintigraphic hot areas on thyroid scintigraphy analyzed with clinical features and comparative ultrasonographic findings. Ann Nucl Med 2002;16(4):279-87.
16) Kim JH, Na GJ, Kim KW, Ko HJ, Jeon SW, Kim YJ, et al. Papillary thyroid carcinoma manifesting as a autonomously functioning thyroid nodule. Endocrinol Metab 2012;27(1):59-62.
17) Kong SH, Lee SY, Yang YS, Moon JH. Papillary thyroid carcinoma presented as a hot nodule with hyperthyroidism. Int J Thyroidol 2016;9(1):47-50.
18) Soelberg KK, Grupe P, Boel-Jorgensen H, Jorgensen PH, Fast S, Nielsen VE, et al. Substantial interobserver variation of thyroid volume and function by visual evaluation of thyroid (99m)Tc scintigraphy. Dan Med J 2014;61(2):A4768.