• 검색 결과가 없습니다.

Appilication of a Green City Index as a Green Space Planning Index for the Low-Carbon Green City of Gangneung-si

N/A
N/A
Protected

Academic year: 2021

Share "Appilication of a Green City Index as a Green Space Planning Index for the Low-Carbon Green City of Gangneung-si"

Copied!
7
0
0

로드 중.... (전체 텍스트 보기)

전체 글

(1)

ORIGINAL ARTICLE

Appilication of a Green City Index as a Green Space Planning Index for the Low-Carbon Green City of Gangneung-si

Su-Hyun Cho, Hyun-Ju Jo

1)*

Department of Future City, Gangneung City, Gangneung 25522, Korea

1)

East Coast Life Sciences Institute, Gangneung-Wonju National University, Gangneung 25457, Korea

Abstract

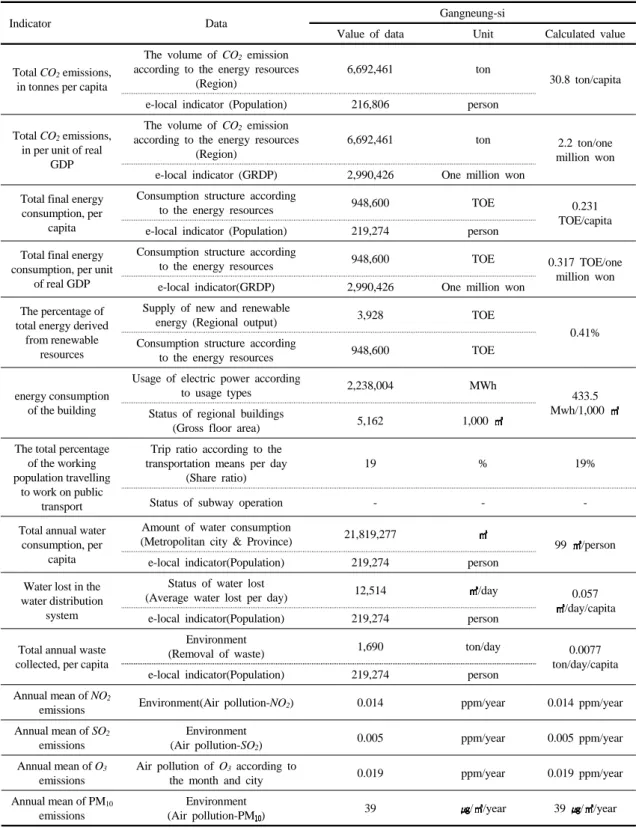
This study aims to establish baseline data for sustainable monitoring by applying the green city index (GCI), which is set up to evaluate the city level, to the city of Gangneung-si, which was designated as a pilot city for the Low-carbon Green Growth City project by the Ministry of Land, Infrastructure, and Transportation. The GCI was applied in the framework of European systems, while considering the social and economic status of Korea. Indicators from 7 areas — CO

2

, energy, building, transportation, water, waste, and quality of atmosphere were analyzed, except for qualitative indicators. Results indicate that total CO

2

emissions were 30.8 tons per capita, or 2.2 tons per one million units of real GDP. The total final energy consumption was 0.231 TOE/capita, or 0.317 TOE per one million units of real GDP. The percentage of total energy derived from renewable resources was 0.41% and energy consumption by the building was 433.5 Mwh/1,000 ㎡. The total percentage of the working population travelling to work daily by public transportation (limited to bus) was 19%. Further, the total annual water consumption was 99 ㎥/capita, and the water lost in the water distribution system was 0.057 ㎥/capita/day. The total annual waste collected was 0.0077 ton per capita, The annual mean emission were 0.014 ppm/day for NO

2

, 0.005 ppm/day for SO

2

, and 0.019 ppm/day for O

3

. The annual mean for PM

10

emissions was 39 ㎍/㎥/day.

Key words : Green city indicator, GCI, Low-carbon green growth city, Baseline data

1. Introduction 1)

More than 50% of the world’s population currently lives in cities. The ICLEI (international council for local environmental initiatives) has estimated that, of the total world population of 9 billion expected by 2050, two-thirds will reside in cities. Rapid urbanization has developed alongside numerous environmental and social concerns. Environmental issues include serious changes to natural ecosystems, such as biodiversity loss and climate change. In response to such concerns, international environmental

organizations and national environmental policy institutions have conducted quantitative and qualitative investigations into the conditions of urban ecosystems and developed environmental evaluation indicators that can be applied to help solve these urban environmental issues (Sherbinin et al., 2013). To promote well-being and build a well-equipped, eco-friendly and sustainable society, countries have used the EPI (environmental performance index, which evaluates environmental improvement) and the ESI (environmental sustainability index, which assesses the sustainability of a country based on environmental,

Received 1 September, 2016; Revised 14 September, 2016;

Accepted 20 September, 2016

*

Corresponding author : Hyun-Ju Jo, East Coast Life Science Institute, Gangneung-Wonju National University, Gangneung 25457, Korea

Phone : +82-33-640-2639 E-mail : [email protected]

ⓒ The Korean Environmental Sciences Society. All rights reserved.

This is an Open-Access article distributed under the terms of the Creative Commons Attribution Non-Commercial License (http://

creativecommons.org/licenses/by-nc/3.0) which permits unrestricted

non-commercial use, distribution, and reproduction in any medium,

provided the original work is properly cited.

(2)

societal and financial conditions). The Climate Change Performance Index by Germanwatch compares different countries based on their efforts against climate change (Burck et al., 2008). However, the index has limitations because, with its country -level focus, it does not reflect actions at the regional level.

For a comprehensive comparison of city units, A.T.

Kearney’s global cities index (GCI) is often used in Europe because it evaluates cities differently according to each continent’s characteristics, rather than applying a blanket approach to all cities in the world (Ko and Kim, 2010). In Asia, 22 metropolitan areas, including Seoul, have implemented the Economist Intelligence Unit’s Green City Index; however, small and medium-sized cities could not be included because of a lack of clear and consistent data for evaluation.

In Korea, the “Low Carbon, Green Growth” act took effect in April 2010; studies on an index for Low Carbon, Green Growth cities have since been under way as a key government policy. While previous studies mostly focused on the development and application of an index related to nature conservation, transport, energy, environment, health and environ – mental disasters (Choi, 2011; Lee, 2013; Lee et al., 2011; Lim, 2011; Park and Kim, 2010; You et al., 2005), Lee and Kim have suggested improvements via laws and systems for building green cities. Song et al.

(2008) addressed the need for a low-carbon, green city index that also considered quality of life.

The National Institute of Environmental Research (2013) applied the Green City Index to large municipal governments and some small and medium-sized cities to determine their rankings. Previous studies on the Low Carbon, Green Growth index, however, were still lacking research into low-carbon, green competitiveness comparisons between cities (Ko and Kim, 2010).

Adapting the international standard index to domestic conditions also created limitations for comparisons between domestic municipal governments and foreign cities. Because the index is applied to big

cities, it is also especially difficult to use on cities of any size. This limitation was identified in Korea after a case study applied the GCI to small and medium-sized cities. Accordingly, it is clear there is a need to construct a standard data method and evaluate it continuously. Thus, this study aims to propose a data frame for all the items needed to apply a GCI system, with the goal of building standard data for monitoring in the future.

2. Study Site and Methods

2.1. Study site

The study site was Gangneung, chosen by the government as a low-carbon, green pilot city.

Gangneung has a population of 214,560 people (2015) and a total area of 1,040 km

2

. It is located in the center of the Baekdudaegan mountain range, on the eastern side. To the east, Gangneung is bordered by the East Sea of Korea; to the west are Nae-myeon, Hongcheon -gun; Jinbu-myeon; and Daegwonryoung-myeon, Pyeongchang-gun. On the city’s southern border are Donghae-shi; Imgye-myeon; and Buk-myeon, Jeongseon -gun. North of Gangneung are Hyeonbuk-myeon and Hyeonnam-myeon. Gangneung is surrounded in total by five cities and the province of Gangwon-do (Fig. 1).

Fig. 1. The location map of the survey sites.

(3)

It was designated as the low-carbon, green growth pilot city by the Ministry of Lands, Infrastructure and Transport in 2009.

2.2. Methods

The Green City Index was developed by the Economist Intelligence Unit and is sponsored by Siemens, a multinational corporation. It was created to evaluate the environmental sustainability of cities and provide a means of comparing the performance of different cities (EIU, 2011).

Korea is located in East Asia, so it is appropriate to evaluate it according to the index used for Southeast Asia, which encompasses many developing countries.

However, Korea is ranked as a developed country based on its financial and social levels of development.

Accordingly, this study has used the European index system, which considers factors such as energy efficiency and reduction of carbon dioxide, and not developing-country hygiene factors such as drinking water quality and septic tank usage.

The present study used the quantitative evaluation indicator to collect base data for Green City Index evaluations. The multiplicatively weighted application was excluded for base data construction. The seven evaluation items included CO

2

, energy, building, transportation, water, waste and land utility, and atmosphere quality. Table 1 shows the calculation formula and data sources. Evaluation items for CO

2

included CO

2

emissions per capita and GDP;

evaluation items for energy included energy consumption per capita and GDP, and rates of new and renewable energy. For evaluation related to building, house energy was examined. For transport, factors such as alternative forms of transportation and public traffic systems were evaluated. The evaluation of atmosphere quality was based on concentrations of nitrogen dioxide, sulfur dioxide, ozone and PM10. The EIU applied the Green City Index evaluation method taking into consideration data reliability and access,

because cities did not always clearly identify their evaluation data according to the same standards used by the EIU.

For data collection, this study used the national statistics portal to access information about the green climate city registration project, as reported by the Korea Environment Corporation in the Gangneung-si statistics annual report and in statistics from the Ministry of Infrastructure and Transport.

3. Results

Based on the data sources described previously, CO

2

emissions for Gangneung were found to total 6,692,461 tons, which equates to per-capita emissions of 30.8 tons based on the population of Gangneung (216,806 people).

Energy consumption for Gangneung totaled 948,600 TOE (ton of oil equivalent), or 0.23 TOE per capita. Energy consumption per GDP was 0.231 TOE/one million won, based on the total consumption of 948,600 TOE and a GRDP of 2,990,426 million won. The ratio of new and renewable energy sources to existing energy sources was 0.41%, based on total energy consumption of 948,600 TOE and new and renewable energy supplies amounting to 3,928 TOE.

Building energy consumption was 433.5 Mwh/

1,000 m

2

, based on total electric power usage of 2,238,004 Mwh and a total building footprint of 5,162 m

2

. According to data on Gangneung public bus transportation, the ratio of daily public transportation trips to trips by all other forms of transportation came to 19%.

Water consumption per capita totaled 99 m

2

based on total consumption of 21,810,277 m

2

, with an average of 12,514 m

2

of water lost per day, which equates to a per capita loss of 0.057 m

2

.

With a total of 1,690 tons of waste collected annual, daily waste removal came to 0.0008 ton per capita.

Concentrations of NO

2

emissions for the air pollution

(4)

Indicator Formula Data Source

CO

2

Total CO

2

emissions, in tons per capita

Regional CO

2

emissions (ton)/Regional number of population

The volume of CO

2

emission according to the energy resources (Region)

Enrollment Project of Green Climate City

e-local indicator (Population) Korean Statistical Information Service

Total CO

2

emissions, in per unit of real GDP

Regional CO

2

emissions (ton)/Regional GRDP

The volume of CO

2

emission according to the energy resources (Region)

Enrollment Project of Green Climate City

e-local indicator (GRDP) Korean Statistical Information Service

Energy

Total final energy consumption,

per capita

Regional consumption of energy according to the resources (TOE)/

Regional population

Consumption structure according to the energy resources

Korean Statistical Information Service e-local indicator (Population) Korean Statistical Information Service Total final energy

consumption, per unit of real GDP

Regional consumption of energy according to the resources (TOE)/

Regional GRDP

Consumption structure according to the energy resources

Korean Statistical Information Service e-local indicator (GRDP) Korean Statistical Information Service The percentage of

total energy derived from renewable

resources

Amounts of regional renewable energy (TOE)/ Supply Amounts of regional energy

Supply of new and renewable energy (Regional output)

Korean Statistical Information Service Consumption structure according

to the energy resources

Korean Statistical Information Service

Building Energy consumption of the building

Usage of electric power (Types)(TOE)/ Gross floor area of building

Usage of electric power

according to usage types Statistics annual report

Status of regional buildings (Gross floor area)

Statistics System of Ministry of Land, Infrastructure and

Transport

Transportati on

The total percentage of the working

population travelling to work on public

transport

-

Trip ratio according to the transportation means per day (Share ratio)

Statistics annual report

Status of subway operation Korean Statistical Information Service

Water

Total annual water consumption,

per capita

Regional amount of water consumption ( )/

Regional number of population

Amount of water consumption (Metropolitan city & Province)

Korean Statistical Information Service e-local indicator (Population) Korean Statistical Information Service Water lost in the

water distribution system

Regional water lost ( /day)/ Regional number of population

Status of water lost (Average water lost per day)

Korean Statistical Information Service e-local indicator (Population) Statistics annual report

Waste Total annual waste collected, per capita

Regional amounts of waste (ton/day)/

Regional number of population

Environment (Removal of waste)

Korean Statistical Information Service e-local indicator (Population) Statistics annual report

Quality of Atmosphere

Annual mean of

NO

2

emissions - Environment (Air pollution-NO

2

) Statistics annual report Annual mean of SO

2

emissions - Environment (Air pollution-SO

2

) Korean Statistical Information Service Annual mean of O

3

emissions - Air pollution of O

3

according to

the month and city Statistics annual report Annual mean of

PM

10

emissions - Environment

(Air pollution-PM10)

Korean Statistical

Information Service

Table 1. Formula and data collection according to the Indicator of GCI

(5)

Indicator Data Gangneung-si

Value of data Unit Calculated value

Total CO

2

emissions, in tonnes per capita

The volume of CO

2

emission according to the energy resources

(Region)

6,692,461 ton

30.8 ton/capita e-local indicator (Population) 216,806 person

Total CO

2

emissions, in per unit of real

GDP

The volume of CO

2

emission according to the energy resources

(Region)

6,692,461 ton 2.2 ton/one

million won e-local indicator (GRDP) 2,990,426 One million won

Total final energy consumption, per

capita

Consumption structure according

to the energy resources 948,600 TOE 0.231

TOE/capita e-local indicator (Population) 219,274 person

Total final energy consumption, per unit

of real GDP

Consumption structure according

to the energy resources 948,600 TOE 0.317 TOE/one

million won e-local indicator(GRDP) 2,990,426 One million won

The percentage of total energy derived

from renewable resources

Supply of new and renewable

energy (Regional output) 3,928 TOE

0.41%

Consumption structure according

to the energy resources 948,600 TOE

energy consumption of the building

Usage of electric power according

to usage types 2,238,004 MWh

433.5 Mwh/1,000 Status of regional buildings

(Gross floor area) 5,162 1,000

The total percentage of the working population travelling

to work on public transport

Trip ratio according to the transportation means per day

(Share ratio)

19 % 19%

Status of subway operation - - -

Total annual water consumption, per

capita

Amount of water consumption

(Metropolitan city & Province) 21,819,277

99 /person e-local indicator(Population) 219,274 person

Water lost in the water distribution

system

Status of water lost

(Average water lost per day) 12,514 /day 0.057

/day/capita e-local indicator(Population) 219,274 person

Total annual waste collected, per capita

Environment

(Removal of waste) 1,690 ton/day 0.0077

ton/day/capita e-local indicator(Population) 219,274 person

Annual mean of NO

2

emissions Environment(Air pollution-NO

2

) 0.014 ppm/year 0.014 ppm/year

Annual mean of SO

2

emissions

Environment

(Air pollution-SO

2

) 0.005 ppm/year 0.005 ppm/year

Annual mean of O

3

emissions

Air pollution of O

3

according to

the month and city 0.019 ppm/year 0.019 ppm/year

Annual mean of PM

10

emissions

Environment

(Air pollution-PM ) 39 / /year 39 / /year

Table 2. Integration of results according to the application of GCI to Gangneung

(6)

index totaled 0.014 ppm/year, while SO

2

concentrations were 0.005 ppm/year, O

3

concentrations were 0.019 ppm/year and concentrations of PM

10

dust particles were 39 µg/m

2

/year.

Using the Green City Index and data from the National Institute of Environmental Research (2013), the results for Gangneung were compared to other small and medium-sized cities with populations of 200,000 to 400,000 people, including Iksan, Mokpo and Jinju. Out of all of these cities, Gangneung had the highest rates of CO

2

emissions per capita and per GDP, energy consumption per GDP, building energy consumption, waste per capita and annual average SO

2

concentrations. The city ranked second, after Mokpo, in terms of water lost per capita and per day. In water consumption, Gangneung ranked third, after Gumi and Jinju.

Gangneug’s air pollution index, with the exception of SO

2

, compared favorably to that of other cities, as did energy consumption per capita. Even taking error into consideration, CO

2

emissions per capita were high, comparable to those for Seoul, which has emissions of 3.7 tons per capita (EIU, 2011). Based on an analysis of energy consumption rates by source, using data from the city’s energy maintenance corporation, Gangneung has a higher rate of CO

2

emissions from coal than other cities.

Accordingly, Gangneung may in the future need to improve its CO

2

maintenance policies for coal utilities;

it should also consider general improvements for energy, water and waste.

4. Conclusion

The present study collected formula and data of Gangneung where was designated low carbon green city in 2009, using GCI system. The study aimed to reflect GCI system which was designed for low carbon green growth city construction and actively applied in Europe, and to propose data frame according to items

for the construction of reliable and systemic baseline data construction. Total 14 items of 7 division were analyzed based on the basic data frame, and baseline data for Gangneung green city indicator was constructed. Based on the formula proposed by this study, it would be able for baseline data construction of each city. Also there is a critical meaning that it would be able to compare the green growth among cities for some period.

As for the limitation of this study, some errors remained in the comparison between previous data of small and midium cities and present formula of Gangneung. Accordingly further studies would be needed related on baseline data construction using GCI, and weighted value application, and ranking formula. Therefore, could secure competitiveness through construction of low carbon green growth city among foreign and domestic cities.

REFERENCES

Burck, J., Christoph, B., Simone, A., 2008, The climate change performance index results 2009, Germanwatch Inc., Berlin.

Choi, S. Y., 2011, A study on the development of the model and indicators for green growth city, Ph. D.

Dissertation, Dongguk University, Gyeongju.

EIU, 2009, European green city index, Simens, Munich, 51.

EIU, 2011, Asian green city index, Simens, Munich, 63.

Ko, J. K., Kim, H. S., 2010, A study on the development of low carbon green competitiveness indicators of local government Centering of Gyeonggi-do, J.

Local Govern. Stud., 22(3), 175-200.

Lim, D. I., 2011, Analysis of the change of urban structure in Gangneung-city by urban development, J.

Korean Reg. Dev., 10(2), 113-147.

Lee, J. H., 2013, Development and application of quantitative assessment indicators for low-carbon green city, Ph. D. Dissertation, Dongguk University, Gyeongju.

Lee, J. J., Lee, W. H., Kim, D. Y., 2011, A study on the

(7)

local autonomous entity’s establishment of direction for low-carbon green-city policy, Geogr. J. Korea, 45(2), 295-308.

Lee, M. H., Kim, R. H., 2011, A suggestion on the laws and institutions for the green city, Environ. Law Assoc., 33(2), 276-296.

National Institute of Environmental Research, 2013, A study on development and application of green city index for urban environmental management in Korea, National Institute of Environmental Research, Incheon.

Park, J. C., Kim, J. Y., 2010, Urban planning measure -ments in pursuit of a low-carbon green city Case

analyses of basic planning elements and spatial urban structures in Korea and Japan-, J. Korean Reg. Dev.

Assoc., 22(1), 17-52.

Song, K. S., Kim, Y. O., Kwen, Y. H., 2008, A study on construction and application of evaluation indicators in quality of life, Korean J. Local Govern. Stud., 12(4), 225-247.

You, J. H., Park, K. H., Jung, S. G., 2005, A study on

importance of assessment factors and indicators of

natural ecosystem for environmentally friendly land

conservation, J. Environ. Impact Assess., 14(4), 165-

177.

수치

Fig. 1. The location map of the survey sites.
Table 2. Integration of results according to the application of GCI to Gangneung

참조

관련 문서

Incheon Metropolitan City's green projects took first place in the 2016 Green Fund Support Program organized by the Korea Forest Welfare Institute. The ‘Eco Garden’ plan

During the course of the green clothes attitude education program, this study identified that the green clothes attitude education program makes positive

Climate Change, Urban Resillience Green Infrastructure, Zero

It shows that green belt zoning resulted in extension of city size, raising land rent per acre and rental price per square foot of housing floor space,

Source: A Policy on Geometric Design of Highways and Streets (The Green Book)..

MFR-WSAS-G Auto-sleep Workstand for MX-500 Soldering Systems with Green Cradle AC-CK2 Green Cartridge Identification Rings for STTC Cartridges (Pack 50) AC-CK3

Green color indicates that the output shaft of the geared motor rotates in the same direction as the output shaft of the motor..

1 John Owen, Justification by Faith Alone, in The Works of John Owen, ed. John Bolt, trans. Scott Clark, "Do This and Live: Christ's Active Obedience as the