Maltogenic Amylase가 식빵반죽의 물성과 식빵의 품질 특성에 미치는 영향
윤성준1․조남지1․이수정2․문성원3․정윤화4,5
1혜전대학교 제과제빵과, 2부천대학교 식품영양과
3영동대학교 호텔외식조리학과, 4단국대학교 식품영양학과
5단국대학교 글로벌식품산업연구소
Effects of Maltogenic Amylase on Textural Properties of Dough and Quality Characteristics of White Pan Bread
Seongjun Yoon1, Namji Cho1, Soo-Jeong Lee2, Sung-Won Moon3, and Yoonhwa Jeong4,5
1Department of Baking Science and Techonology, Hyejeon College
2Department of Food and Nutrition, Bucheon University
3Department of Hotel & Foodservice Culinary Arts, Youngdong University
4Department of Food Science and Nutrition and 5Institute of Global Food Industry, Dankook University
ABSTRACT Effects of maltogenic amylase on textural properties of dough and quality characteristics of white pan bread were investigated. White pan bread was prepared with four different levels of maltogenic amylase contents (M-1: 0.048 U/g, M-2: 0.060 U/g, M-3: 0.072 U/g, M-4: 0.084 U/g). The setback by amylograph for the control was 480.0±12.25 Brabender Unit (B.U.) while M-4 showed the a setback of 215.0±5.00 B.U. The absorption, mixing tolerance index, and stability by farinogram were not significantly different (P>0.05) for across all treatments. The area under the curve (135 min) by extensogram was higher than all samples. The texture profile analysis results showed that there was significant decreasing in hardness for the maltogenic amylase infused bread (P<0.05). M-3 and M-4 showed higher springiness and cohesiveness but lower hardness than control over 1 to 3 days, indicating possibly extended shelf-life. Imaging scan showed that air cell size less than 0.4 mm2 for the control and M-4 were at rates of 94.90% and 95.70%, respectively. For sensory evaluation, M-3 and M-4 showed higher intensities than the control for taste, flavor, texture, mouthfeel, and moistness quality. These results imply that the quality of white pan bread could be improved by adding maltogenic amylase without the use of chemical additives.
Key words: enzymes, maltogenic amylase, dough, white pan bread, quality
Received 12 January 2015; Accepted 11 February 2015 Corresponding author: Yoonhwa Jeong, Department of Food Sci- ence and Nutrition, Dankook University, Yongin, Gyeonggi 448- 701, Korea
E-mail: [email protected], Phone: +82-31-8005-3176
서 론
최근 자연식품에 관한 소비자들의 관심이 증가하면서 식 품첨가물을 사용하지 않은 식품들의 소비가 증가하고 있다.
더불어 제과제빵업계에서도 소비자들의 욕구를 충족시키기 위해 경쟁이 심화되고 있으며 다양한 제품들을 개발하기 위 해 노력하고 있다.
빵은 구워진 직후 전분 내 수분의 재배치로 이화학적 성질 변화에 의해 전분들끼리 핵을 형성하고 굳어지며 노화(ret- rogradation)된다(1-4). 빵은 풍미의 손실, 이취 발생, 가용 성 전분의 증가, 전분에 대한 효소의 반응과 전분의 결정 및 불투명도 등의 증가로 인하여 노화가 진행된다고 보고되 었다(5-7). 빵의 상업적 저장수명은 약 2일 정도(8)로 짧아
미국의 경우 전체 빵 생산량의 약 3% 정도가 빵의 노화로 인해 폐기(9)되고 있으며, 영국에서도 매년 32만 8천 톤의 빵이 노화로 폐기되어 경제적 부담이 큰 것으로 보고되고 있다(10).
빵의 저장기간 연장과 품질을 개선하기 위해 일반적으로 식품첨가물인 산화제, 반죽 강화제, 환원제, 식품보존료 및 유화제(emulsifiers)가 주로 사용된다. 제빵에 사용되는 유 화제는 전분과 결합하여 수분 보유력을 향상시키고 최종제 품의 부피와 빵 내부구조의 향상 및 밀가루 구성성분들과 상호 작용을 통해 전분의 노화를 지연시키는 효과가 있으며 (11,12), 일반적으로 제빵에 사용되는 유화제는 mono-, di- glyceride, sodium stearoyl-2-lactylate, calcium stearo- yl-2-lactylate, diacetyl tartaric acid ester mono- and diglycerides, sugar ester, polysorbate 60 등의 식품첨가 물이 사용되고 있다(13). 그러나 다량의 식품첨가물의 섭취 에 대한 우려로 인하여 소비자들이 선호하는 건강지향적인 첨가물과 천연물질을 이용한 품질 개선 방법에 관한 연구가
Table 1. Characteristics of maltogenic amylase
Enzymes Origin EC number Stability
Reaction Unit Description of unit pH Temp. (°C)
Maltogenic amylase
Bacillus
subtilis 3.2.1.133 4.0∼8.0 10∼65 Starch+n H2O=n
α-maltose 12 PROMU/g Professional Maltogenic Units 활발히 진행되어 오고 있다.
Cho 등(14,15)은 Bifidobacterium bifidum을 이용한 빵 의 제조방법 연구와 Bifidobacterium bifidum을 첨가한 빵 의 특성, Yoon과 Cho(16)는 maltogenic amylase, pro- tease, lipase 등의 효소를 이용한 식빵의 품질 특성, Yoon 등(17)은 효소를 이용한 제빵용 지방대체제 개발, Cham- berlain 등(18)은 α-maltogenic amylase를 이용한 빵의 품 질 개선을 보고하였다. 효소는 기질특이성(specificity)을 가지고 있으며 생물체 중 생체촉매로서 작용기질에 따라 같 은 효소라도 적정 pH가 달라지므로 제과제빵에서 매우 한정 적으로 사용되어 왔다(19). Lagrain 등(20)은 제빵 시 mal- togenic amylase의 열안정성이 빵의 조직감과 내부구조에 미치는 영향, Kim 등(21)은 fungal α-maltogenic amylase 가 반죽의 특성과 빵의 품질에 미치는 영향을 보고하였으나, 효소를 첨가한 반죽의 리올로지 특성에 대한 연구는 미진한 실정이다.
본 연구에서는 maltogenic amylase가 식빵반죽의 물성 과 식빵내부의 품질 특성에 미치는 영향을 연구하여 제빵에 효소의 적용 가능성을 탐색하고 빵의 상업적 사용 가능성을 높이고자 하였다.
재료 및 방법
Maltogenic amylase
Maltogenic amylase(Table 1)는 Novozyme사(Bag- sværd, Denmark)에서 구입하여 사용하였으며 효소의 첨 가량은 예비실험을 통해 0.048 U/g(M-1), 0.060 U/g(M- 2), 0.072 U/g(M-3), 0.084 U/g(M-4)을 사용하였다.
식빵반죽의 아밀로그라프(amylograph) 특성 측정 식빵반죽의 아밀로그라프 특성은 AACC method 22-10 (22)에 따라 Visco/amylo graph(801360, Brabender Co., Duisburg, Germany)를 이용하여 분석하였다. 강력분(수분 함량 14%) 65 g에 maltogenic amylase를 농도별로 첨가하 여 증류수와 잘 혼합한 다음 30°C에서 95°C까지 1.5°C/min 으로 승온시키고 95°C에서 15분간 유지시킨 다음 63°C까 지 1.5°C/min으로 냉각시키면서 점도 변화를 측정하였다.
아밀로그라프로부터 호화개시온도(°C), 최고점도, 95°C에 서의 점도 및 95°C에서 15분 후의 점도, 점도붕괴도(break- down)와 setback을 구하였다. 호화개시온도는 초기점도가 10 Brabender Unit(B.U.)에 도달하는 온도로 나타내었다.
점도붕괴도는 최고점도와 15분 후의 점도 차이를 측정하였 으며, setback은 냉각 점도(63°C에서의 점도)와 95°C에서
15분 후의 점도 차이로부터 구하였다.
식빵반죽의 파리노그라프(farinograph) 특성 측정 식빵반죽의 파리노그라프 특성은 AACC method 54-21 (23)에 따라 Farinograph(827504, Brabender Co.)를 이 용하여 분석하였다. Farinograph mixing bowl을 30±2°C 로 유지하면서 강력분(수분함량 14%) 300 g에 maltogenic amylase를 농도별로 첨가하여 사용하였다. 밀가루를 1단에 서 2분간 혼합하면서 25초 동안 증류수를 첨가하여 파리노 그라프 곡선의 중앙이 500 B.U.에 도달할 때까지 흡수량을 조절하면서 흡수율(absorption), 반죽도달시간(arrival time), 반죽형성시간(peak time), 안정도(stability) 및 약화도(time to breakdown)를 측정하였다.
식빵반죽의 익스텐소그라프(extensograph) 특성 측정 익스텐소그라프 특성은 AACC method 54-10(24)에 따 라 Extensograph(860013, Brabender Co.)를 이용하여 분 석하였다. 강력분(수분함량 14%) 300 g에 6 g의 식염과 maltogenic amylase를 농도별로 첨가하였다. 물의 양은 파 리노그라프보다 2~4% 적게 사용하였다. 파리노그라프에서 밀가루 반죽을 1분간 혼합한 다음 5분간 방치하고 다시 2분 간 혼합하여 곡선의 중앙이 500 B.U.에 도달하도록 흡수율 을 조절하였다. 반죽을 150±0.1 g으로 분할한 후 라운더에 서 20회 둥글리기 하고 원통형으로 성형하여 30±2°C의 발 효조에서 45분, 90분, 135분 간격으로 발효시킨 후 익스텐 소그램을 측정하였다. 반죽의 신장도(extension), 저항도 (resistance) 및 전체면적(total area)을 측정하였고, 신장 도는 커브의 전체길이(cm)로 표시하였으며, 신장도에 대한 저항도(resistant to extension)는 익스텐소그라프 시작점 부터 5 cm의 높이(B.U.)를 측정하였다.
식빵의 제조방법
식빵은 Finney 등(25)의 방법을 변형한 직접 반죽법을 사용하여 제조하였으며, 반죽의 배합비율은 Table 2와 같 다. 식빵의 반죽은 혼합기(A200, Hobart, Troy, OH, USA) 를 사용하여 쇼트닝을 제외한 나머지 원료를 볼(bowl)에 넣 고 1단(61/107 rpm)과 2단(113/196 rpm)에서 각각 3분간 혼합하여 반죽의 표면이 매끄러운 상태(clean-up stage)가 된 후 쇼트닝을 첨가하였다. 2단(113/196 rpm)에서 반죽이 형성될 때까지 9분간 혼합하였으며, 최종 반죽의 온도는 27°C가 되도록 하였다. 1차 발효는 온도 27°C, 습도 75%인 발효기(Daehung Machinery Co., Namyangju-si, Korea) 에서 90분간 실시하였으며, 1차 발효 후 반죽을 180 g으로
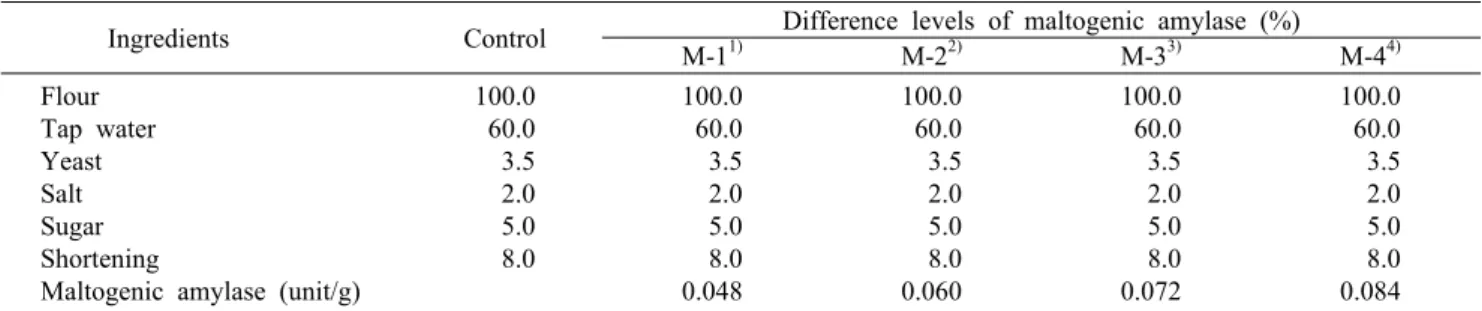
Table 2. Formula for white pan bread preparation with four different levels of maltogenic amylases (Baker’s %) Ingredients Control Difference levels of maltogenic amylase (%)
M-11) M-22) M-33) M-44)
Flour Tap water Yeast Salt Sugar Shortening
Maltogenic amylase (unit/g)
100.0 60.0 3.5 2.0 5.0 8.0
100.0 60.0 3.5 2.0 5.0 8.0 0.048
100.0 60.0 3.5 2.0 5.0 8.0 0.060
100.0 60.0 3.5 2.0 5.0 8.0 0.072
100.0 60.0 3.5 2.0 5.0 8.0 0.084
1)Maltogenic amylase 0.048 unit. 2)Maltogenic amylase 0.060 unit.
3)Maltogenic amylase 0.072 unit. 4)Maltogenic amylase 0.084 unit.
분할하여 둥글리기 한 후 15분간 중간발효를 실시하였다.
밀대를 이용하여 가스빼기를 하고 반죽을 원통형으로 성형 하여 식빵 틀(195×95×95 mm)에 3개씩 넣고 온도 38°C, 습도 85%의 발효기에서 식빵 틀 상단 1 cm 높이로 반죽이 팽창될 때까지 2차 발효를 실시하였다. 2차 발효가 끝난 반 죽은 윗불 170°C, 아랫불 190°C의 오븐(3D-403, Daiah Commercial Co., Ltd., Seoul, Korea)에서 30분간 구운 후 상온(온도 25±2°C, 습도 70±10%)에서 빵의 내부온도가 32°C로 될 때까지 1시간 동안 냉각하고 폴리에틸렌 수지로 포장한 후 25°C에서 저장하면서 실험재료로 사용하였다.
Texture profile analysis 특성 측정
Texture profile analysis는 시료를 오븐에서 꺼내고 상 온에서 1시간 방치 후, 폴리에틸렌 백에 넣고 상온(25°C)에 서 5일간 보관하면서 측정하였다. 식빵의 속살 중심부를 2×
2×2 cm로 자른 다음 texture analyzer(TA-XT2, stable micro systems, Surrey, UK)를 이용하여 측정하였다. 이때 사용한 cylinder probe는 75 mm, pre-test speeds는 1.0 mm/s, test speed 및 post test speed는 5.0 mm/s로 하였 으며, 시료의 경도(hardness), 탄력성(springiness), 응집 성(cohesiveness), 검성(gumminess), 씹힘성(chewiness) 을 9회 반복 측정하였다.
이미징 스캔(Imaging scan)
Imaging scan은 시료를 오븐에서 꺼내고 상온에서 1시간 방치 후, 폴리에틸렌 백에 넣고 상온(25°C)에서 1일 저장 후 20 mm 두께로 잘라서 이미징 스캐너(ASE, American Institute of Baking, Manhattan, KS, USA)에 넣고 최종제 품 표면에 대한 기공의 크기(air cell size)와 기공의 크기에 따른 기공의 수를 관찰하기 위하여 식빵을 9개의 영역으로 나누어 표면 특성과 내부조직의 기공 상태를 측정하였다.
관능검사
관능검사는 시료들 간의 차이 식별을 위하여 15명의 패널 을 선발하여 최종제품의 관능적 품질 항목을 90일간 반복 훈련한 후 관능검사를 실시하였다. 관능검사는 제조 후 상온 보관 1일 이후에 실시하였으며, 실험실에서 테이블에 칸막
이를 설치하여 실시하였다. 식빵의 껍질을 제거하고 2×2×
2 cm 크기로 잘라 1회용 접시에 5개씩 담아 물과 함께 무작 위로 패널에게 제시하였다. 내부 색상(crumb color), 맛 (taste), 풍미(flavor), 조직감(texture), 식감(mouthfeel), 촉촉한 정도(moistness quality)의 강도를 9점 척도(1=매 우 약하다, 9=매우 강하다)를 이용하여 평가하였다. 각 시료 별 관능검사 후 물로 입을 헹군 다음 다른 시료를 검사하였 으며, 외형적 검사는 동일한 장소에서 식빵을 무작위로 제공 하여 부피(volume), 외부색상(crust color)에 대하여 평가 하였다.
통계 분석
모든 실험의 데이터는 MinitabⓇ 16.2.1 Package(Min- itab Inc., College Station, PA, USA)를 이용하여 분산분석 (analysis of variance, ANOVA)을 하였다. 시간에 따른 차 이가 없는 항목은 일원분산(one-way ANOVA)으로 진행 후 시료 간의 차이 유무를 파악하기 위해 Fisher’s least sig- nificant difference(LSD) test로 유의적 차이를 검정하였 다. TPA 측정은 시료 간의 차이와 시간에 따른 차이를 이원 분산(two-way ANOVA)으로 진행 후 시료 간의 차이 유무 를 파악하기 위해 Fisher’s LSD test를 진행하였다. 모든 통계적 유의 수준은 5%로 하였다.
결과 및 고찰
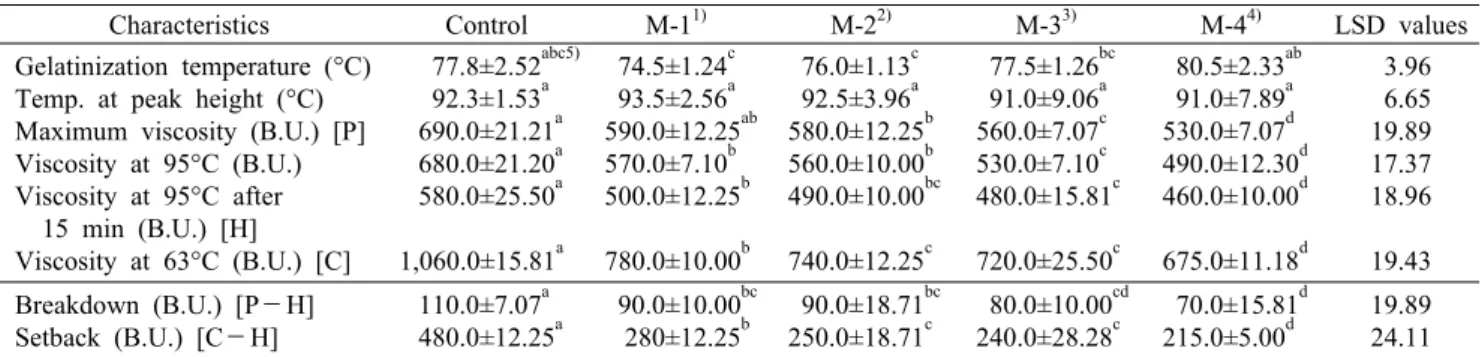
식빵반죽의 아밀로그램
식빵반죽의 아밀로그램은 Table 3과 같다. 최고점도 (maximum viscosity)는 대조군이 690.0±21.21 B.U.이었 으며, setback은 480.0±12.25 B.U., breakdown은 110.0
±7.07 B.U.로 나타났다. Maltogenic amylase 첨가군의 최 고점도는 M-1이 590.0±12.25 B.U., M-2는 580.0±12.25 B.U., M-3은 560±7.07 B.U., M-4는 530.0±7.07 B.U.로 maltogenic amylase의 첨가량이 증가할수록 최고점도는 유 의적으로 감소하는 경향을 나타내었다(P<0.05). Setback 또한 M-1이 280.0±12.25 B.U., M-2가 250.0±18.71 B.U., M-3이 240.0±28.28 B.U., M-4가 215.0±5.00 B.U.로 maltogenic amylase의 첨가량이 증가할수록 유의
Table 3. Amylogram of flour with four different levels of maltogenic amylases
Characteristics Control M-11) M-22) M-33) M-44) LSD values Gelatinization temperature (°C)
Temp. at peak height (°C) Maximum viscosity (B.U.) [P]
Viscosity at 95°C (B.U.) Viscosity at 95°C after 15 min (B.U.) [H]
Viscosity at 63°C (B.U.) [C]
77.8±2.52abc5) 92.3±1.53a 690.0±21.21a 680.0±21.20a 580.0±25.50a 1,060.0±15.81a
74.5±1.24c 93.5±2.56a 590.0±12.25ab 570.0±7.10b 500.0±12.25b 780.0±10.00b
76.0±1.13c 92.5±3.96a 580.0±12.25b 560.0±10.00b 490.0±10.00bc 740.0±12.25c
77.5±1.26bc 91.0±9.06a 560.0±7.07c 530.0±7.10c 480.0±15.81c 720.0±25.50c
80.5±2.33ab 91.0±7.89a 530.0±7.07d 490.0±12.30d 460.0±10.00d 675.0±11.18d
3.96 6.65 19.89 17.37 18.96 19.43 Breakdown (B.U.) [P-H]
Setback (B.U.) [C-H]
110.0±7.07a 480.0±12.25a
90.0±10.00bc 280±12.25b
90.0±18.71bc 250.0±18.71c
80.0±10.00cd 240.0±28.28c
70.0±15.81d 215.0±5.00d
19.89 24.11
1)Maltogenic amylase 0.048 unit. 2)Maltogenic amylase 0.060 unit.
3)Maltogenic amylase 0.072 unit. 4)Maltogenic amylase 0.084 unit.
5)Means within a row with different letters are significantly different at P<0.05 by Fisher’s least significant difference (LSD) test.
Table 4. Farinogram of flour with four different levels of maltogenic amylase
Characteristics Control M-11) M-22) M-33) M-44) LSD values Absorption (%)
Mixing tolerance index (B.U.) Arrival time (min)
Peak time (min) Departure time (min) Stability (min)
Time to breakdown (min) Valorimeter value (unit)
65.1±0.61a5) 29.8±7.09a 1.2±0.05a 5.8±0.19a 23.6±1.38a 22.4±0.75a 10.5±0.81a 90.0±7.07b
64.9±2.81a 30.0±2.12a 1.2±0.07a 5.5±0.16c 23.6±0.46a 22.4±0.85a 10.6±0.98a 120.0±7.07a
64.7±1.43a 30.0±2.24a 1.2±0.05a 5.7±0.07bc 23.7±1.35a 22.5±0.76a 10.5±0.57a 110.0±7.07a
64.5±1.41a 30.0±1.58a 1.2±0.05a 5.6±0.16bc 23.6±0.93a 22.4±3.89a 10.5±0.14a 110.0±7.07a
64.1±2.64a 30.0±3.54a 1.2±0.05a 5.7±0.19bc 23.6±0.49a 22.4±1.09a 10.5±0.38a 120.0±7.07a
3.01 5.64 0.09 0.20 1.46 2.34 0.78 10.95
1)Maltogenic amylase 0.048 unit. 2)Maltogenic amylase 0.060 unit.
3)Maltogenic amylase 0.072 unit. 4)Maltogenic amylase 0.084 unit.
5)Means within a row with different letters are significantly different at P<0.05 by Fisher’s least significant difference (LSD) test.
적으로 감소하였다.
Breakdown 역시 M-1과 M-2가 각각 90.0±10.00 B.U., 90.0±18.71 B.U., M-3과 M-4가 각각 80.0±10.00 B.U., 70.0±15.81 B.U.로 maltogenic amylase 농도가 증 가할수록 유의적으로 감소하였다(P<0.05). 이러한 결과는 maltogenic amylase의 첨가량이 증가할수록 최고점도와 breakdown이 감소한다는 Leman 등(26)의 연구 결과와 유 사하였으며, 또한 maltogenic amylase의 첨가량이 증가하 면 전분의 dextrin 함량이 증가되고 전분의 점성을 저하시켜 호화점도와 최고점도가 낮아져 부드러운 조직이 형성된다 는 Shin(27)과 Goesaert 등(28)의 연구 결과와 유사하였다.
식빵반죽의 파리노그램
Maltogenic amylase의 첨가량에 따른 식빵반죽의 파리 노그램은 Table 4와 같다. 대조군의 흡수율은 65.1±0.61%, 첨가군인 M-1은 64.9±2.81%, M-2는 64.7±1.43%, M-3 은 64.5±1.41%, M-4는 64.1±2.64%로 maltogenic amy- lase의 첨가량이 증가함에 따라 감소하는 경향을 나타내었 으나 유의적 차이는 없었다(P<0.05). 이러한 현상은 α-mal- togenic amylase를 첨가한 반죽의 점탄성은 감소하며 반죽 의 흡수율에 영향을 미친다는 Harinder와 Bains(29)의 연 구 결과와 유사하였다. Mixing tolerance index(MTI)는 모 든 첨가군이 30.0 B.U.로 대조군의 29.0 B.U.보다 약간 높 았으나 유의적 차이는 없었다.
Arrival time은 대조군과 모든 첨가군이 1.2분 정도로 유 의적인 차이가 없었으며, departure time은 약 23분 정도고 stability는 departure time에서 1.2분을 뺀 22분 정도로 유의적 차이가 없었다. 반면 peak time은 대조군이 5.8분으 로 가장 높았으며, 모든 첨가군이 5.5~5.7분으로 유의적인 차이가 있었다(P<0.05). Valorimeter value는 대조군이 90.0 unit으로 가장 낮았으며, 모든 첨가군이 110~120 unit 으로 유의적으로 증가하였다(P<0.05). Valorimeter value 는 혼합시간과 혼합에 대한 저항성의 지표로서 일반적으로 강력분은 100 이상, 박력분은 70 이하를 설정하고 있다(30).
식빵반죽의 익스텐소그램
대조군과 첨가군의 익스텐소그램은 Table 5와 같다. 45 분 후의 resistance to extensibility(RTE), extensibility (EXT), area under curve(AUC)와 RTE/EXT는 대조군과 첨가군 모두 유의적 차이가 없었으나 90분 후 RTE와 EXT 는 대조군이 각각 285±11.18, 211±8.69, maltogenic amylase 첨가군이 각각 290±12.25~295±11.18, 212±
4.69~216±8.86으로 유의적으로 증가하였다(P<0.05). 반면 RTE/EXT는 대조군과 maltogenic amylase 첨가군 간의 유의적 차이는 없었다(P<0.05). 135분 후의 RTE와 EXT는 유의적 차이가 없었으나 부피를 의미하는 AUC는 malto- genic amylase의 첨가량이 증가할수록 대조군보다 유의적 으로 증가하였으며(P<0.05) 반죽에 maltogenic amylase
의 첨가량이 증가할수록 이미징 스캔의 기공 크기와 기공의 수에 영향을 주어 부피를 향상시키는 것으로 나타났다.
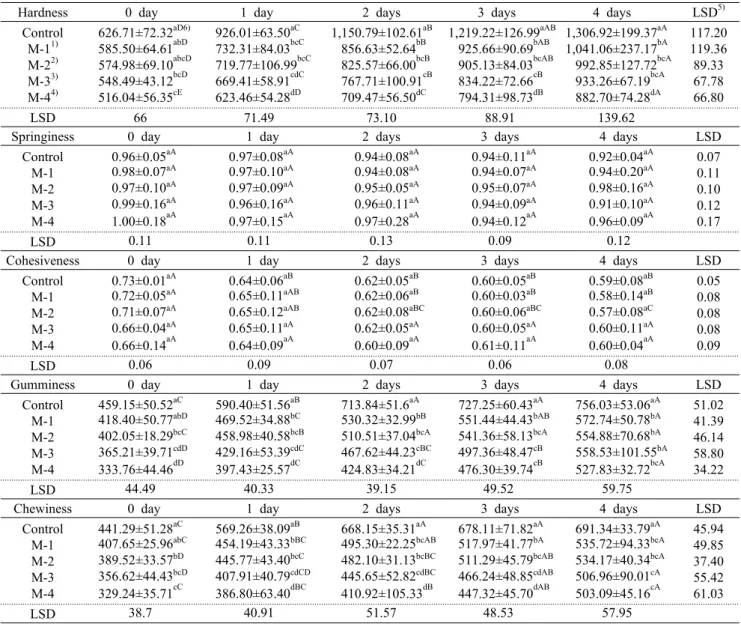
식빵의 texture profile analysis(TPA)
식빵을 25°C에서 5일간 보관하면서 대조군과 malto- genic amylase 첨가군의 TPA를 측정하였다(Table 6). 대 조군의 0일차 경도는 626.71±72.32였으며 1일차 926.01
±63.50, 2일차 1,150.79±102.61, 3일차 1,219.22±126.99, 4일차 1,306.92±199.37이었다. Maltogenic amylase 첨가 군의 경도는 대조군과 비교하여 첨가량이 증가할수록 유의 적으로 낮아졌으며(P<0.05), M-3, M-4의 4일차 경도는 각 각 933.26±67.19, 882.70±74.28로 대조군의 1일차(926.01
±63.50)와 비교하여 유의적으로 증가하지 않아(P<0.05) 1
~3일 정도 노화가 지연된 것으로 생각된다. 식빵의 탄력성 과 응집성에서 대조군과 첨가군 간에 유의적 차이는 없었으 나(P<0.05), 점착성과 씹힘성은 경도와 마찬가지로 대조군 과 비교하여 maltogenic amylase의 첨가량이 증가할수록 유의적으로 감소하여(P<0.05) maltogenic amylase 첨가 에 의하여 노화가 지연되는 것으로 여겨진다(28). 제빵에 효소를 사용하는 목적은 밀가루에 부족한 효소를 보충하여 효모(yeast)의 활성에 필요한 발효성 당을 생산하고 발효를 촉진하여 반죽 내에 존재하는 무기질에 의해 반죽이 산성화 (acidification)되어 빵의 저장성을 향상시킨다는 연구 결과 와 유사하였다(31). 이상의 실험 결과로 maltogenic amy- lase 첨가군의 경도는 유의적으로 낮았는데(P<0.05), 이는 부피가 빵 내부조직의 경도와 관련이 깊다고 보고한 Faubion 과 Faridi(32)의 연구 결과와 같이 빵의 노화를 지연시키는 효소들의 함량이 증가되어 빵의 수분함량이 증가하고 전분 을 액화시켜 덱스트린과 같은 고 흡수성 물질이 형성되었기 때문인 것으로 생각된다. 이러한 경향은 아밀로그램에서 maltogenic amylase 첨가군의 setback이 낮아져 저장성에 영향을 미쳐 TPA에 영향을 미친 것으로 생각되며, 빵의 경 도는 빵 내부의 수분함량이 많을수록, 비용적이 증가할수록 감소한다는 보고와 유사하였다(33,34). 따라서 대조군과 비 교하여 maltogenic amylase 첨가군 M-3과 M-4의 경도가 가장 낮았으며, 탄력성과 응집성은 증가하고 점착성과 씹힘 성이 낮아져 식감 개선에 긍정적이라 생각된다.
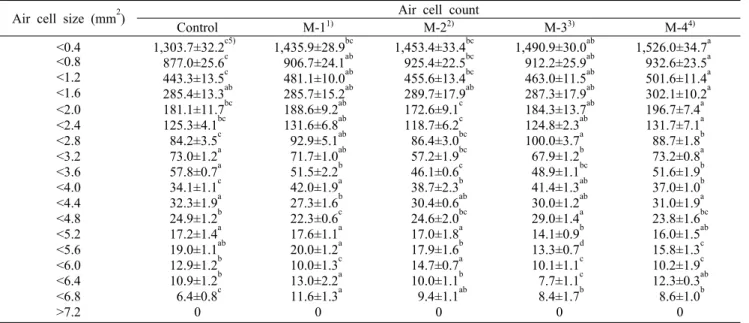
식빵의 imaging scan
식빵의 내부조직 특성을 알아보기 위해 식빵의 단면을 9 구역으로 나누어 기공 크기, 기공의 수를 측정하였다(Tables 7, 8). 식빵의 평균 기공의 크기가 가장 작은 구역은 오븐의 전도열이 가장 빠른 식빵 바닥 3, 6, 9구역으로 나타났다.
오븐스프링과 밀접한 관계를 가진 구역은 1, 2, 4, 5, 7, 8구 역으로 나타났으며 4구역(식빵의 가장 높은 부위)과 5구역 (식빵의 중심부)의 평균 기공의 크기가 가장 큰 것으로 나타 났다. 4구역과 5구역은 대조군이 각각 1.28±0.06, 1.26±
0.05였으며, M-1이 각각 1.26±0.08, 1.28±0.07, M-2가
Table 6. TPA of white pan bread with four different levels of maltogenic amylases
Hardness 0 day 1 day 2 days 3 days 4 days LSD5) Control
M-11) M-22) M-33) M-44)
626.71±72.32aD6) 585.50±64.61abD 574.98±69.10abcD 548.49±43.12bcD 516.04±56.35cE
926.01±63.50aC 732.31±84.03bcC 719.77±106.99bcC 669.41±58.91cdC 623.46±54.28dD
1,150.79±102.61aB 856.63±52.64bB 825.57±66.00bcB 767.71±100.91cB
709.47±56.50dC
1,219.22±126.99aAB 925.66±90.69bAB 905.13±84.03bcAB 834.22±72.66cB 794.31±98.73dB
1,306.92±199.37aA 1,041.06±237.17bA 992.85±127.72bcA 933.26±67.19bcA 882.70±74.28dA
117.20 119.36
89.33 67.78 66.80
LSD 66 71.49 73.10 88.91 139.62
Springiness 0 day 1 day 2 days 3 days 4 days LSD
Control M-1 M-2 M-3 M-4
0.96±0.05aA 0.98±0.07aA 0.97±0.10aA 0.99±0.16aA 1.00±0.18aA
0.97±0.08aA 0.97±0.10aA 0.97±0.09aA 0.96±0.16aA 0.97±0.15aA
0.94±0.08aA 0.94±0.08aA 0.95±0.05aA 0.96±0.11aA 0.97±0.28aA
0.94±0.11aA 0.94±0.07aA 0.95±0.07aA 0.94±0.09aA 0.94±0.12aA
0.92±0.04aA 0.94±0.20aA 0.98±0.16aA 0.91±0.10aA 0.96±0.09aA
0.07 0.11 0.10 0.12 0.17
LSD 0.11 0.11 0.13 0.09 0.12
Cohesiveness 0 day 1 day 2 days 3 days 4 days LSD
Control M-1 M-2 M-3 M-4
0.73±0.01aA 0.72±0.05aA 0.71±0.07aA 0.66±0.04aA 0.66±0.14aA
0.64±0.06aB 0.65±0.11aAB 0.65±0.12aAB 0.65±0.11aA 0.64±0.09aA
0.62±0.05aB 0.62±0.06aB 0.62±0.08aBC 0.62±0.05aA 0.60±0.09aA
0.60±0.05aB 0.60±0.03aB 0.60±0.06aBC 0.60±0.05aA 0.61±0.11aA
0.59±0.08aB 0.58±0.14aB 0.57±0.08aC 0.60±0.11aA 0.60±0.04aA
0.05 0.08 0.08 0.08 0.09
LSD 0.06 0.09 0.07 0.06 0.08
Gumminess 0 day 1 day 2 days 3 days 4 days LSD
Control M-1 M-2 M-3 M-4
459.15±50.52aC 418.40±50.77abD 402.05±18.29bcC 365.21±39.71cdD 333.76±44.46dD
590.40±51.56aB 469.52±34.88bC 458.98±40.58bcB 429.16±53.39cdC 397.43±25.57dC
713.84±51.6aA 530.32±32.99bB 510.51±37.04bcA 467.62±44.23cBC 424.83±34.21dC
727.25±60.43aA 551.44±44.43bAB 541.36±58.13bcA 497.36±48.47cB 476.30±39.74cB
756.03±53.06aA 572.74±50.78bA 554.88±70.68bA 558.53±101.55bA 527.83±32.72bcA
51.02 41.39 46.14 58.80 34.22
LSD 44.49 40.33 39.15 49.52 59.75
Chewiness 0 day 1 day 2 days 3 days 4 days LSD
Control M-1 M-2 M-3 M-4
441.29±51.28aC 407.65±25.96abC 389.52±33.57bD 356.62±44.43bcD 329.24±35.71cC
569.26±38.09aB 454.19±43.33bBC 445.77±43.40bcC 407.91±40.79cdCD 386.80±63.40dBC
668.15±35.31aA 495.30±22.25bcAB 482.10±31.13bcBC 445.65±52.82cdBC 410.92±105.33dB
678.11±71.82aA 517.97±41.77bA 511.29±45.79bcAB 466.24±48.85cdAB 447.32±45.70dAB
691.34±33.79aA 535.72±94.33bcA 534.17±40.34bcA 506.96±90.01cA 503.09±45.16cA
45.94 49.85 37.40 55.42 61.03
LSD 38.7 40.91 51.57 48.53 57.95
1)Maltogenic amylase 0.048 unit. 2)Maltogenic amylase 0.060 unit. 3)Maltogenic amylase 0.072 unit.
4)Maltogenic amylase 0.084 unit. 5)LSD values.
6)Means within a column (a-d) and a row (A-E) with different letters are significantly different at P<0.05 by Fisher’s least significant difference (LSD) test.
각각 1.34±0.12, 1.32±0.04, M-3이 각각 1.34±0.06, 1.34±0.05, M-4는 각각 1.37±0.08, 1.36±0.05로 malto- genic amylase의 첨가량이 증가할수록 평균 기공의 크기는 유의적으로 증가하였다(P<0.05). 기공의 크기가 0.4~3.2 mm2는 대조군이 3,373.00±203.34, M-1이 3,594.20±
175.43, M-2가 3,559.00±194.59, M-3이 3,630.40±
204.48, M-4가 3,752.60±187.84로 maltogenic amylse 의 첨가량이 증가할수록 미세기공의 수는 증가하였다. 기공 의 크기가 3.2 mm2 이상은 maltogenic amylase의 첨가량 이 증가할수록 대조군과 비교하여 조밀하고 일정한 기공구 조를 가진 것으로 나타나 빵의 부피는 빵 내부의 기공 수의 변화와 기공의 신장성 증가와 밀접한 관계가 있다는 연구 결과(35)와 유사하였다.
식빵의 관능검사
식빵의 관능검사 결과는 Table 9와 같다. 맛은 대조군이 5.60±1.84, M-1이 5.87±1.51, M-2가 5.80±1.21, M-3 은 6.07±1.75, M-4가 6.00±1.77로 나타나 대조군과 비교 하여 유의적으로 높았다(P<0.05). 풍미는 대조군과 비교하 여 maltogenic amylase 첨가량이 증가할수록 높은 점수를 얻었는데 이러한 현상은 α-1,4 글리코사이드 결합의 분열 을 촉진하여 맥아당의 생성량이 증가하여 풍미에 영향을 주 는 것으로 알려져 있다(36). 식감, 촉촉한 정도 역시 malto- genic amylase 첨가량이 증가할수록 높은 점수를 얻었으나 유의적 차이는 없었다. Maltogenic amylase의 첨가량이 증 가할수록 dextrin 함량이 증가되어(37) 조직감, 식감 및 촉 촉한 감촉에서 높은 점수를 얻은 것으로 생각된다.
Table 7. Numbers of air cells of white pan bread with four different levels of maltogenic amylases
Air cell size (mm2) Air cell count
Control M-11) M-22) M-33) M-44)
<0.4
<0.8
<1.2
<1.6
<2.0
<2.4
<2.8
<3.2
<3.6
<4.0
<4.4
<4.8
<5.2
<5.6
<6.0
<6.4
<6.8
>7.2
1,303.7±32.2c5) 877.0±25.6c 443.3±13.5c 285.4±13.3ab 181.1±11.7bc 125.3±4.1bc 84.2±3.5c 73.0±1.2a 57.8±0.7a 34.1±1.1c 32.3±1.9a 24.9±1.2b 17.2±1.4a 19.0±1.1ab 12.9±1.2b 10.9±1.2b 6.4±0.8c
0
1,435.9±28.9bc 906.7±24.1ab 481.1±10.0ab 285.7±15.2ab 188.6±9.2ab 131.6±6.8ab 92.9±5.1ab 71.7±1.0ab 51.5±2.2b 42.0±1.9a 27.3±1.6b 22.3±0.6c 17.6±1.1a 20.0±1.2a 10.0±1.3c 13.0±2.2a 11.6±1.3a
0
1,453.4±33.4bc 925.4±22.5bc 455.6±13.4bc 289.7±17.9ab 172.6±9.1c 118.7±6.2c 86.4±3.0bc 57.2±1.9bc 46.1±0.6c 38.7±2.3b 30.4±0.6ab 24.6±2.0bc 17.0±1.8a 17.9±1.6b 14.7±0.7a 10.0±1.1b 9.4±1.1ab
0
1,490.9±30.0ab 912.2±25.9ab 463.0±11.5ab 287.3±17.9ab 184.3±13.7ab 124.8±2.3ab 100.0±3.7a 67.9±1.2b 48.9±1.1bc 41.4±1.3ab 30.0±1.2ab 29.0±1.4a 14.1±0.9b 13.3±0.7d 10.1±1.1c 7.7±1.1c 8.4±1.7b
0
1,526.0±34.7a 932.6±23.5a 501.6±11.4a 302.1±10.2a 196.7±7.4a 131.7±7.1a 88.7±1.8b 73.2±0.8a 51.6±1.9b 37.0±1.0b 31.0±1.9a 23.8±1.6bc 16.0±1.5ab 15.8±1.3c 10.2±1.9c 12.3±0.3ab 8.6±1.0b
0
1)Maltogenic amylase 0.048 unit. 2)Maltogenic amylase 0.060 unit.
3)Maltogenic amylase 0.072 unit. 4)Maltogenic amylase 0.084 unit.
5)Means within a row with different letters are significantly different at P<0.05 by Fisher’s least significant difference test.
Table 8. Average cell size of white pan bread with four different levels of maltogenic amylases
Control M-11) M-22) M-33) M-44) LSD values
Area 1 Area 2 Area 3 Area 4 Area 5 Area 6 Area 7 Area 8 Area 9
1.12±0.09cB5) 1.16±0.10bcA 0.89±0.05dB 1.28±0.06aB 1.26±0.05aB 1.05±0.03cdB 1.22±0.03bB 1.15±0.18bcA 0.91±0.04dA
1.21±0.17abAB 1.16±0.12bA 0.91±0.07dAB 1.26±0.08aB 1.28±0.07aB 0.99±0.04cdC 1.24±0.07abAB 1.19±0.12abA 0.92±0.19dA
1.23±0.09abA 1.16±0.09bA 0.94±0.03dA 1.34±0.12aA 1.32±0.04aA 1.07±0.07cAB 1.24±0.17abAB 1.18±0.11bA 0.93±0.04dA
1.24±0.05bA 1.16±0.08cA 0.93±0.06dA 1.34±0.06aA 1.34±0.05aA 1.08±0.06cdAB 1.26±0.12bAB 1.19±0.10bcA 0.96±0.10dA
1.24±0.08bA 1.16±0.05cA 0.94±0.03dA 1.37±0.08aA 1.36±0.05aA 1.15±0.09cA 1.29±0.27abA 1.19±0.04bcA 0.94±0.05dA
0.20 0.15 0.09 0.13 0.11 0.10 0.26 0.19 0.13
LSD values 0.15 0.17 0.16 0.12 0.20 0
1)Maltogenic amylase 0.048 unit. 2)Maltogenic amylase 0.060 unit.
3)Maltogenic amylase 0.072 unit. 4)Maltogenic amylase 0.084 unit.
5)Means within a column (a-d) and a row (A-C) with different letters are significantly different at P<0.05 by Fisher’s least significant difference (LSD) test.
Table 9. Sensory evaluation of white pan bread with four different levels of maltogenic amylases
Classification Control M-11) M-22) M-33) M-44)
Volume Crust color Crumb color Taste Flavor Texture Mouthfeel Moistness
5.40±1.35c5) 7.00±1.85a 5.80±1.74b 5.60±1.84b 5.00±1.09b 6.13±1.51a 5.87±1.60a 6.00±1.65a
5.67±1.50ab 6.00±1.60a 5.80±1.42b 5.87±1.51ab 6.00±1.93a 6.40±1.06a 6.13±1.51a 6.20±1.21a
5.80±1.15ab 6.00±1.60a 5.93±1.03ab 5.80±1.21ab 6.07±1.39a 6.40±1.18a 6.33±1.35a 6.20±1.21a
6.07±1.33ab 5.87±0.92a 6.20±1.42a 6.07±1.75a 6.20±1.52a 6.60±2.06a 6.33±1.45a 6.27±1.39a
6.40±0.51a 5.60±1.84a 6.53±1.36a 6.00±1.77a 6.20±1.90a 6.67±1.59a 6.53±1.55a 6.53±1.85a
1)Maltogenic amylase 0.048 unit. 2)Maltogenic amylase 0.060 unit.
3)Maltogenic amylase 0.072 unit. 4)Maltogenic amylase 0.084 unit.
5)Means with the different letters for each attribute are significantly different (P<0.05) using the Fisher’s least significance difference test.
Maltogenic amylase 첨가군은 대조군보다 맛, 풍미, 조 직감, 식감 그리고 촉촉한 정도에서 더 높은 점수를 나타내
어 제빵 시 maltogenic amylase 첨가군 M-3, M-4를 사용 하는 것이 식빵에서 맛, 풍미, 조직감, 식감과 촉촉한 정도
등을 개선할 수 있을 것으로 생각된다. 이러한 이유는 α- maltogenic amylase의 작용과 β-maltogenic amylase의 당화 작용 기능이 상호 보완되면서 맥아당을 생성하게 되고 맥아당과 포도당들은 이스트에 의하여 이산화탄소 발생에 이용될 뿐만 아니라 굽기 단계까지 존재하며 캐러멜화 반응 과 멜라노이딘 반응을 촉진시키고 빵의 방향성분인 카아보 닐 화합물을 생성케 하여 겉껍질 색상과 풍미를 향상시킨다 는 연구 결과(19)와 유사하였다.
요 약
식빵반죽의 아밀로그램의 setback은 대조군이 480.0±12.25 B.U., M-4가 215.0±5.00 B.U.로 maltogenic amylase의 첨가량이 증가할수록 유의적으로 감소하였다. 파리노그램 특성은 흡수율, mixing tolerance index, stability 등 대조 군과 maltogenic amylase의 첨가군과 유의적인 차이는 없 었다. 익스텐소그램의 RTE(resistance to extensibility)/
EXT(extensibility)는 대조군과 첨가군 간에 유의적 차이는 없었으나 RTE 90분과 AUC(area under curve) 135분에서 대조군과 비교하여 유의적으로 증가하여(P<0.05) 식빵반죽 에 maltogenic amylase를 사용하면 빵의 부피에 영향이 있 을 것으로 판단되었다. 식빵의 texture profile analysis는 대조군과 비교하여 maltogenic amylase 첨가군의 경도가 유의적으로 낮게 나타났으며(P<0.05) M-3, M-4가 대조군 과 비교하여 약 1~3일 정도 노화가 지연된 것으로 생각된 다. 빵의 탄력성과 응집성은 대조구와 유의적 차이는 없었으 나 점착성과 씹힘성은 유의적으로 감소하여(P<0.05) 식감 개선에 영향을 주는 것으로 나타났다. Imaging scan 결과 대조군과 비교하여 4, 5구역의 평균 기공 크기는 malto- genic amylase 첨가량이 증가할수록 유의적으로 증가하였 으며(P<0.05) 0.4 mm2 이하의 미세기공은 maltogenic amylase의 첨가량이 증가할수록 94.90~95.70%로 대조군 과 비교하여 조밀하고 일정한 기공구조를 가진 것으로 나타 나, 빵의 부피는 빵 내부의 기공 수, 기공의 신장성 증가와 밀접한 관계가 있었다. 관능검사는 맛, 풍미, 조직감, 식감과 촉촉한 정도가 대조구와 비교하여 높게 나타났다. 이상의 결과로 maltogenic amylase를 식빵반죽에 첨가 시 반죽의 물성이 개선되었으며 식빵 내부구조가 조밀하고 일정한 기 공구조를 형성하여 식감과 관능검사에서 우수한 결과를 나 타내어 화학적 첨가물을 사용하지 않고도 식빵의 품질을 향 상시킬 수 있음을 확인하였다.
REFERENCES
1. Kim SK. 1987. Gelatinization and retrogradation have a close relation of food industry. Monthly Food Industry 54:
58-63.
2. Gedders WF, Bice CW. 1946. The role of starch in bread staling. Quartermaster Corps Report QMC 17-10. Office of the Quartermaster General, Washington, DC, USA.
3. Hertz KO. 1965. Staling of bread, a review. Food Technol 19: 1828.
4. D’Appolonia BL, Morad MM. 1981. Bread staling. Cereal Chem 58: 186-190.
5. Pyler EJ. 1988. Baking science & technology. 3rd ed. Sos- land Publishing Co., Marriam, KS, USA. p 402-411.
6. Bechtel WG, Meisner DF, Bradley WB. 1953. The effect of the crust on the staling of bread. Cereal Chem 30: 160- 168.
7. Bice CW, Geddes WF. 1949. Studies on bread staling. Ⅳ.
Evaluation of methods for the measurement of changes which occur during bread staling. Cereal Chem 26: 440-465.
8. Maga JA, Ponte JG. 1975. Bread staling. CRC Crit Rev Food Technol 5: 443-486.
9. Zobel HF, Kulp K. 1996. The staling mechanism. In Baked Goods Freshness; Technology, Evaluation, and Inhibition of Staling. Hebeda RE, Zobel HF, eds. Marcel Dekker, Inc., New York, NY, USA. p 1-64.
10. Michael J, Geoffrey C, David D, James G, Hall P, Jones L, Lepper D, Anne M, Rogerson D, Soulsby P, Strang G, Tipping P, Roger W. 2010. Waste Strategy for England 2007. The House of Commons, London, UK. p 3-55.
11. Tamstorf S, Jonsson T, Krog N. 1986. Ice crystallization and its control in frozen-food systems. In Food Structure and Behaviour. Blanshard JMV, Lillford P, eds. Academic Press, London, UK. p 51-65.
12. Blanshard JMV, Frazier PJ, Galliard T. 1987. Chemistry and physics of baking. Blanshard JMV, Frazier PJ, Galliard T, eds. The Royal Society of Chemistry, London, UK. p 75-88.
13. Kim SK, Cho NJ, Kim YH, Yoon SJ, Lee JJ, Jung SK, Chea DJ. 2009. Baking science. BNC World, Seoul, Korea. p 198.
14. Cho NJ, Kim HY, Kim SK. 1999. Effect of flour brew with Bifidobacterium bifidum as a natural bread improver. J Korean Soc Food Sci Nutr 28: 1275-1282.
15. Cho NJ, Lee SK, Kim SK, Joo HK. 1998. Effect of wheat flour brew with Bifidobacterium bifidum on rheological properties of wheat flour dough. Korean J Food Sci Technol 30: 832-841.
16. Yoon SJ, Cho NJ. 2010. Quality characteristics of white pan bread by using fat-substitutes. Korean J of Baking 2:
6-11.
17. Yoon SJ, Cho NJ, Jeong YH. 2008. Development of a car- bohydrate-based fat replacement for use in bread making.
J East Asian Soc Dietary Life 18: 1032-1038.
18. Chamberlain N, Collins TH, Mcdermott EE. 1981. Alpha- amylase and bread properties. Int J Food Sci Technol 16:
127-152.
19. Cho NJ, Kim YH, Ahn HK, Shin SN, Hwang YK. 2000.
Science of baking materials. BNC World, Seoul, Korea. p 48-52.
20. Lagrain B, Leman P, Goesaert H, Delcour JA. 2008. Impact thermostable amylases during bread making on wheat bread crumb structure and texture. Food Res Int 41: 819-827.
21. Kim JH, Maeda T, Morita N. 2006. Effect of fungal α-amyl- ase on the dough properties and bread quality of wheat flour substituted with polished flours. Food Res Int 39: 117-126.
22. AACC. 2000. Approved Method of the AACC. 10th ed.
American Association of Cereal Chemists, St. Paul, MN, USA. Methods 22-10.
23. AACC. 2000. Approved Method of the AACC. 10th ed.
American Association of Cereal Chemists, St. Paul, MN, USA. Methods 54-21.
24. AACC. 2000. Approved Method of the AACC. 10th ed.
American Association of Cereal Chemists, St. Paul, MN,
USA. Methods 54-10.
25. Finney KF. 1984. An optimized, straight dough, bread mak- ing method after 44 years. Cereal Chem 61: 20-27.
26. Leman P, Goesaert H, Vandeputte GE, Lagrain B, Delcour JA. 2005. Maltogenic amylase has a non-typical impact on the molecular and rheological properties of starch. Carbo- hydr Polym 62: 205-213.
27. Shin GM. 2008. Quality characteristics of white pan bread added with Poria cocos powder. J East Asian Soc Dietary Life 18: 554-562.
28. Goesaert H, Slade L, Levin H, Delcour JA. 2009. Amylases and bread firming: an integrated view. J Cereal Sci 50: 345- 352.
29. Harinder K, Bains GS. 1987. High α-amylase flours: Effect of pH, acid, and salt on paste characteristics. Cereal Chem 64: 359-363.
30. Kim SK, Cho NJ, Kim YH, Yoon SJ, Lee JJ, Jung SK, Chea DJ. 2009. Farinograph. In Baking Science. BNC World, Seoul, Korea. p 164-173.
31. Reed G. 1975. Health and legal aspects of the use of en-
zymes. InEnzymes in Food Processing. 2nd ed. Academic Press, New York, NY, USA. p 549-554.
32. Faubion JM, Faridi H. 1985. Dough rheololgy. In Rheology of Wheat Products. Faridi H, ed. American Association of Cereal Chemistry Inc., St. Paul, MN, USA. p 1-9.
33. Bechtel WG, Meisner DF. 1954. Staling studies of bread made with flour fractions. Cereal Chem 31: 182-187.
34. Martine ML, Hoseney RC. 1991. A mechanism of bread firming. Ⅱ. Role of starch hydrolyzing enzymes. Cereal Chem 68: 503-507.
35. Sroana BS, Beanb SR, MacRitchie F. 2009. Mechanism of gas cell stabilization in bread making. Ⅰ. The primary glu- ten-starch matrix. J Cereal Sci 49: 32-40.
36. Pomeranz Y, Finney KF. 1975. Sugars in breadmaking.
Baker’s Digest 49: 20-27.
37. Synowiecki J. 2007. The use of starch processing enzymes in the food industry. In Industrial Enzymes: Structure, Function and Applications. Polaina J, MacCabe AP, eds.
Springer, Dordrecht, The Netherlands. p 19-34.